. 2016 May 13;7(6):2163-73.
doi: 10.1364/BOE.7.002163. eCollection 2016 Jun 1.

Astigmatic multifocus microscopy enables deep 3D super-resolved imaging

Affiliations

Astigmatic multifocus microscopy enables deep 3D super-resolved imaging

Laura Oudjedi et al. Biomed Opt Express. .

Abstract

We have developed a 3D super-resolution microscopy method that enables deep imaging in cells. This technique relies on the effective combination of multifocus microscopy and astigmatic 3D single-molecule localization microscopy. We describe the optical system and the fabrication process of its key element, the multifocus grating. Then, two strategies for localizing emitters with our imaging method are presented and compared with a previously described deep 3D localization algorithm. Finally, we demonstrate the performance of the method by imaging the nuclear envelope of eukaryotic cells reaching a depth of field of ~4µm.

Keywords: (050.1380) Binary optics; (050.1950) Diffraction gratings; (100.6640) Superresolution; (110.1080) Active or adaptive optics; (180.2520) Fluorescence microscopy; (180.6900) Three-dimensional microscopy.


Figures
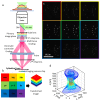
Fig. 1
Fig. 1
(a) Schematic illustration of the 3D-MF-SMLM optical setup. The MFG (multifocus grating) splits the fluorescence light into 9 diffractive orders. The chromatic correction module composed of the CCG (chromatic correction grating) and a multifacet prism compensates for chromatic dispersion induced by the MFG and redirects light to the camera. The cylindrical lens introduces astigmatism on the PSF of the emitters imaged on the camera chip. (b) The 9 panels of the camera chip correspond to 9 planes at different axial positions along the optical axis and can be aligned to form a 3D image. (c) Camera image of a sample of fluorescent beads imaged by the 3D-MF-SMLM microscope. The PSF is elongated in different directions in the panels below and above the focal panel of the beads (central panel on this image). (d) 3D shape of the asymmetric PSF of a fluorescent bead. This 3D PSF was acquired by z scanning the bead in the axial direction.
Fig. 2
Fig. 2
Characterization of the multiple focus grating. (a) Scanning electron microscopy and (b) atomic force microscopy (height) images of the binary MFG designed for 9 planes microscopy. The red line indicates the position where the depth profile was acquired. (c) Depth profile of the grating pattern. (d) Axial projection of the image stack acquired during calibration. (e) The entropy in an ROI containing a bead was calculated as a function of axial position for each panel of the camera image. Each panel is represented by a different color. Minimum in the entropy profile represents the piezoelectric stage position at which the plane is in focus.
Fig. 3
Fig. 3
(a) RapidStorm calibration curves. Width of the PSF in x (wx ○) and y (wy + ) as a function of the axial position of the fluorescent bead. Solid lines represent the fitted functions used for axial position computation. Each color represents the wx and wy calibration profiles for a different plane. (b) Reconstructed localizations of the beads positions during z scan. These localizations were computed using RapidStorm. Beads can be continuously followed in an imaging depth of just over 4 µm. Each color corresponds to a different imaging panel. (c) Cross correlation map of the PSF library with itself used for our cross correlation localization algorithm. Colorbar represents degree of cross-correlation (a value of 1 representing complete correlation). Each profile correlated perfectly with itself and reasonably well with profiles at nearby z-positions. (d) Cross-correlation coefficient of the image of a bead with the PSF of the library as a function of the axial position of the PSF of the library (inset: image of the bead). The maximum of this profile corresponds to the axial position of the imaged bead. (e) Reconstructed localizations of the beads during a z-scan. These localizations were computed with our cross-correlation localization algorithm. Each color corresponds to a different imaging panel. As for RapidStorm fitting, beads could be continuously followed in an imaging depth of > 4 µm.
Fig. 4
Fig. 4
(a-c) 3D-MF-SMLM images of fluorescent beads at 3 different excitation powers P1 (a) < P2 (b) < P3 (c). Only the plane (i.e. panel) corresponding to the position closest to the emitters focal plane is displayed. The colormap corresponds to the log of the signal. All images are represented using the same color scale. (d-g) Comparison of localization precisions for △ conventional MFM, asymmetric gaussian fit and x cross correlation localization methods. (d) Lateral localization precision as a function of excitation power. Arrows indicate the powers corresponding to the images shown in (a-c). (f) Axial localization precision as a function of excitation power.(e) Lateral localization precision as a function of the number of detected photons. (g) Axial localization precision as a function of the number of detected photons. In panels e and g, filled symbols represent localization precisions measured for single Cy3b molecules, and grayed areas symbolize the typical range of detected photons associated to single molecule emission.
Fig. 5
Fig. 5
(a) Raw image of lamina-Cy3b during 3D-MF-SMLM acquisition. Yellow arrow on the top left panel indicates the bead used for drift correction. (b) Axial projection of the 3D image of lamina Cy3b in the cell indicated by the white rectangle on the different panels of the raw image. (c) Projection of the same image in the longitudinal plane. Scale bar, 1µm. Color bar represents axial position.
Fig. 6
Fig. 6
Two-color 3D-SM-SMLM images of the bithorax complex domain (grey) and the Fab-7 locus (orange). (a) Axial projection of the 3D reconstruction and (b) projection in the (x,z) plane of the same reconstruction. Scale bar, 200 nm.

References

    1. Betzig E., Patterson G. H., Sougrat R., Lindwasser O. W., Olenych S., Bonifacino J. S., Davidson M. W., Lippincott-Schwartz J., Hess H. F., “Imaging intracellular fluorescent proteins at nanometer resolution,” Science 313(5793), 1642–1645 (2006).10.1126/science.1127344 - DOI - PubMed
    1. Rust M. J., Bates M., Zhuang X., “Sub-diffraction-limit imaging by stochastic optical reconstruction microscopy (STORM),” Nat. Methods 3(10), 793–796 (2006).10.1038/nmeth929 - DOI - PMC - PubMed
    1. Hess S. T., Girirajan T. P. K., Mason M. D., “Ultra-High Resolution Imaging by Fluorescence Photoactivation Localization Microscopy,” Biophys. J. 91(11), 4258–4272 (2006).10.1529/biophysj.106.091116 - DOI - PMC - PubMed
    1. Huang B., Wang W., Bates M., Zhuang X., “Three-dimensional super-resolution imaging by stochastic optical reconstruction microscopy,” Science 319(5864), 810–813 (2008).10.1126/science.1153529 - DOI - PMC - PubMed
    1. Izeddin I., El Beheiry M., Andilla J., Ciepielewski D., Darzacq X., Dahan M., “PSF shaping using adaptive optics for three-dimensional single-molecule super-resolution imaging and tracking,” Opt. Express 20(5), 4957–4967 (2012).10.1364/OE.20.004957 - DOI - PubMed