. 2016 Aug;48(8):912-8.
doi: 10.1038/ng.3595. Epub 2016 Jul 4.

Genome-wide association of multiple complex traits in outbred mice by ultra-low-coverage sequencing

Affiliations

Genome-wide association of multiple complex traits in outbred mice by ultra-low-coverage sequencing

Jérôme Nicod et al. Nat Genet. 2016 Aug.

Abstract

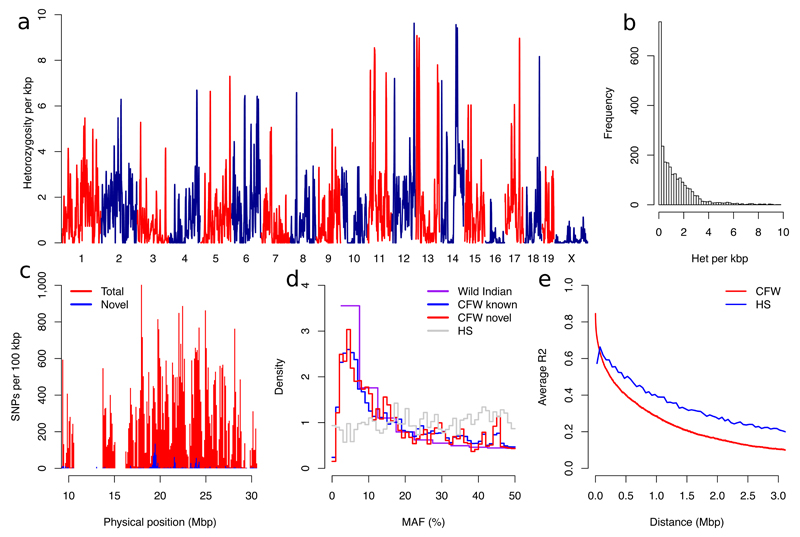
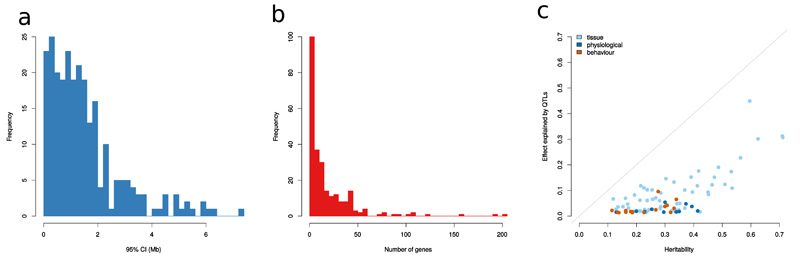
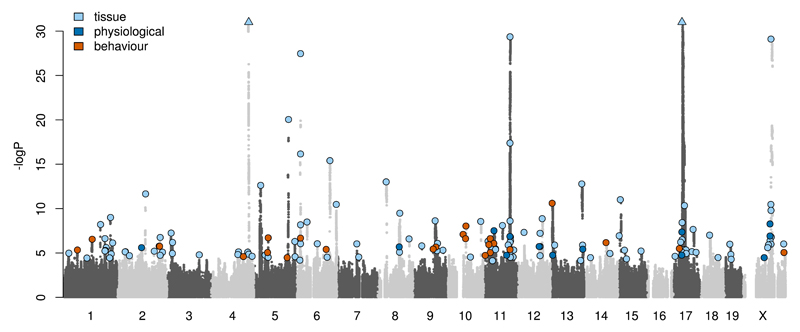
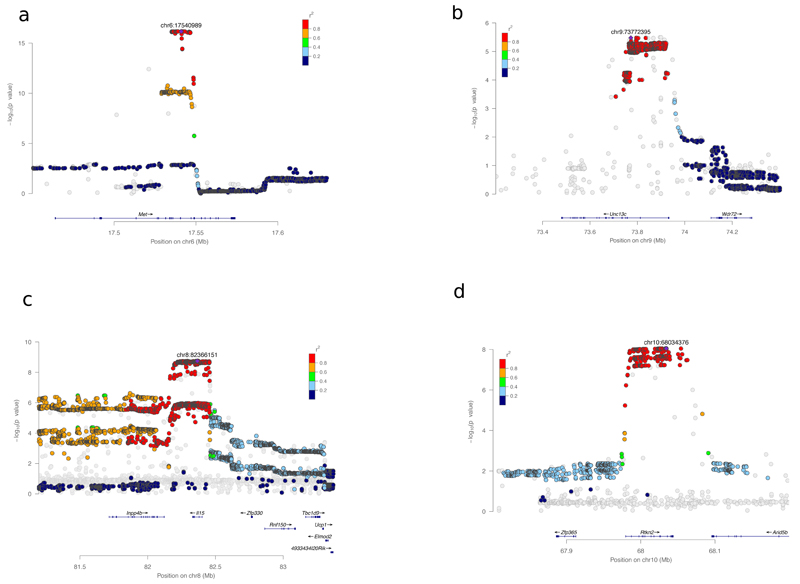
Two bottlenecks impeding the genetic analysis of complex traits in rodents are access to mapping populations able to deliver gene-level mapping resolution and the need for population-specific genotyping arrays and haplotype reference panels. Here we combine low-coverage (0.15×) sequencing with a new method to impute the ancestral haplotype space in 1,887 commercially available outbred mice. We mapped 156 unique quantitative trait loci for 92 phenotypes at a 5% false discovery rate. Gene-level mapping resolution was achieved at about one-fifth of the loci, implicating Unc13c and Pgc1a at loci for the quality of sleep, Adarb2 for home cage activity, Rtkn2 for intensity of reaction to startle, Bmp2 for wound healing, Il15 and Id2 for several T cell measures and Prkca for bone mineral content. These findings have implications for diverse areas of mammalian biology and demonstrate how genome-wide association studies can be extended via low-coverage sequencing to species with highly recombinant outbred populations.


Conflict of interest statement

The authors declare no competing financial interests.

Figures

Figure 1
Figure 1
Sequence diversity of the CFW population. (a) Distribution of heterozygosity in 100kbp windows genome-wide. (b) Histogram of genome-wide heterozygosity. (c) Example of novel and total SNP density for a region of chromosome 19. Results are representative of those seen genome-wide. (d) Minor allele frequency (MAF) density for population of wild Indian (n=10, 44.9 M whole genome sequencing SNPs), CFW mice (n=2,073, 5.7M imputed SNPs) and HS mice (n=1,904, 11K SNPs from a genotyping array). Known CFW variation refers to those variants also segregating among 14 sequenced classical inbred strains. (e) The extent of linkage disequilibrium in CFW and HS mice. Values are mean r2 between all pairs of SNPs binned by distance to the kbp.
Figure 2
Figure 2
Mapping resolution and effect size of QTLs. Frequency distribution of (a) the size and (b) the number of genes present in the 95% confidence intervals (CI) in 255 QTLs, (c) The sum of variance explained by the QTLs plotted against heritability in 92 measures where heritability could be estimated and at least one QTL was detected. Colour of dots indicates the type of measure: behaviour, physiological (body weight, respiratory, electrocardiography) or tissue (any measure obtained after dissection)
Figure 3
Figure 3
Summary Manhattan plot of 92 phenotypes. Genome-wide representation of all unique QTLs (n=156, FDR<5%) identified in this study. Light and dark grey dots show association from the 92 measures where at least one QTL was detected at the tagging SNPs positions (n=359,559). Most significant SNPs at each QTL are marked with a colour dot, depending on the type of measure. Y-axis shows –log10(P) of the imputed allele dosages with tested measures and is truncated at –log10(P)=32. The position of the 2 strongest QTLs with –log10(P) values of 133 (chr4) and 76 (chr17) is marked by triangles.
Figure 4
Figure 4
Single-gene resolution mapping at 4 loci using the entire set of SNPs (7.1 M). (a) Weight of soleus muscle on chromosome 6 (n=1832), (b) Measure of the number of long sleep episodes on chromosome 9 (n=1577), (c) Ratio of CD4+ to CD8+ T cells (CD3+) on chromosome 8 (n=1324) and (d) Intensity of reaction to startle on chromosome 10 (n=1740). The plots were drawn using LocusZoom . Strongest associated SNP is marked with a purple diamond, the other SNPs that passed post-imputation quality control (IMPUTE2-style INFO scores > 0.4 and HWE r2>1e-6,) are coloured following LD r2 with strongest SNP. The grey dots represent SNPs that failed post-imputation QC and therefore were not used for the analysis.

References

    1. Flint J, Eskin E. Genome-wide association studies in mice. Nat Rev Genet. 2012;13:807–17. - PMC - PubMed
    1. Visscher PM, Brown MA, McCarthy MI, Yang J. Five years of GWAS discovery. Am J Hum Genet. 2012;90:7–24. - PMC - PubMed
    1. Atwell S, et al. Genome-wide association study of 107 phenotypes in Arabidopsis thaliana inbred lines. Nature. 2010;465:627–31. - PMC - PubMed
    1. Huang X, et al. Genome-wide association studies of 14 agronomic traits in rice landraces. Nat Genet. 2010;42:961–7. - PubMed
    1. Yalcin B, et al. Commercially available outbred mice for genome-wide association studies. PLoS Genet. 2010;6:e1001085. - PMC - PubMed

Publication types

Substances