. 2016 Aug;48(8):904-911.
doi: 10.1038/ng.3606. Epub 2016 Jul 4.

Hierarchy within the mammary STAT5-driven Wap super-enhancer

Affiliations

Hierarchy within the mammary STAT5-driven Wap super-enhancer

Ha Youn Shin et al. Nat Genet. 2016 Aug.

Abstract

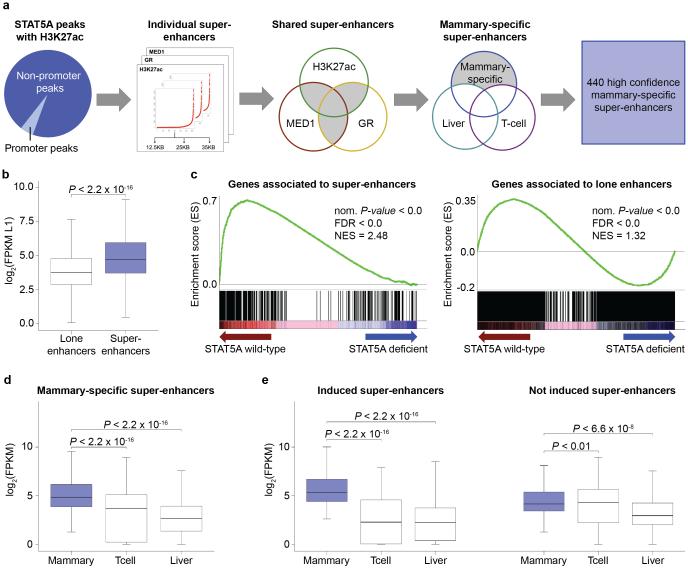
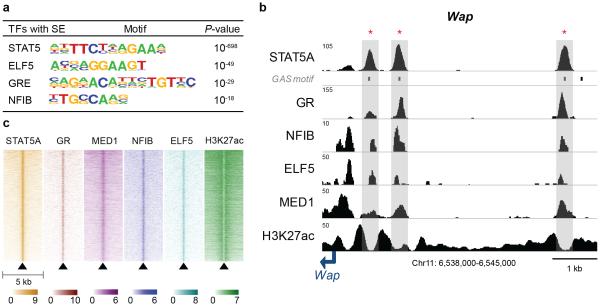
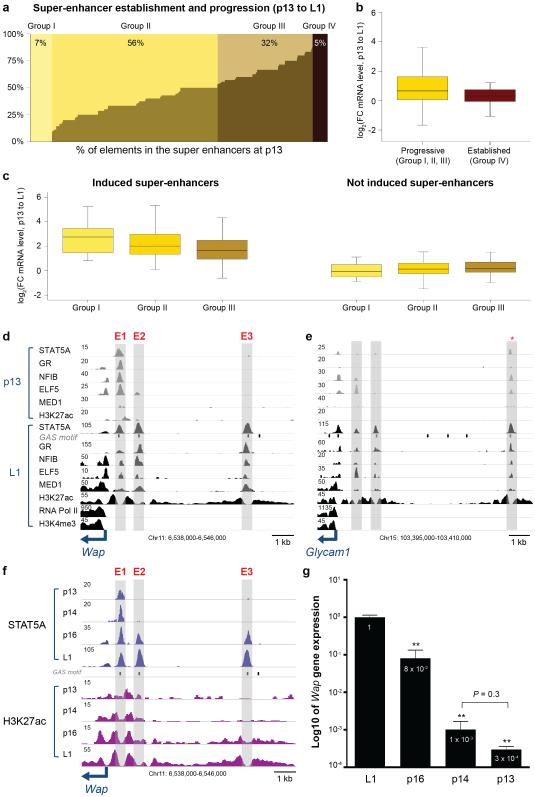
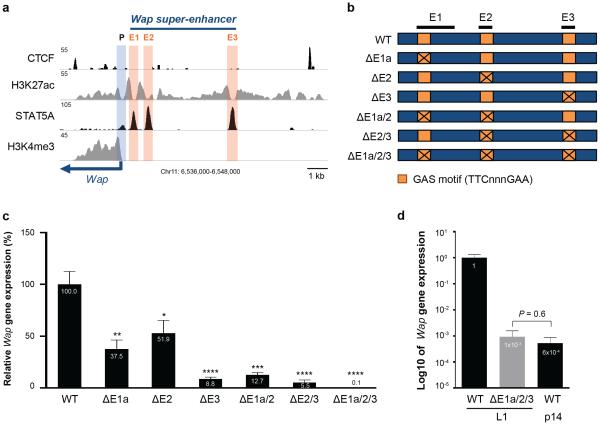
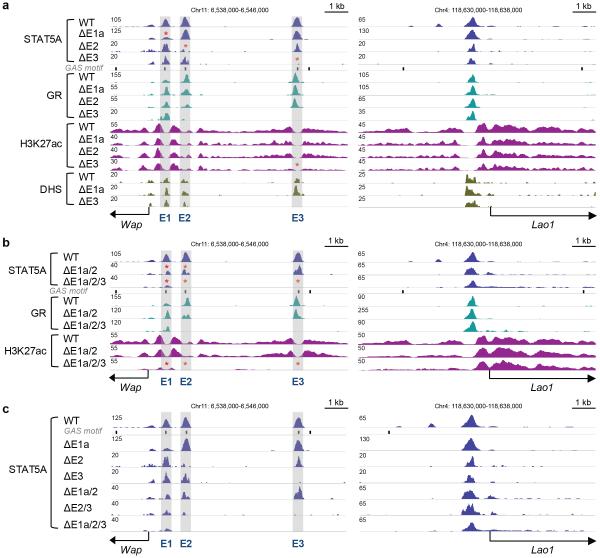
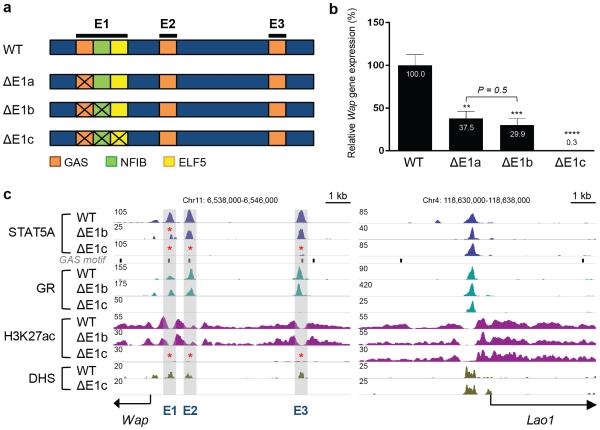
Super-enhancers comprise dense transcription factor platforms highly enriched for active chromatin marks. A paucity of functional data led us to investigate the role of super-enhancers in the mammary gland, an organ characterized by exceptional gene regulatory dynamics during pregnancy. ChIP-seq analysis for the master regulator STAT5A, the glucocorticoid receptor, H3K27ac and MED1 identified 440 mammary-specific super-enhancers, half of which were associated with genes activated during pregnancy. We interrogated the Wap super-enhancer, generating mice carrying mutations in STAT5-binding sites within its constituent enhancers. Individually, the most distal site displayed the greatest enhancer activity. However, combinatorial mutation analysis showed that the 1,000-fold induction in gene expression during pregnancy relied on all enhancers. Disabling the binding sites of STAT5, NFIB and ELF5 in the proximal enhancer incapacitated the entire super-enhancer. Altogether, these data suggest a temporal and functional enhancer hierarchy. The identification of mammary-specific super-enhancers and the mechanistic exploration of the Wap locus provide insights into the regulation of cell-type-specific expression of hormone-sensing genes.


Figures

Figure 1
Figure 1
Identification of mammary-specific super-enhancers. (a) Out of 10,953 peaks coinciding with H3K27ac marks, 549 are located in promoter regions and 10,404 within non-promoter regions. The 10,404 STAT5 peaks, together with H3K27ac, GR and MED1, served as basis for the super-enhancer analysis, using three stitched sizes as parameter for the calculations. The final steps comprised overlapping them per size and subtracting super-enhancers shared with T cells and liver and a total of 440 mammary-specific bona fide super-enhancers were identified. (b) The boxplot depicts the significant higher expression level of 384 genes associated with super-enhancers (mean ~5,931 FPKM) compared to 4,384 genes linked to lone enhancers (mean ~31 FPKM) at day one of lactation (L1) (cutoff of 5 FPKM). Median, middle bar inside the box; IQR, 50% of the data; whiskers, 1.5 times the IQR. (c) Gene Set Enrichment Analysis shows that super-enhancers are less enriched in STAT5A deficient samples (70% reduction) suggesting that those genes are more sensitive to changes of STAT5 levels and further implying that the super-enhancers are mammary-specific (Nom P-value, nominal P-value; FDR, false discovery rate; NES, normalized enrichment score). (d) Boxplot shows that the expression of the 384 genes associated with mammary-specific super-enhancer is significantly elevated at L1, compared to T cells and liver tissue. (e) Super-enhancer associated genes were categorized into genes induced at least 2-fold between pregnancy day 6 (p6) and L1 (198), and not induced genes (186). Notably, induced genes exhibit lineage specificity and their expression in T cell and liver was greatly lower.
Figure 2
Figure 2
Transcription factor binding signatures in mammary-specific super-enhancers. (a) Motif analysis within mammary-specific super-enhancers. Predicted motifs for transcription factors critical for mammary development were highly enriched in mammary-specific super-enhancers (±200 bp). (b) Transcription factor binding profiles of constituent enhancers within a mammary-specific super-enhancer. The Wap mammary-specific super-enhancer was shown as a representative example and the constituent enhancers were indicated as red asterisk. The data represent the biological duplicates. (c) Heatmap of transcription factor binding, STAT5A, GR, MED1, NFIB, ELF5, and H3K27ac within a 5 kb region around the center of hotspots in mammary-specific super-enhancers. The y-scale is sorted by the row sum of the STAT5A values for all transcription factors.
Figure 3
Figure 3
Assembly of constituent enhancers in mammary-specific super-enhancers during pregnancy. (a) Seven percent of super-enhancers have no established peaks at day 13 of pregnancy (p13), 56% are occupied less than half, 32% are more than half, and 5% are already established at p13. (b) Genes associated with progressive super-enhancers (418) show higher induction levels than those fully occupied at p13 (22). Median, middle bar inside the box; IQR, 50% of the data; whiskers, 1.5 times the IQR. (c) Progressive enhancers associated with genes induced during pregnancy show a higher induction than those associated to not induced genes. Super-enhancers having no established enhancers at p13 show the highest induction followed by those with less than 50% and more than 50% pre-occupied enhancers (left). (d) Establishment of enhancers within the mammary-specific Wap super-enhancer. Only enhancer 1 (E1) is occupied by mammary-enriched transcription factors at p13, whereas E2 and E3 are exclusively occupied at day 1 of lactation (L1). Data represent biological duplicates. (e) Progressive establishment of the mammary-specific Glycam1 super-enhancer. One (asterisk) out of three individual enhancers is already occupied by mammary transcription factors at p13 and all three enhancers are fully occupied at lactation. (f) Establishment of individual enhancers within the mammary-specific Wap super-enhancer across different pregnancy stages. Only E1 is occupied by STAT5A and H3K27ac at p13 and p14, whereas all three enhancers are fully occupied at p16 and L1. (g) Wap mRNA levels in mammary tissue at different pregnancy stages. L1, n = 6; p16, p14, p13, n = 3. The casein locus served as a control (Supplementary Fig 6).
Figure 4
Figure 4
In vivo functions of individual enhancers within the mammary-specific super-enhancer of the Wap gene. (a) Genomic features of E1, E2, and E3 in the Wap locus. (b) Schematics of single enhancer mutations (ΔE1a, ΔE2 and ΔE3) and combined mutations (ΔE1a/2, ΔE2/3, ΔE1a/2/3) in the mouse genome. Exact deletions are shown in Supplementary Fig 9. (c) Wap mRNA levels in mammary tissues from mice carrying individual enhancer mutants (ΔE1a, ΔE2 and ΔE3) and combined mutants (ΔE1a/2, ΔE2/3, ΔE1a/2/3) at day 1 of lactation (L1). Wap mRNA levels were measured by qRT-PCR and normalized to Gapdh. Results are means of independent biological replicates with s.e.m. (WT, n = 9; ΔE1a, n = 7; ΔE2, n = 10; ΔE3, n = 7; ΔE1a/2, n = 3; ΔE2/3, n = 3; ΔE1a/2/3, n = 3). A two-tailed unpaired t-test was used to evaluate the statistical significance of differences between WT and each mutant group (*P < 0.05, **P < 0.001, ***P < 0.0001, ****P < 0.00001). Wap expression was reduced by approximately 91% in ΔE3 mutant mice and over 99.9% in ΔE1a/2/3 mutant mice. (d) Comparison of Wap mRNA levels in mammary tissues from ΔE1a/2/3 mutant mice at L1 and from WT controls at different stages (L1 and p14). Results are shown in log10 of means (error bars, s.e.m; n = 3). Wap expression was reduced 1,000-fold in ΔE1a/2/3 mutant mice compared to WT at L1 and was equivalent to WT p14.
Figure 5
Figure 5
Structural consequences resulting from the loss of STAT5 binding at individual and combined enhancers in the mammary-specific Wap super-enhancer. (a) ChIP-Seq profiles and DNaseI hypersensitive sites (DHS) at the Wap locus in mammary tissue from single enhancer mutants at day one of lactation (L1). The Lao1 locus served as a ChIP-Seq control. The data for STAT5A and H3K27ac ChIP-Seq represent biological duplicates. STAT5A binding was reduced at site E1 in ΔE1a mutants and at E2 in ΔE2 mutants. GR binding and H3K27ac marks were retained in ΔE1a and ΔE2 mutants. STAT5A binding, GR binding and H3K27ac marks were lost at site E3 in ΔE3 mutants. (b) ChIP-Seq profiles in combined enhancer mutant mice. The data for STAT5A, GR and H3K27ac ChIP-Seq represent biological duplicates. STAT5A binding was reduced at site E1 and E2 and GR binding and H3K27ac marks were retained in mammary tissue from ΔE1a/2 mutants. Complete absence of STAT5A and GR binding, H3K27ac marks at E2 and E3 in mammary tissue from ΔE1a/2/3 mutants. Residual marks were retained at E1. (c) STAT5A ChIP-Seq profiles in single and combined enhancer mutant mice. STAT5A binding at the E3 site plays the most prominent role in Wap super-enhancer.
Figure 6
Figure 6
In vivo function of the epicenter within E1 of the Wap super-enhancer. (a) Diagram of mutations within E1, inactivating binding of STAT5 alone, STAT5 and NFIB, and STAT5, NFIB and ELF5. (b) Wap mRNA levels in mammary tissues from ΔE1a, ΔE1b and ΔE1c mutant mice at day 1 of lactation (L1). Wap mRNA levels were measured by qRT-PCR and normalized to Gapdh. Results are means of independent biological replicates with s.e.m. (WT, n = 9; ΔE1a, n = 7; ΔE1b, n = 7; ΔE1c, n = 5). A two-tailed unpaired t-test was used to evaluate the statistical significance of differences between WT and each mutant group (**P < 0.001, ***P < 0.0001, ****P < 0.00001). Wap expression levels between ΔE1a and ΔE1b were not significantly different (P = 0.5). Wap expression was reduced by 99.7% in ΔE1c mutant mice. (c) Genomic features of ΔE1b and ΔE1c mutant mice. The data for STAT5A and H3K27ac ChIP-Seq represent biological duplicates. STAT5A binding and H3K27ac marks were reduced at E1 in mammary tissue from ΔE1b mutants. STAT5A and GR binding, H3K27ac marks and DHS were absent at the three individual enhancers (E1, E2 and E3) in mammary tissue from ΔE1c mutants.

Comment in

References

    1. Hennighausen L, Robinson GW. Information networks in the mammary gland. Nat Rev Mol Cell Biol. 2005;6:715–25. - PubMed
    1. Lydon JP, et al. Mice lacking progesterone receptor exhibit pleiotropic reproductive abnormalities. Genes Dev. 1995;9:2266–78. - PubMed
    1. Ormandy CJ, et al. Null mutation of the prolactin receptor gene produces multiple reproductive defects in the mouse. Genes Dev. 1997;11:167–78. - PubMed
    1. Horseman ND, et al. Defective mammopoiesis, but normal hematopoiesis, in mice with a targeted disruption of the prolactin gene. EMBO J. 1997;16:6926–35. - PMC - PubMed
    1. Waller A, Adunski A, Hershkowitz M. Terminal dehydration and intravenous fluids. Lancet. 1991;337:745. - PubMed

Publication types