. 2016 Aug;17(8):976-84.
doi: 10.1038/ni.3494. Epub 2016 Jul 4.

Activin A programs the differentiation of human TFH cells

Affiliations

Activin A programs the differentiation of human TFH cells

Michela Locci et al. Nat Immunol. 2016 Aug.

Erratum in

Abstract

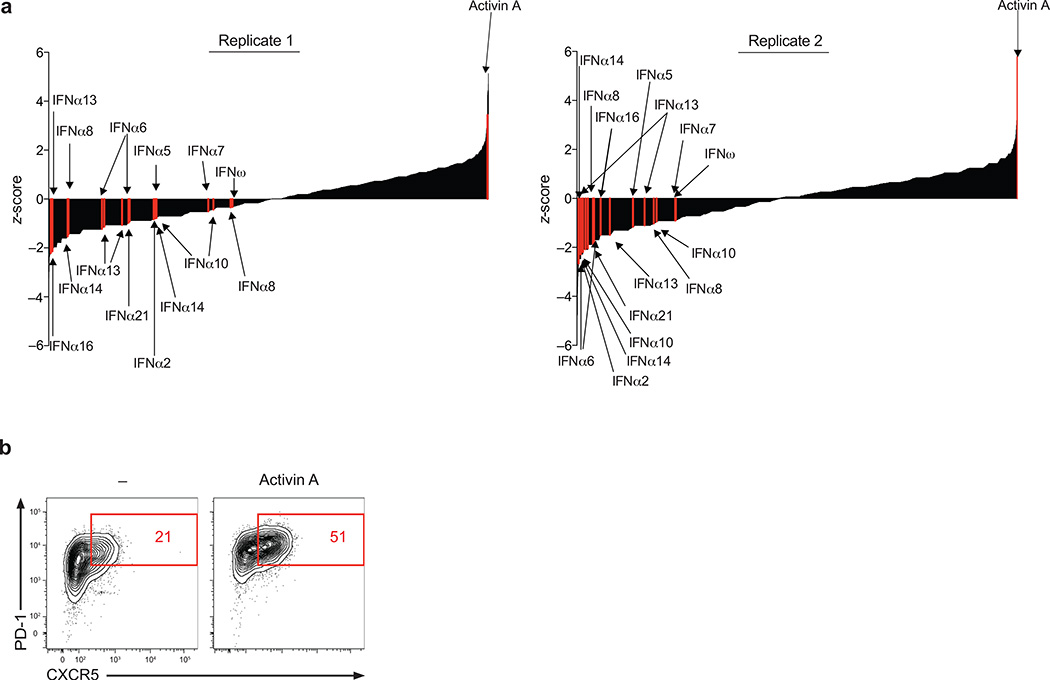
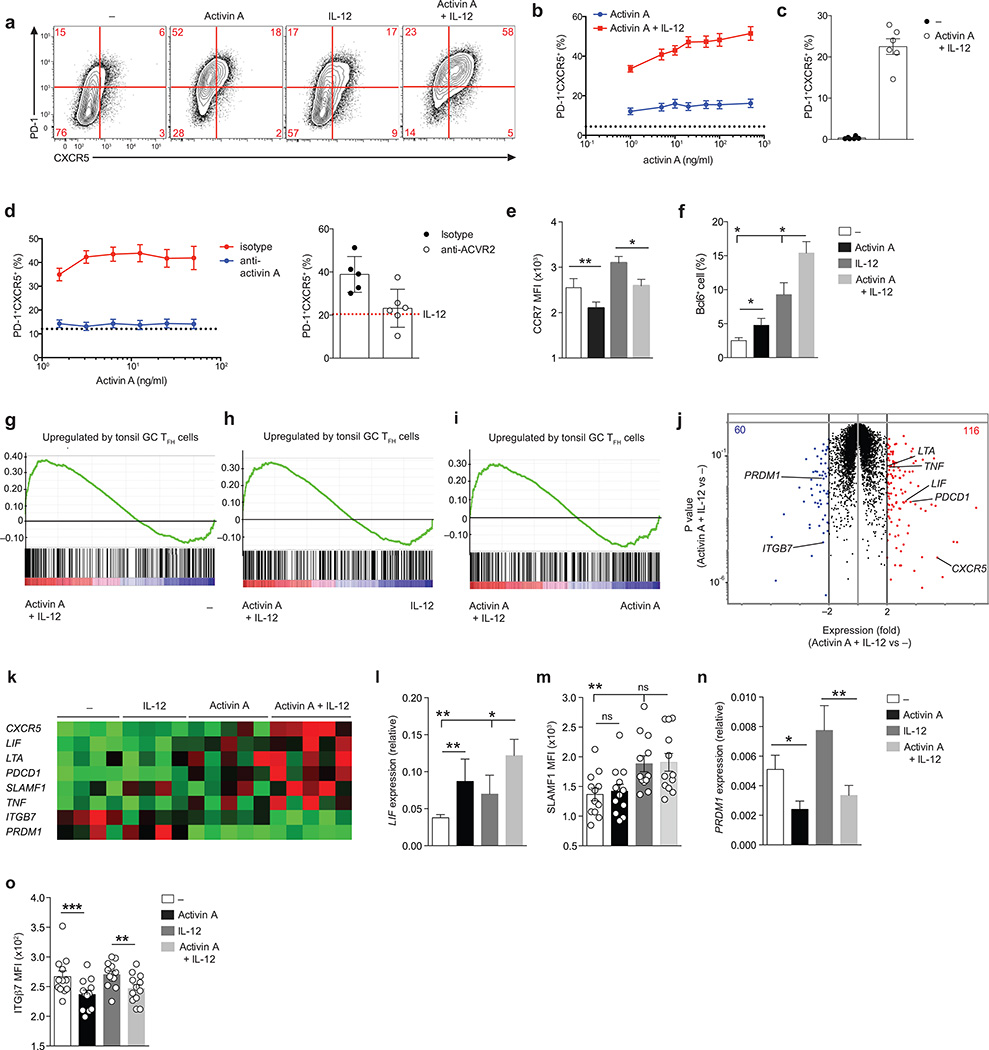
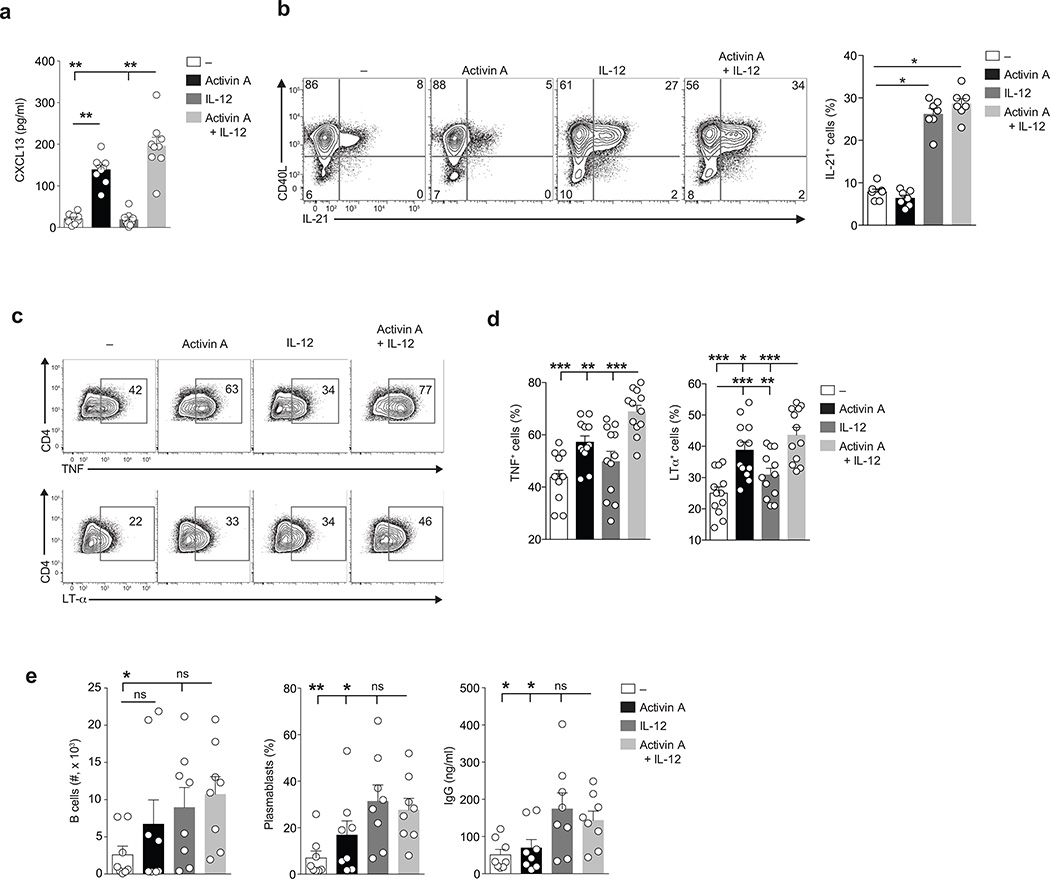
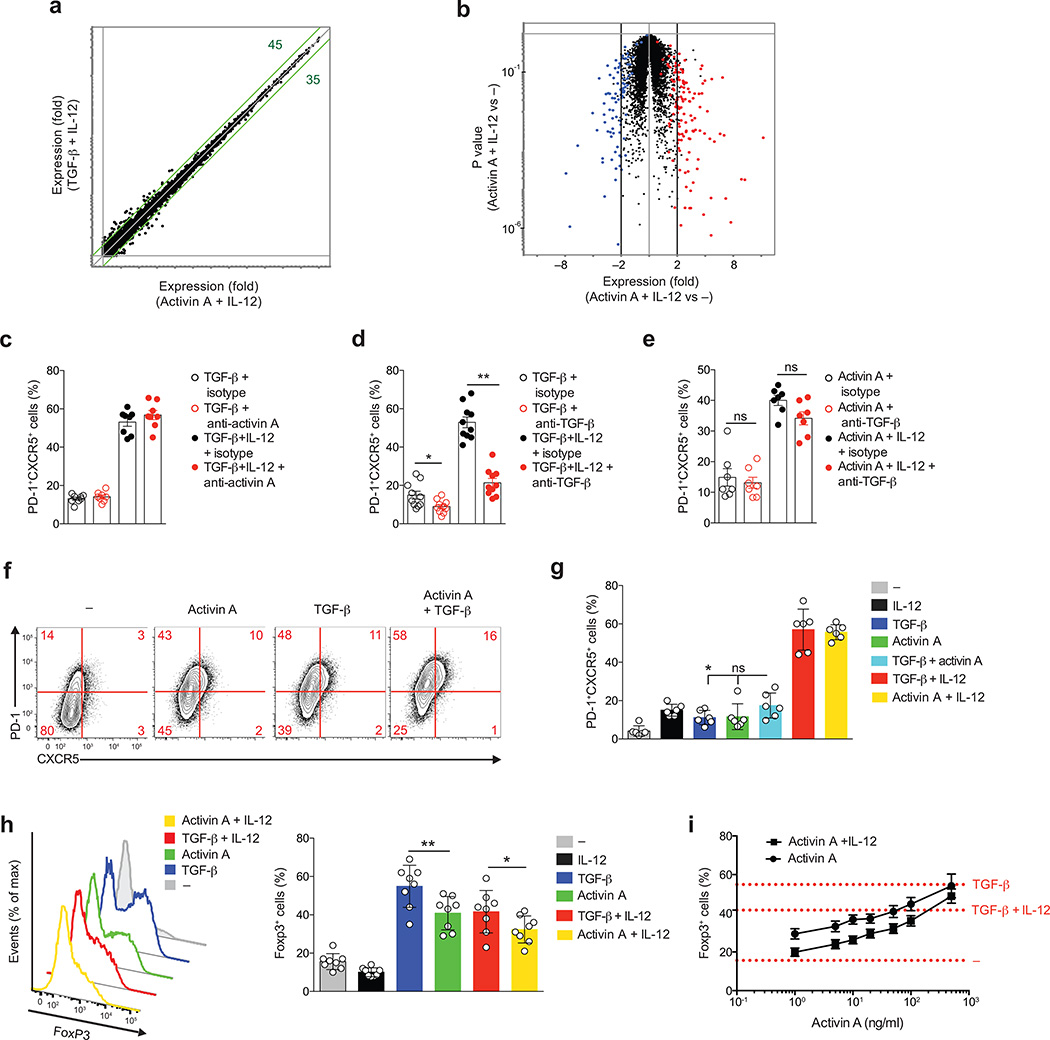
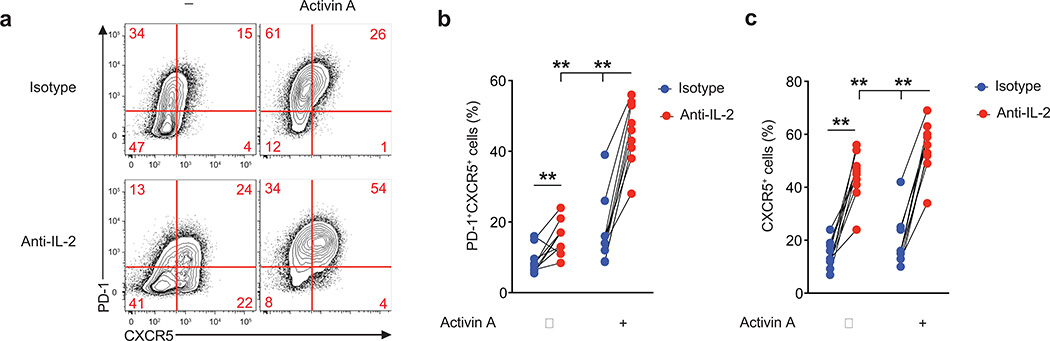
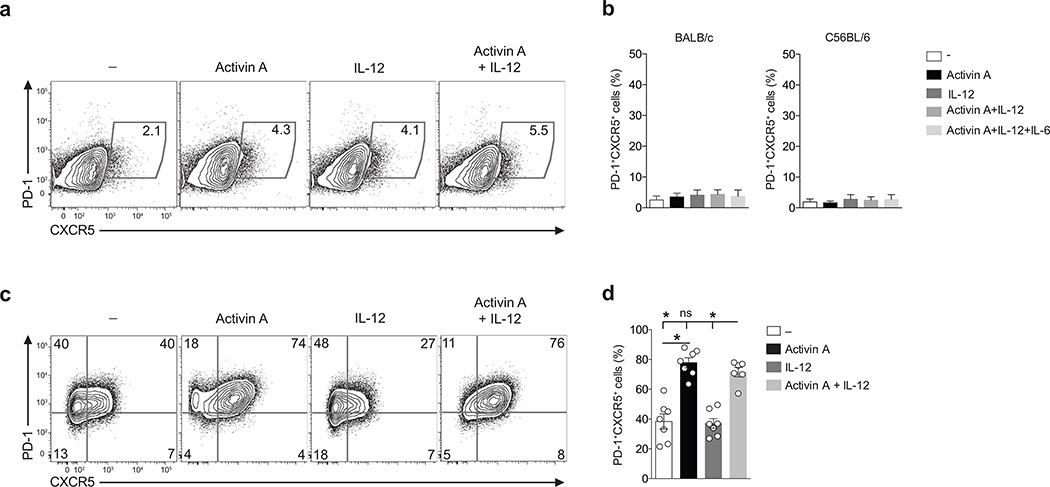
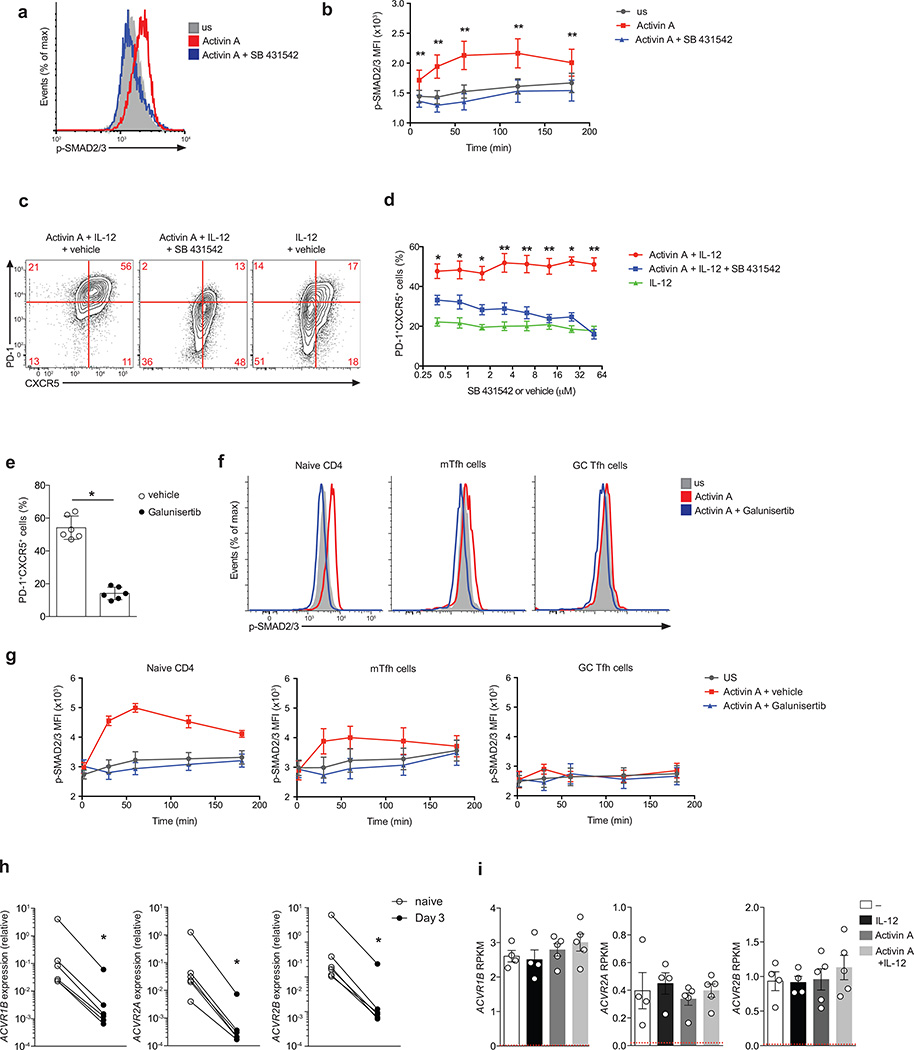
Follicular helper T cells (TFH cells) are CD4(+) T cells specialized in helping B cells and are associated both with protective antibody responses and autoimmune diseases. The promise of targeting TFH cells therapeutically has been limited by fragmentary understanding of extrinsic signals that regulate the differentiation of human TFH cells. A screen of a human protein library identified activin A as a potent regulator of TFH cell differentiation. Activin A orchestrated the expression of multiple genes associated with the TFH program, independently or in concert with additional signals. TFH cell programming by activin A was antagonized by the cytokine IL-2. Activin A's ability to drive TFH cell differentiation in vitro was conserved in non-human primates but not in mice. Finally, activin-A-induced TFH programming was dependent on signaling via SMAD2 and SMAD3 and was blocked by pharmacological inhibitors.


Figures

Figure 1
Figure 1. High throughput screening identifies activin A as a potent regulator of human TFH cell differentiation
(a) Primary screen results. Enrichment of PD-1+CXCR5+ cell induction is reported as z-score for each recombinant protein from 8 × 384 well plates. Activin A and 11 type I interferon family proteins are shown in red. (b) Expression of CXCR5 and PD-1 from a screen repeat experiment re-testing activin A from secretomics library for its capacity to induce TFH-like differentiation. The data are representative of 2 independent replicates.
Figure 2
Figure 2. INHBA is present in sites relevant for TFH cell differentiation and can be produced by myeloid cells
(a) Confocal microscopy of INHBA expression in human tonsils stained with anti-INHBA (red) anti-Bcl6 (blue) and anti-CD3 (green). An overlay from one donor representative of six is shown on the left panel. Enlarged images on the right show representative INHBA expression in (I) a germinal center, (II) the T cell-B cell border and (III) T cell areas. Scale bar=100µm.(b) Confocal microscopy of INHBA expression in tonsil CD11c+ DCs. Tonsil sections were stained with anti-INHBA (red) anti-CD11c (green), anti-CD3 (blue) and counterstained with Hoechst. An overlay from one donor representative of two is shown on the left panel. The images were enlarged from a larger section depicted in Supplementary Fig 2b. Scale bar=10µm.(c) INHBA expression relative to GAPDH in purified monocytes cultured with and without E.Coli LPS (100ng/ml) for 4 h. The relative expression is shown as 2^-ΔCt. (d) Quantification of activin A secretion from purified monocytes cultured with and without E. coli LPS (100ng/ml) for 48h. Data (c,d) are combined from 2 independent experiments (n=6). Each symbol indicates an individual sample. * P < 0.05 (two-tailed Wilcoxon matched-pairs signed ranked test). (c,d; error bars represent mean and s.e.m.)
Figure 3
Figure 3. Activin A synergizes with IL-12 and molds the human TFH gene program
(a) Flow cytometry of naïve CD4+ T cells stimulated by anti-CD3/CD28 beads for 5 d, in the presence of commercial human recombinant activin A, with or without IL-12. Cells stimulated with beads only (−) were used as control. Numbers in quadrants indicate percentage of cells in the outlined areas. (b) Frequency of PD-1+CXCR5+ cells as in (a). The dotted line shows the average basal induction of PD-1+CXCR5+ cells induced by beads only (−) from 13 donors. (c) Frequency of PD-1+CXCR5+ cells following 10 d of in vitro differentiation as in (a). (d) Left: frequency of PD-1+CXCR5+ cells from bead-activated naïve CD4+ T cells cultured in vitro with different doses of activin A combined with a fixed amount of IL-12 for 5 d in the presence of anti-activin A (block) or isotype control antibody (isotype). Dotted lines indicate the average percentages of PD-1+CXCR5+ cells induced by IL-12 with isotype control antibody. Right: frequency of PD-1+CXCR5+ cells from bead-activated naïve CD4+ T cells differentiated with activin A and IL-12, or IL-12 only (red dotted line, average value), in the presence of pan anti-ACVR2 or isotype control antibody. (e) Mean fluorescence intensity (MFI) of CCR7 on cells cultured as in (a). (f) Frequency of Bcl6 intranuclear expression on cells differentiated as in (a). (g-i) Enrichment of tonsil GC TFH signature genes in genes upregulated by activin A + IL-12 cultured cells in comparison to beads only (−) (g), IL-12 (h) or activin A only (i) stimulated cells. (j) RNAseq gene expression of cells differentiated as in (a) for 3d. Red: activin A + IL-12 versus – fold change (FC) > 2; blue: activin A + IL-12 versus – FC < −2). (k) RNAseq gene expression of selected TFH signature genes from (j). (l) LIF expression relative to ACTB in cells cultured as in (j)(m) MFI of SLAMF1 expression on cells cultured as in (j)(n) PRDM1 expression relative to ACTB in cells cultured as in (j) (o) MFI of ITGβ7 expression on cells cultured as in (j).Data in (b-f) and (l-o) data are from 2 or more independent experiments (n=6 or higher). * P < 0.05, ** P < 0.01 and *** P < 0.001 (two-tailed Wilcoxon matched-pairs signed ranked test). In (c), (e, f) and (l-o) bars show mean and s.e.m..
Figure 4
Figure 4. CD4+ T cells differentiated with activin A acquire functional signature molecules of TFH cells
(a) Production of CXCL13 by naïve CD4+ T cells stimulated by plate bound anti-CD3 and hrICOS-L chimera, in the presence of human recombinant activin A, with or without IL-12 for 5 d. (b) Flow cytometry of CD40L and IL-21 intracellular expression on naive CD4+ T cells stimulated stimulated by anti-CD3/CD28 beads for 5 d, in the presence of activin A, with or without IL-12 and re-stimulated on day 5 with PMA/Ionomycin. Numbers in quadrants indicate percentage of cells in the outlined areas. (c) Flow cytometry of TNFα and LTα intracellular expression on cells differentiated as in (b) for 3 d and stimulated on day 3 with PMA/Ionomycin. Numbers in quadrants indicate percentage of cells in the outlined areas. (d) Frequency of cells in (c). (e) Absolute numbers of live CD19+ B cells (left plot), frequency of plasmablasts (CD19+CD20loCD38+ cells, center plot), and secreted IgG generated from coculture of memory B cells with autologous naïve CD4+ T cells differentiated as in (b) for 3d in the presence of SEB. In all (a-e) data are from 3 or more independent experiments (n=7 or more), and bars are mean and s.e.m.. * P < 0.05, ** P < 0.01 and *** P < 0.001. (a-d: two-tailed Wilcoxon matched-pairs signed ranked test; e: one-tailed Wilcoxon matched-pairs signed ranked test).
Figure 5
Figure 5. Activin A and TGF-β act independently from each other to drive in vitro TFH cell differentiation
(a) RNA-seq gene expression on naive CD4+ T cells stimulated by anti-CD3/CD28 beads for 3 d, in the presence of activin A + IL-12 or TGF-β + IL-12.(b) RNA-seq gene expression on cells from (a). Red: TGF-β + IL-12 versus –, fold change (FC) > 2), blue: TGF-β + IL-12 versus –, FC < −2. (c) Frequency of PD-1+CXCR5+ naïve CD4+ T cells stimulated by anti-CD3/CD28 beads for 5 d with TGF-β, alone or with IL-12, in the presence of anti-activin A or isotype control antibody. (d-e) Frequency of PD-1+CXCR5+ naïve CD4+ T cells stimulated by anti-CD3/CD28 beads for 5 d with TGF-β and TGF-β + IL-12 (d) or activin A and activin A+IL-12 (e), in the presence of anti- TGFβ or isotype control antibody. (f) Flow cytometry of naïve CD4+ T cells stimulated by anti-CD3/CD28 beads for 5 d, in the presence of activin A, with or without TGF-β. Cells stimulated with beads only (−) were used as control. Numbers in quadrants indicate percentage of cells in the outlined areas. (g) Quantification of (f). (h-i) Expression of FoxP3 on naïve CD4+ T cells differentiated in vitro for 5d with different cytokine combinations. In (c-i) data are cumulative from 3 or more experiments (n=6 or more). * P < 0.05, ** P < 0.01 and *** P <0.001 (Two-tailed Wilcoxon matched-pairs signed ranked test).
Figure 6
Figure 6. IL-2 antagonizes activin A driven TFH cell differentiation
(a-c) Flow cytometry of naïve CD4+ T cells stimulated by anti-CD3/CD28 beads for 5d with activin A, or beads only (−), in the presence of anti-IL-2, or isotype control antibody. Numbers in quadrants indicate percentage of cells in the outlined areas. Data are cumulative from 3 independent experiments (n=10). ** p<0.01 (Two-tailed Wilcoxon matched-pairs signed ranked test).
Figure 7
Figure 7. The role of activin A in TFH cell differentiation is conserved for non-human primate, but not mouse CD4+ T cells
(a) Flow cytometry of naïve CD4+ T cells from BALB/c or C57BL/6 mice cultured in vitro for 5 d with IL-12, activin A, activin A and IL12 or medium only (−), in the presence of plate-bound anti-CD3 and anti-CD28. Numbers in gates indicate percentages of PD-1+ CXCR5+ cells.(b) Frequency of cells in (a). (c) Flow cytometry of naïve CD4+ T cells from rhesus macaque activated by plate bound anti-CD3 and anti-CD28 in the presence of activin A, with or without IL-12, or medium only (−) for 5d. Numbers in quadrants indicate percentage of cells in the outlined areas.(d) Frequency of cells in (c). In (a-d) data are from 4 or more independent experiments (n=4 or more). Bars are mean and s.e.m. * p<0.05 (Two-tailed Wilcoxon matched-pairs signed ranked test).
Figure 8
Figure 8. Activin A activity is mediated by an ALK4-SMAD2/3 pathway
(a-b) Flow cytometry of phosphorylated-SMAD2/3 (p-SMAD) by human naïve CD4+ T cells following stimulation for 60 min (a) or up to 180 min (b) with activin A (red), activin A + SB 431542 (blue) and in unstimulated cells (US, grey). (c) Flow cytometry of human naïve CD4+ T cells differentiated for 5 d with activin A + IL-12 or IL-12 only in the presence of SB 431542 (50µM) or vehicle (DMSO). Numbers in quadrants indicate percentage of cells in the outlined areas.(d) Frequency of PD-1+CXCR5+ on cells differentiated as in (c) in the presence of different doses of SB 431542 (50µM) or vehicle (DMSO). (e) Frequency of PD-1+CXCR5+ on cells naïve CD4+ T cells differentiated for 5 d with activin A + IL-12 in the presence of Galunisertib or vehicle (DMSO). (f-g) Flow cytometry of phosphorylated-SMAD2/3 (p-SMAD) by tonsillar naïve CD4+ T cells (CD4+CD45RO), mTFH (CD4+CD45RO+PD-1intCXCR5int) and GC TFH cells (CD4+CD45RO+PD-1hiCXCR5hi) following stimulation for 60 min (f) or up to 180 min (g) with activin A (red), activin A + Galunisertib (blue) and in unstimulated cells (US, grey). (h) Type I (ACVR1B) and Type II (ACVR2A and ACVR2B) activin A receptor expression relative to GAPDH on naïve CD4+ T cells ex vivo (naïve), or upon 3 d following in vitro anti-CD/CD28 bead stimulation. (i) RNA-seq gene expression of ACVR1B, ACVR2A and ACVR2B on naïve CD4+ T cells stimulated with antiCD3/CD28 beads for 3 d with activin A, with or without IL-12, IL-12 and beads only (−). NGFR average expression by cells differentiated with beads only (−) is shown in red. Bars are mean and s.e.m.. In (c-h) data are cumulative from 2 or more experiments (n=6 or more). * P < 0.05, ** P < 0.01 and *** P <0.001 (Two-tailed Wilcoxon matched-pairs signed ranked test).

References

    1. Crotty S. T Follicular Helper Cell Differentiation, Function, and Roles in Disease. Immunity. 2014;41:529–542. - PMC - PubMed
    1. Victora GD, Nussenzweig MC. Germinal centers. Annu Rev Immunol. 2012;30:429–457. - PubMed
    1. Craft JE. Follicular helper T cells in immunity and systemic autoimmunity. Nat Rev Rheumatol. 2012:1–11. - PMC - PubMed
    1. Crotty S. A brief history of T cell help to B cells. Nat. Rev. Immunol. 2015;15:185–189. - PMC - PubMed
    1. Gitlin AD, Shulman Z, Nussenzweig MC. Clonal selection in the germinal centre by regulated proliferation and hypermutation. Nature. 2014;509:637–640. - PMC - PubMed

Publication types