. 2016 Jul 14;535(7611):285-8.
doi: 10.1038/nature18617. Epub 2016 Jul 4.

Dissociated functional significance of decision-related activity in the primate dorsal stream

Affiliations

Dissociated functional significance of decision-related activity in the primate dorsal stream

Leor N Katz et al. Nature. .

Abstract

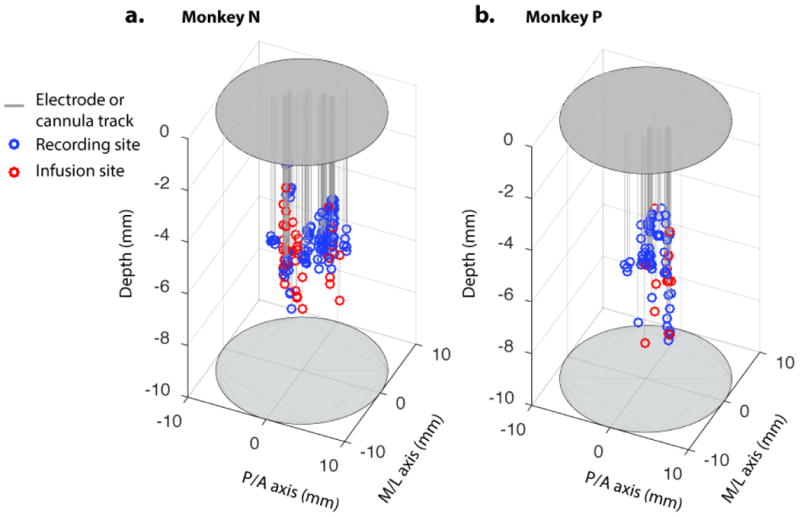
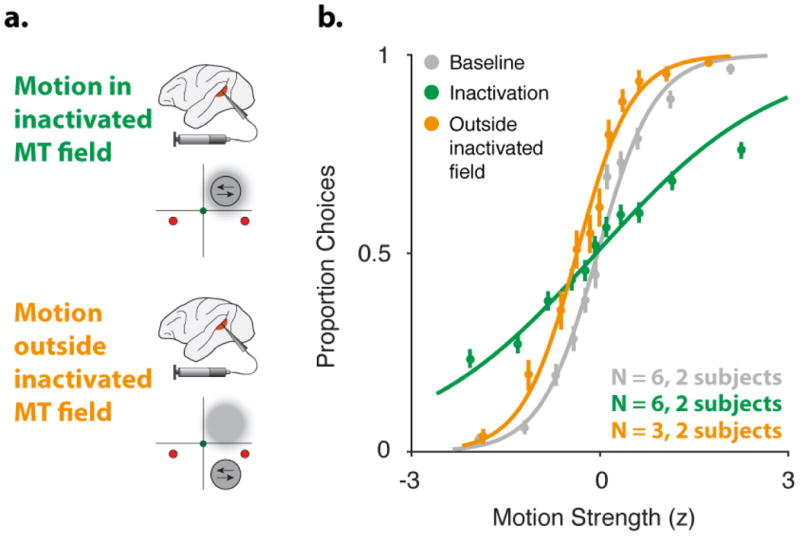
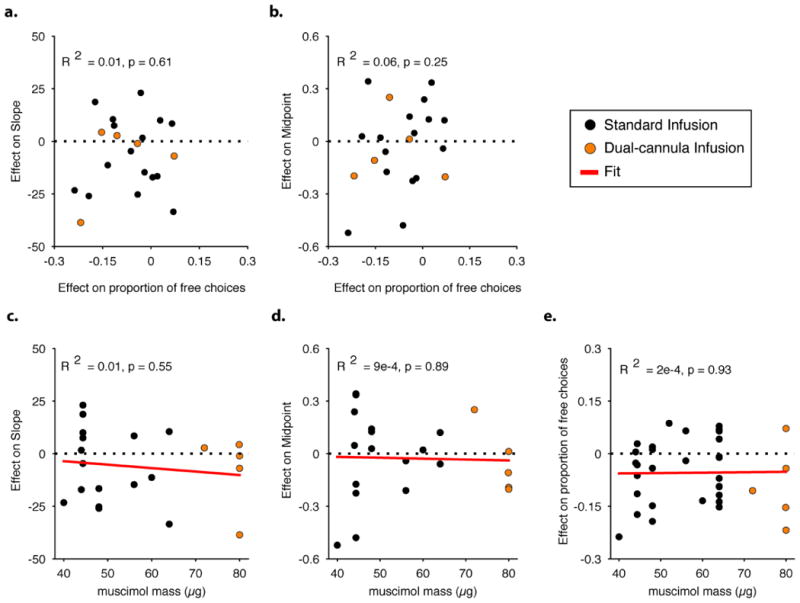
During decision making, neurons in multiple brain regions exhibit responses that are correlated with decisions. However, it remains uncertain whether or not various forms of decision-related activity are causally related to decision making. Here we address this question by recording and reversibly inactivating the lateral intraparietal (LIP) and middle temporal (MT) areas of rhesus macaques performing a motion direction discrimination task. Neurons in area LIP exhibited firing rate patterns that directly resembled the evidence accumulation process posited to govern decision making, with strong correlations between their response fluctuations and the animal's choices. Neurons in area MT, in contrast, exhibited weak correlations between their response fluctuations and choices, and had firing rate patterns consistent with their sensory role in motion encoding. The behavioural impact of pharmacological inactivation of each area was inversely related to their degree of decision-related activity: while inactivation of neurons in MT profoundly impaired psychophysical performance, inactivation in LIP had no measurable impact on decision-making performance, despite having silenced the very clusters that exhibited strong decision-related activity. Although LIP inactivation did not impair psychophysical behaviour, it did influence spatial selection and oculomotor metrics in a free-choice control task. The absence of an effect on perceptual decision making was stable over trials and sessions and was robust to changes in stimulus type and task geometry, arguing against several forms of compensation. Thus, decision-related signals in LIP do not appear to be critical for computing perceptual decisions, and may instead reflect secondary processes. Our findings highlight a dissociation between decision correlation and causation, showing that strong neuron-decision correlations do not necessarily offer direct access to the neural computations underlying decisions.


Figures

Extended Data figure 1
Location of LIP recording and muscimol infusion sites The recording (blue circles) and infusion sites (red) for monkey N (panel a) and monkey P (b) along the medial-lateral (M/L) and posterior-anterior (P/A) axes within the chamber (demarcated by the ovals). Electrode and cannula tracks are represented by the gray lines (with a small jitter on the x-y plane for better visualization). The mean infusion depths were 7.12 ± 1.15 (monkey N) and 7.03 ± 1.39 (monkey P) (microdrive was zeroed below dura mater and just above the cortical surface). Given the estimated spread of muscimol described in the main text, the inactivations targeted a substantial territory of the ventral portion of LIP . Even though a functional distinction with depth has been proposed , we emphasize that the critical component of our protocol was targeting the precise locations at which we measured canonical decision-related activity in LIP.
Extended Data figure 2
Direction discrimination sensitivity is restored when motion is placed outside of the inactivated MT field a. Illustration of MT inactivation along with the estimated inactivated field (gray cloud), for two experimental geometries: motion stimulus placed inside the inactivated MT field (top) and motion placed outside the inactivated MT field (bottom). b. Average psychophysical data for baseline and muscimol treatment pairs (gray and green, respectively, same data as Fig. 2c, n=6; monkey N, 3; monkey P, 3) and psychophysical data collected during muscimol treatment, with the motion stimulus outside of the inactivated MT field (orange, n=3). Direction discrimination sensitivity is restored to baseline levels in these sessions. Error bars on points show ±1 SEM across all sessions.
Extended Data figure 3
No relationship between effect magnitude in control task, effect magnitude in direction discrimination task, and muscimol mass a, b, The relationship between the effect of LIP inactivation in the free-choice task (i.e. shift in proportion of contralateral choices from baseline to muscimol treatment) and the effect of LIP inactivation in the direction discrimination task on sensitivity (i.e. %change in psychometric function slope, panel a) and bias (i.e. shift in normalized motion strength, panel b). R and associated p values of a Pearson correlation are indicated on individual plots (n=21; monkey N, 12; monkey P, 9). Orange data points indicate sessions in which muscimol was infused from two cannulae simultaneously into LIP. c, d, e, Dose-response functions between muscimol mass and the effect in the direction discrimination task on slope (c, same units as panel a), bias (d, same units as panel b), and the effect in the free-choice task (e, same units as a, b). For panel e we used free-choice sessions that took place on the same days as the direction discrimination task (n=21) along with an additional 13 session that took place during other inactivation experiments under similar conditions (n=34 in total; monkey N, 14; monkey P, 20; as in Fig. 3d). R, associated p values and regression lines are indicated on the plots (linear regression).
Extended Data Figure 4
Extended Data Figure 4. Time course of accuracy and bias within sessions
Accuracy and bias in the direction discrimination task were computed over time by taking a running mean of correct and contralateral choices, respectively (sliding window of 40 trials). a, Inactivation in area MT (n=6, green curve; monkey N, 3; monkey P, 3) had a clear and consistent impact on behavioural accuracy compared to baseline (n=6, gray), but did not have systematic effects on bias (bottom), consistent with our results from the fitted psychometric functions (main text). Panels show data from trial 40 (sliding window size) to the median trial length of each group of experiments (variable session lengths contribute to increased variability at later trials). Error bars show ±1 SEM over experiments. b, Inactivations in area LIP (n=21, blue curve; monkey N, 12; monkey P, 9) yielded no systematic trends in either accuracy (top) or bias (bottom) compared to baseline (n=21, gray), indicating that within-session compensation is unlikely. Panel format same as in a. We also investigated whether compensation may have taken place before we began collecting the “inactivation” dataset, or perhaps during the first 10-30 low difficulty “warm-up” trials. On 13 of the 21 LIP inactivation sessions we collected a 3rd dataset (in addition to the standard paired baseline and inactivation datasets), in which psychophysical performance was monitored during the time muscimol was being infused (“during infusion”, orange curve). No systematic changes in accuracy or bias were observed in this exploratory dataset either, further arguing against compensation on the time scales of our manipulations and measurements.
Extended Data Figure 5
Extended Data Figure 5. Psychophysical performance in the direction discrimination task across sessions
Panels show data from monkey P (left) and monkey N (right), for all baseline and treatment pairs: muscimol (blue, n=21), saline (unfilled gray, n=6) and sham (filled gray, n=3). Each pair consists of two sessions that took place in close succession (typically on consecutive days), at a similar time of day, after a similar number of preceding tasks and trials, and is represented by two markers connected by a line. (Additional control pairs with no saline/sham manipulation (n=16) are not presented, for visual clarity). a, Psychometric function slope over sessions. No significant change in slope was present over time, evaluated by linear regression, for either monkey P (p = 0.22) or N (p = 0.63). When considering the difference in slope between baseline and treatment pairs, monkey P exhibited a small decrease (regression line slope = -0.07, p = 0.023), indicating that inactivations may have affected monkey sensitivity gradually over time. However, a similar effect was seen in the interleaved controls (saline and sham, gray markers), indicating that this effect likely reflects nonspecific trends in performance across back-to-back pairs of experiments. Monkey N had no significant change (p = 0.92). b, Psychometric function midpoint over sessions. No significant change was observed in the session-to-session midpoint values, evaluated by linear regression, for either monkey P (p = 0.44) or monkey N (p = 0.24). When considering the difference in midpoint value for each dataset pair over time (i.e. muscimol treatment – baseline), no significant change was detected either (p = 0.98 and p = 0.4 for monkey P and N, respectively). X-axis dates are in yyyymmdd format.
Extended Data Figure 6
Extended Data Figure 6. Psychophysical performance for all individual baseline and treatment session pairs
All pairs of baseline and treatment sessions for all treatment types: muscimol, saline, and sham, (control pairs with no saline/sham manipulation are similar but not presented, for visual clarity) for all variants of the direction discrimination task: standard geometry (panel a), both targets in inactivated field (b), and Newsome dots (c), for both LIP and MT inactivation. In all panels, the abscissa represents motion strength towards the direction contralateral to the LIP under study, the ordinate represents the proportion of contralateral choices. The gray curve is baseline, and the coloured curve is treatment. The first panels in each section present mean psychophysical performance for each monkey over sessions. Subsequent panels present individual session pairs.
Figure 1
Figure 1. Task and neural responses during direction discrimination
a, Monkeys were trained to discriminate the direction of visual motion and communicate their decision with a saccadic eye movement to one of two choice targets. For MT recordings, motion was placed in the MT receptive field (RF) (green patch). For LIP recordings, one of the saccade targets was placed in the LIP RF (blue patch). b, Sequence of task events. Gray arrows indicate temporal jitter. c, Average response of 94 MT neurons as a function of motion strength (grouped by z-scored net motion, see Methods) and direction (in versus opposite of cell's preferred direction, solid and dashed lines, respectively), aligned to motion onset. d, Average response of 113 LIP neurons as a function of motion strength and direction (in and out of cell's RF, solid and dashed lines, respectively), aligned to motion onset. e, Choice probability for 90 MT neurons computed during the motion epoch. Triangle indicates mean, 0.54. f, Choice probability for 96 LIP neurons computed during the motion epoch. Triangle indicates mean, 0.70. Only neurons with >20 repeats of identical stimuli were included in the choice probability analysis.
Figure 2
Figure 2. Psychophysical performance before and after neural inactivations in areas MT and LIP
a, Hypothesized consequences of inactivation on the psychometric function. Left, decreased psychophysical sensitivity would correspond to a decrease in slope. Right, changes in psychophysical bias would correspond to a shifted midpoint. Positive values in the x-axis (z-scored motion strength) refer to motion towards the target contralateral to the LIP under study. Correspondingly, the y-axis refers to the proportion of contralateral target choices. This convention is maintained throughout. b, Schematic of the inactivation protocol. Left, A multi-electrode array was lowered alongside the cannula to identify the targeted cortical location, to verify neural selectivity prior to infusion, and to confirm neural silencing after. Right, continuous voltage traces from an example inactivation session in which neural silencing is evident ∼10 minutes after infusion start. c, d, Psychophysical data for averaged pairs of baseline and muscimol treatment sessions in MT (c), and LIP (d). Insets illustrate the brain region inactivated (top) and the corresponding experimental geometry (bottom), along with the estimated inactivated field (gray cloud). Error bars on points show ±1 SEM across all sessions. e, The distribution of psychometric function parameters, slope (top) and shift (bottom), reflecting sensitivity and bias, respectively, for baseline (x-axis) and treatment (y-axis) session pairs for MT inactivations (green symbols), LIP inactivations (blue symbols), as well as LIP saline (open gray symbols) and sham/control experiments (filled gray symbols), for monkey N (diamonds) and monkey P (squares). Error bars show 95% confidence intervals for individual sessions. f, g, Psychophysical weighting, estimated via reverse correlation. Y-axis indicates how much the subject weighed each of the motion stimulus pulses over all baseline and inactivation session pairs in MT (f) and in LIP (g), for monkey N (top) and monkey P (bottom).
Figure 3
Figure 3. Performance in control tasks following LIP inactivation
a, The “free-choice” task. Following a 200ms long presentation of two targets at random locations in space, monkeys were required to hold fixation for another 600-3,000ms, and then to move their eyes to the remembered location of either target. b, Task timing. Events in the task were presented in sequence and were jittered in time (gray arrows). c, The effect of LIP inactivation on choice bias and saccade accuracy in the free-choice task (example session): saccade landing points (black dots) have been aligned to target position (red dot), for contralateral (left) and ipsilateral target choices (right), during baseline (top) and inactivation (bottom). Both saccadic accuracy and percent contralateral choices (noted in text, top left) are reduced after LIP inactivation, to the contralateral hemifield. d, The effect of LIP inactivation on choice bias and saccade accuracy in the free-choice task, over all sessions. Histograms show baseline/inactivation differences in proportion contralateral choices (top) and saccade error (bottom), where positive numbers indicate an increase in metric following inactivation. Dark bars indicate sessions that took place on the same days as the main direction discrimination experiment (“Main experiment inactivations”, n=21; monkey N, 12; monkey P, 9); dark triangle indicates the median difference. Light bars include an additional 13 sessions that took place during other inactivation experiments under similar conditions (“All inactivations”, n=34; monkey N, 14; monkey P, 20); light triangle indicates median difference (visually occluded by dark triangle). e, Psychophysical data for pairs of baseline and muscimol treatment in LIP when both choice targets were placed within the inactivated field. Inset presents stimulus geometry and estimated inactivated field.

Comment in

Similar articles

Cited by

References

    1. Britten KH, Newsome WT, Shadlen MN, Celebrini S, Movshon JA. A relationship between behavioral choice and the visual responses of neurons in macaque MT. Vis Neurosci. 1996;13:87–100. - PubMed
    1. Shadlen MN, Newsome WT. Neural basis of a perceptual decision in the parietal cortex (area LIP) of the rhesus monkey. Journal of Neurophysiology. 2001;86:1916–1936. - PubMed
    1. Gu Y, DeAngelis GC, Angelaki DE. A functional link between area MSTd and heading perception based on vestibular signals. Nat Neurosci. 2007;10:1038–1047. - PMC - PubMed
    1. Ding L, Gold JI. Perspective. Neuron. 2013;79:640–649. - PMC - PubMed
    1. Liu S, Gu Y, DeAngelis GC, Angelaki DE. Choice-related activity and correlated noise in subcortical vestibular neurons. Nat Neurosci. 2013;16:89–97. - PMC - PubMed

Publication types