. 2016 Aug;22(8):952-60.
doi: 10.1038/nm.4139. Epub 2016 Jul 4.

Inter-individual variability and genetic influences on cytokine responses to bacteria and fungi

Affiliations

Inter-individual variability and genetic influences on cytokine responses to bacteria and fungi

Yang Li et al. Nat Med. 2016 Aug.

Erratum in

Abstract

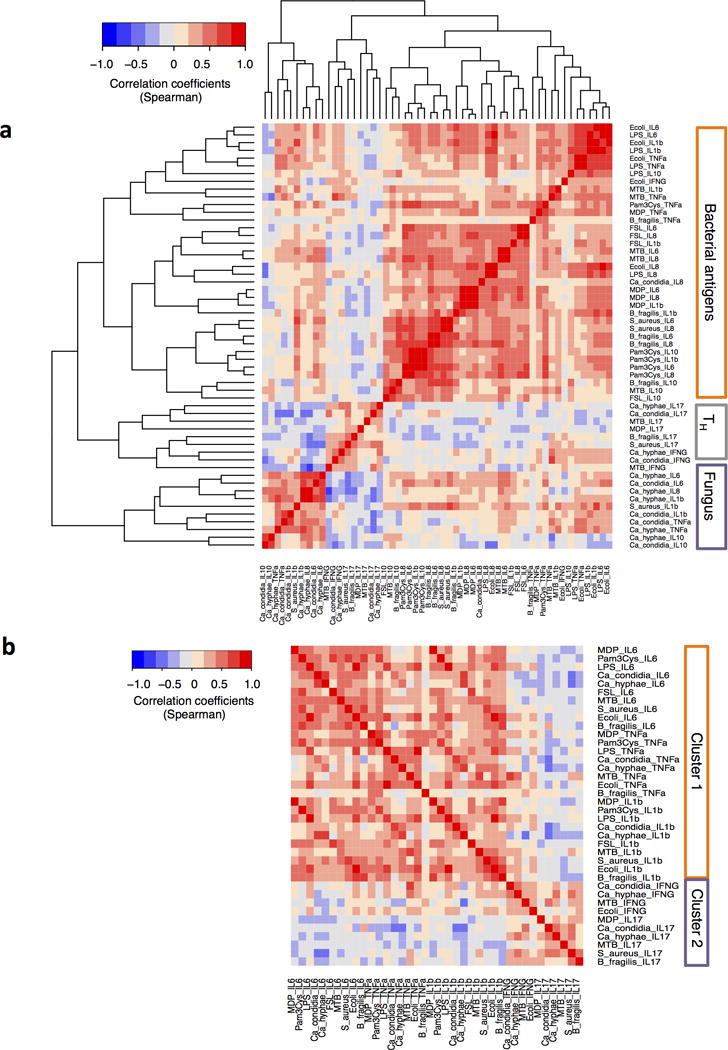
Little is known about the inter-individual variation of cytokine responses to different pathogens in healthy individuals. To systematically describe cytokine responses elicited by distinct pathogens and to determine the effect of genetic variation on cytokine production, we profiled cytokines produced by peripheral blood mononuclear cells from 197 individuals of European origin from the 200 Functional Genomics (200FG) cohort in the Human Functional Genomics Project (http://www.humanfunctionalgenomics.org), obtained over three different years. We compared bacteria- and fungi-induced cytokine profiles and found that most cytokine responses were organized around a physiological response to specific pathogens, rather than around a particular immune pathway or cytokine. We then correlated genome-wide single-nucleotide polymorphism (SNP) genotypes with cytokine abundance and identified six cytokine quantitative trait loci (QTLs). Among them, a cytokine QTL at the NAA35-GOLM1 locus markedly modulated interleukin (IL)-6 production in response to multiple pathogens and was associated with susceptibility to candidemia. Furthermore, the cytokine QTLs that we identified were enriched among SNPs previously associated with infectious diseases and heart diseases. These data reveal and begin to explain the variability in cytokine production by human immune cells in response to pathogens.


Figures

Figure 1
Figure 1. Inter-individual variability in cytokine production upon PBMC stimulation
(a) PBMCs were cultured with the indicated pathogen-related stimuli for 24 hours time period. Cytokine abundance was measured by ELISA. The distributions of raw cytokine levels from the 2009-cohort were tested using the Shapiro-Wilk normality test Blue indicates normal (P > 0.05); yellow indicates non-normal (p<0.05); and grey indicates distributions not tested due to unavailability of the measurements in 2009 dataset. (b) Distribution of Candida albicans-induced IL-1β. (c–d) Distributions of Candida albicans-induced IFN-γ (c) and Candida albicans-induced IL-17 (d). P values shown in the panels (bd) were obtained from the Shapiro-Wilk normality test. (ef) Log-transformed abundance of (e) IL-6 and (f) TNF-α produced upon indicated stimulation. The length of the box in the box-plot is interquartile range (=Q3-Q1). The whiskers indicate the range of one and a half times the length of the box from either end of the box. The equality of variance of cytokine levels before and after stimulation was tested using Levene’s test. The stars on the box plots depict the significance (*, P < 0.01; **, P < 0.001; ***, P < 0.0001; ****, P <0.00001). RPMI, unstimulated state; Bfrag, Bacteroides fragilis; CA, Candida albicans; CAhy, Candida albicans hyphae; Ecoli, Escherichia coli; FSL, lipopeptide; LPS, lipopolysaccharide; MDP, muramyl dipeptide; MTB, Mycobacterium tuberculosis; Pam3Cys, a synthetic triacylated lipopeptide; Saureus, Staphylococcus aureus. The data shown is from one independent experiment from 2009 cohort.
Figure 2
Figure 2. Cytokine responses are organized around a physiological response towards specific pathogens
(a) Unsupervised hierarchical clustering of cytokine responses performed using Spearman correlation as the measure of similarity. Red depicts a strong positive correlation whereas blue indicates a strong negative correlation. TH cluster, cytokines derived from T helper cells; Fungus cluster, Candida albicans induced cytokines. (b) Pair-wise correlation coefficients of production of monocyte-derived cytokines and T lymphocyte-derived cytokines. Cluster 1, monocyte-derived cytokines; Cluster 2, TH1 and TH17-derived cytokines. The data shown is from one independent experiment from 2009 cohort.
Figure 3
Figure 3. Genome-wide cytokine QTL mapping identifies stimulation-induced cQTLs
Manhattan plots showing the genome-wide QTL mapping results for (a) Candida albicans-induced IL-6 levels and (d) Mycobacterium tuberculosis-induced IL-8 levels. Horizontal dashed line corresponds to P < 5 × 10⁻⁸. Boxplots showing the association of genotypes at (b) chromosome 9 SNP rs11141235, (c) chromosome 15 SNP rs77181278 with Candida albicans induced IL-6 levels and (e) chromosome 1 SNP rs75839717, (f) chromosome 7 SNP rs74513903 with Mycobacterium tuberculosis induced IL-8 levels. The number of individuals per genotype is shown in parenthesis below each boxplot. The length of the box in the box-plot is interquartile range (=Q3-Q1). The whiskers indicate the range of one and a half times the length of the box from either end of the box. P values were from the linear regression analysis of cytokine on genotype data. The data shown is from one independent experiment from 2013 cohort.
Figure 4
Figure 4. Genome-wide significant cQTLs affect cytokine production induced by both bacterial and fungal stimulation
(a) The P values of six significant cQTLs for other cytokine levels. The colour legend for the heat map indicates the range of P values from QTL mapping. P values were from the linear regression analysis of cytokine on genotype data. (b,c) Correlation of SNP rs11141235, genotype with IL-6 induced by LPS (b) and by Mycobacterium tuberculosis (c). The length of the box in the box-plot is interquartile range (=Q3-Q1). The whiskers indicate the range of one and a half times the length of the box from either end of the box. The number of individuals per genotype is shown in parenthesis below each boxplots. (d) P values for differential expression of genes (±250 kb around the SNP) selected from genome-wide significant cQTL loci upon different stimulations in human PBMCs (n=8). P values were from differential expression analysis using threshold of FDR=0.05 and fold change > 2. Genes were selected based on their physical positions which are within ±250 kb window around the SNP. PBMC stimulations were done for either 4 h or 24 h. The figure show results from both 4h and 24h. Red: up-regulation; Blue: down-regulation; *, genes with suggestive eQTLs in RNAseq data. e) GOLM1 expression levels upon C. albicans stimulation in PBMCs of 70 samples.
Figure 5
Figure 5
GOLM1 is involved in IL-6 production. Boxplots showing the correlation between gene expression levels of GOLM1 of 69 PBMC samples and SNPs (a) rs11141242 (P value = 0.017) and (b) rs11141235 upon C. albicans stimulation. c) Co-expression network for GOLM1 built using gene expression data using Spearman correlation from 70 PBMC samples stimulated with C. albicans. The red lines depict the correlation coefficient of more than 0.7 between other genes and GOLM1 in the network. (d) Pathway enrichment analysis on genes that are highly correlated with GOLM1 (Spearman correlation coefficient > 0.7) based on Reactome pathway database. (e) Correlation between secreted IL-6 levels and genotypes at rs7036187 of 117 candidemia patients (Student t test P = 0.015). The length of the box in the box-plot is interquartile range (=Q3-Q1). The whiskers indicate the range of one and a half times the length of the box from either end of the box. There are 111 patients with AA genotype and 6 patients with AG genotype.
Figure 6
Figure 6. Association of cQTLs with infectious diseases
(a) The percentage of SNPs associated with each category of disease that also qualify as suggestive cytokine QTLs (P value <0.05). Dotted line indicates the percentage of cQTLs that overlapped with height-associated SNPs, which served as reference set (null set). Enrichment analysis from Fisher exact test are indicated by red “stars” (***, P < 10−8; **, P < 10−4; *, P < 0.05). (b–c) QTLs associated with indicated stimulus-cytokine pairs (rows) compared with SNPs associated with susceptibility to the indicated pathogens (columns) (b) and with IBD (c). The colours represent the –log10P values of cytokine QTLs. P values were obtained from linear regression model of cytokine levels on genotype data. Red and blue indicate association with upregulated or downregulated cytokine levels, respectively.

References

    1. Fumagalli M, et al. Signatures of environmental genetic adaptation pinpoint pathogens as the main selective pressure through human evolution. PLoS genetics. 2011;7:e1002355. - PMC - PubMed
    1. Netea MG, Wijmenga C, O’Neill LA. Genetic variation in Toll-like receptors and disease susceptibility. Nature immunology. 2012;13:535–542. - PubMed
    1. Karlsson EK, Kwiatkowski DP, Sabeti PC. Natural selection and infectious disease in human populations. Nature reviews Genetics. 2014;15:379–393. - PMC - PubMed
    1. Hill AV. Evolution, revolution and heresy in the genetics of infectious disease susceptibility. Philosophical transactions of the Royal Society of London Series B, Biological sciences. 2012;367:840–849. - PMC - PubMed
    1. Jostins L, et al. Host-microbe interactions have shaped the genetic architecture of inflammatory bowel disease. Nature. 2012;491:119–124. - PMC - PubMed

MeSH terms