. 2016 Sep;12(9):672-9.
doi: 10.1038/nchembio.2115. Epub 2016 Jul 4.

Sensitivity and engineered resistance of myeloid leukemia cells to BRD9 inhibition

Affiliations

Sensitivity and engineered resistance of myeloid leukemia cells to BRD9 inhibition

Anja F Hohmann et al. Nat Chem Biol. 2016 Sep.

Abstract

Here we show that acute myeloid leukemia (AML) cells require the BRD9 subunit of the SWI-SNF chromatin-remodeling complex to sustain MYC transcription, rapid cell proliferation and a block in differentiation. Based on these observations, we derived small-molecule inhibitors of the BRD9 bromodomain that selectively suppress the proliferation of mouse and human AML cell lines. To establish these effects as on-target, we engineered a bromodomain-swap allele of BRD9 that retains functionality despite a radically altered bromodomain pocket. Expression of this allele in AML cells confers resistance to the antiproliferative effects of our compound series, thus establishing BRD9 as the relevant cellular target. Furthermore, we used an analogous domain-swap strategy to generate an inhibitor-resistant allele of EZH2. To our knowledge, our study provides the first evidence for a role of BRD9 in cancer and reveals a simple genetic strategy for constructing resistance alleles to demonstrate on-target activity of chemical probes in cells.


Conflict of interest statement

This study was funded in part via a sponsored research agreement with Boerhinger Ingelheim.

Figures

Figure 1
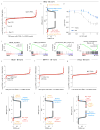
Figure 1. BRD9 is a subunit of SWI/SNF complexes in acute myeloid leukemia cells
(a) iTRAQ IP-MS using BRG1 and IgG antibodies and NOMO-1 cell nuclear extracts to identify BRG1-associated factors. Log-transformed iTRAQ ratios of two independent replicates are plotted for all precipitated proteins previously reported to be part of the SWI/SNF complex,. (b) Density plot of different ChIP-Seq datasets in RN2 cells centered on Brg1 peaks. Brg1 peaks were identified by MACS peak calling and all peaks with a false discovery rate (FDR) <0.05 % and a fold enrichment over input of greater than 5 were included. The plot depicts tag counts in 50 bp bins in the +/−10 kb region surrounding the Brg1 peak center. Each row represents a single peak. (c) ChIP-Seq occupancy profiles for Brg1, Brg9, H3K27Ac and H3K4me3 at the Myc locus and enhancer in RN2 cells. The y-axis reflects the number of cumulative tag counts within a 50–100 bp bin surrounding each region.
Figure 2
Figure 2. Brd9 supports acute myeloid leukemia growth by sustaining Myc expression and an undifferentiated cell state
(a) Competition-based assay to measure effect of shRNAs on growth of RN2 cells. Transduced (shRNA-expressing) cells were identified by co-expression of GFP (LMN vector). The percentage of GFP+ cells was tracked over 12 days and normalized to GFP percentage on day 2. n = 2 (b) cDNA complementation assay to demonstrate on-target effects of shRNAs. BRD9 (linked to GFP, MSCV-based vector) was expressed in RN2 cells prior to expression of shRNAs (linked to mCherry, LMN vector). The percentage of double positive cells was tracked and normalized to day 2 values. n = 4 (c) Heatmap summarizing competition-based assay to measure effect of shRNAs on growth of human cancer cell lines. Experiment performed as in (a), except that a MLS-E vector was used and cells were tracked for 28 days. Plotted is the percentage of GFP+ cells on day 28 normalized to that on day 4. n = 3 (d) RNA-Seq analysis of gene expression changes in RN2 cells expressing Brd9 shRNAs for 2 days (TRMPV-Neo vector). Averaged FPKM values for three independent Brd9 shRNAs were normalized to mRNA levels in control cells expressing shRen. (e) Gene set enrichment analysis (GSEA) of the RNA-Seq data presented in (d). (f) Representative light microscopy images of May-Grünwald/Giemsa-stained RN2 cells expressing shRen or shBrd9 for 4 days (TRMPV-Neo vector) in the absence (top) or presence (bottom) of Myc expression (MSCV-based vector). Scale bar: 20 μm. (g) Myc cDNA complementation assay. Experiment performed as in (b). n = 3 shRen targets Renilla luciferase and serves as a negative control. All error bars in this figure represent SEM.
Figure 3
Figure 3. A chemical series that inhibits the BRD9 bromodomain
(a) Domain structure of wild-type (wt) and mutant BRD9. BD: Bromodomain, DUF: Domain of Unknown Function, aa: amino acids. (b) cDNA complementation assay to test functionality of BRD9 mutants. wt or mutant BRD9 (linked to GFP, MSCV-based vector) was expressed in RN2 cells prior to expression of shRNAs (linked to mCherry, LMN vector). The percentage of double positive cells was tracked and normalized to day 2 values. n = 2 (c) Chemical structures of the BRD9 bromodomain inhibitor series. (d) AlphaScreen assay to determine binding affinities of BI-7273 for the bromodomains of BRD9, BRD7 and BRD4. Curves were fit by four parameter non-linear regression using the least squares fitting method. Representative graph out of 6–9 replicates is shown. (e) BROMOscan profiling of BI-7273 binding across the bromodomain family. The bromodomains assayed by bromoMAX are shown in black (pre-configured panel). The depicted affinities were determined by follow-up bromoKdELECT (assaying only those bromodomains identified as binders by bromoMAX). (f) Co-crystal structure of BI-7273 bound to the BRD9 bromodomain pocket. Key amino acid residues forming the binding pocket are highlighted. The hydrogen bond interaction to Asn216 with 2.95 Å is key for the correct orientation of the ligand. PDB: 5EU1.
Figure 4
Figure 4. A bromodomain-swap allele validates on-target activity of BRD9 inhibitors
(a) Anti-proliferative effect of BRD9 bromodomain inhibitors on the growth of RN2 cells. RN2 cells were cultured in the presence of increasing inhibitor concentrations for 5 days before cell numbers were determined and normalized to DMSO control. Curves were fit by four parameter non-linear regression using the least squares fitting method. EC50 values were derived from non-linear regression curves with the bottom constrained to 0 and the top constrained to 1. n = 3 (b) EC50 measurements for BI-7273 across human cancer cell lines. Cells were cultured in the presence of increasing BI-7273 concentrations for 7 days before cell proliferation was assessed by CellTiter-Glo and normalized to a DMSO control. n = 2 (c) cDNA complementation assay to test functionality of bromodomain-swap alleles. wt or mutant BRD9 (linked to GFP, MSCV-based vector) was expressed in RN2 cells prior to expression of shRNAs (linked to mCherry, LMN vector). The percentage of double positive cells was tracked and normalized to day 2 values. shRen targets Renilla luciferase and serves as a negative control. n = 5 (d) Cell counts to measure the effect of BI-7273 on the growth of RN2 cells transduced with and selected for empty vector, BRD9 or BRD9-BET (MSCV-based vector). Experiment performed as in (a). n = 3 All error bars in this figure represent SEM.
Figure 5
Figure 5. Chemical Brd9 inhibition mimics the transcriptional effects of Brd9 knockdown
(a) RNA-Seq analysis of gene expression changes in RN2 cells after 24 hours of 1.25 μM BI-7273 exposure. FPKM values from treated cells were normalized to FPKM values recorded in cells cultured in presence of DMSO. n = 2 (b) Gene set enrichment analysis (GSEA) of RNA-Seq data presented in (a). (c) GSEA plots of the top 100 genes up- and down-regulated after 2 days of shBrd9 expression in RN2 cells (shBrd9_Top100Up, shBrd9_Top100Down), genes up-regulated in Burkitt’s Lymphoma cells induced to express MYC (Schuhmacher_MYC_Targets_Up) and genes up-regulated in mature blood cell populations from adult bone marrow and fetal liver (Ivanova_Hematopoiesis_Mature_Cell). (d) Cell counts to measure effect of BRD9 bromodomain inhibitors on growth of RN2 cells transduced with and selected for empty vector or Myc (MSCV-based vector). Cells were cultured in the presence of increasing inhibitor concentrations for 5 days before cell numbers were determined and normalized to DMSO control. Curves were fit by four parameter nonlinear regression using the least squares fitting method. n = 3 (e, f, g) RNA-Seq analysis of gene expression changes in HL60 (e), MV4-11 (f) and HeLa (g) cells after 24 hours of 1 μM BI-7273 exposure. FPKM values from treated cells were normalized to FPKM values recorded in cells cultured in the presence of DMSO. n = 2 (h, i, j) Gene set enrichment analysis (GSEA) on the RNA-Seq data presented in (e), (f) and (g), respectively. FWER p-val, familywise-error rate p-value.
Figure 6
Figure 6. A SET domain-swap allele validates on-target activity of the EZH2 inhibitor GSK126
(a) Western blot to test expression of EZH2 wt and EZH2EZH1-SET in RN2 cells. The antibody recognizes human EZH2 exclusively. For this reason no Ezh2 band is observed in the ‘empty’ lane. The actin blot serves to control for loading. Uncropped images can be found in Supplementary Fig. 15b. (b) Cell counts to measure the effect of EZH2 inhibitor GSK126 on the growth of RN2 cells transduced with and selected for empty vector, EZH2 or EZH2EZH1-SET (MSCV-based vector). Cells were cultured in the presence of increasing inhibitor concentrations for 7 days before cell numbers were determined and normalized to DMSO control. Curves were fit by four parameter non-linear regression using the least squares fitting method. EC50 values were derived from non-linear regression curves with the bottom constrained to 0 and the top constrained to 1. n = 5

Comment in

References

    1. Schenone M, Dancik V, Wagner BK, Clemons PA. Target identification and mechanism of action in chemical biology and drug discovery. Nat Chem Biol. 2013;9:232–40. - PMC - PubMed
    1. Blagg J, Workman P. Chemical biology approaches to target validation in cancer. Curr Opin Pharmacol. 2014;17:87–100. - PubMed
    1. Arrowsmith CH, et al. The promise and peril of chemical probes. Nat Chem Biol. 2015;11:536–41. - PMC - PubMed
    1. Titov DV, Liu JO. Identification and validation of protein targets of bioactive small molecules. Bioorg Med Chem. 2012;20:1902–9. - PMC - PubMed
    1. Balzano D, Santaguida S, Musacchio A, Villa F. A general framework for inhibitor resistance in protein kinases. Chem Biol. 2011;18:966–75. - PubMed

Publication types

MeSH terms