. 2016 Aug;13(8):679-84.
doi: 10.1038/nmeth.3899. Epub 2016 Jul 4.

Nanoscale imaging of RNA with expansion microscopy

Affiliations

Nanoscale imaging of RNA with expansion microscopy

Fei Chen et al. Nat Methods. 2016 Aug.

Abstract

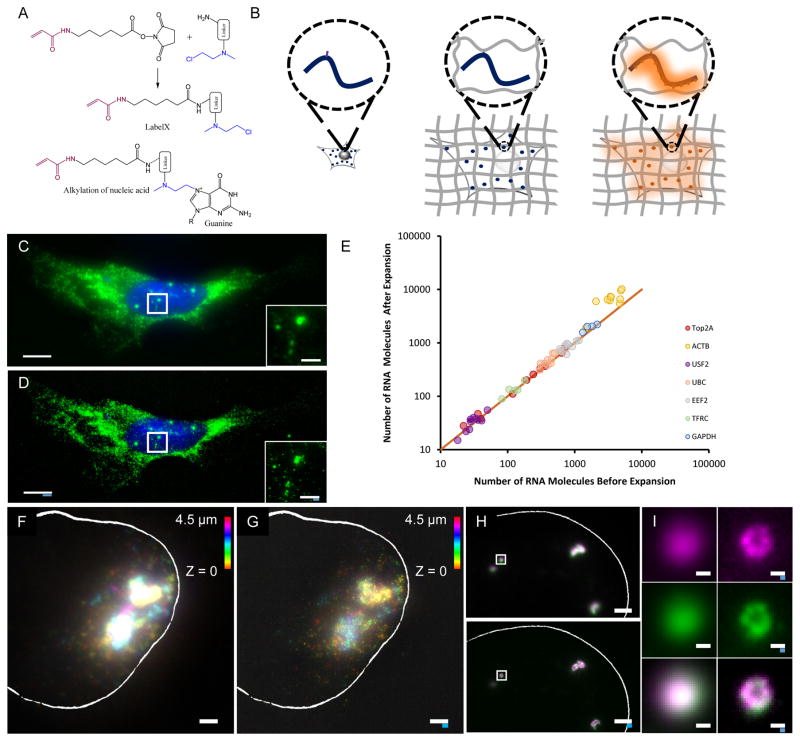
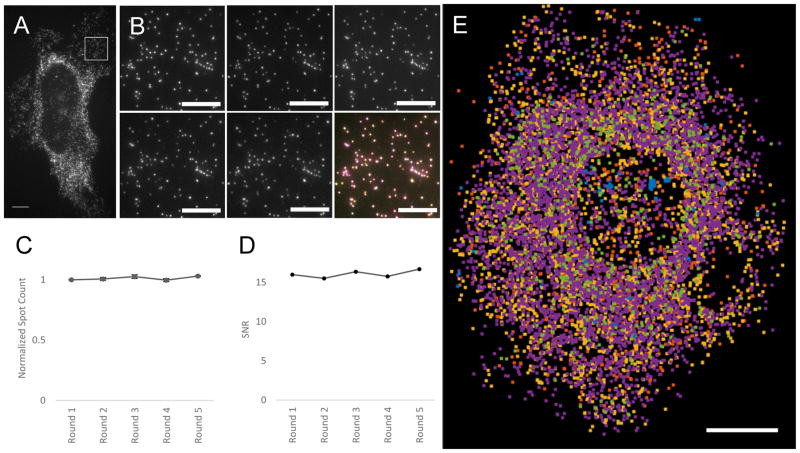
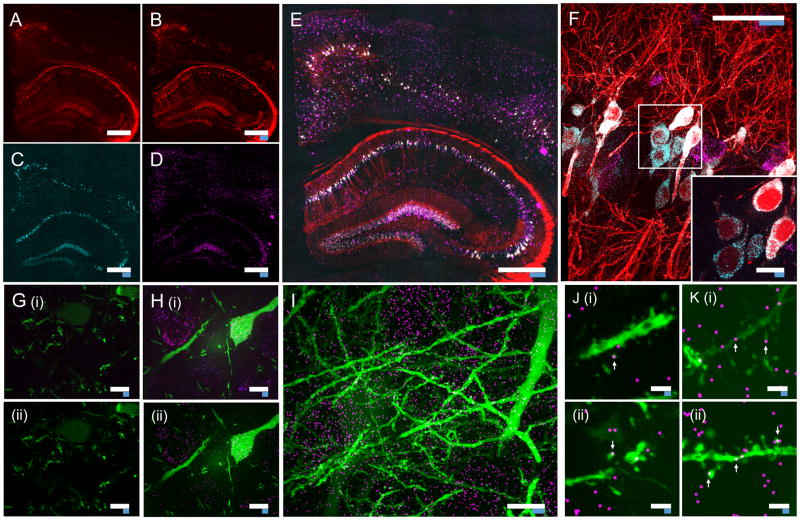
The ability to image RNA identity and location with nanoscale precision in intact tissues is of great interest for defining cell types and states in normal and pathological biological settings. Here, we present a strategy for expansion microscopy of RNA. We developed a small-molecule linker that enables RNA to be covalently attached to a swellable polyelectrolyte gel synthesized throughout a biological specimen. Then, postexpansion, fluorescent in situ hybridization (FISH) imaging of RNA can be performed with high yield and specificity as well as single-molecule precision in both cultured cells and intact brain tissue. Expansion FISH (ExFISH) separates RNAs and supports amplification of single-molecule signals (i.e., via hybridization chain reaction) as well as multiplexed RNA FISH readout. ExFISH thus enables super-resolution imaging of RNA structure and location with diffraction-limited microscopes in thick specimens, such as intact brain tissue and other tissues of importance to biology and medicine.


Conflict of interest statement

Competing Financial Interests

F.C., A.T.W., S. Alon, E.R.D., J.-B. C., A.M., G.M.C., and E.S.B. are inventors on one or more patents or patent applications related to the technologies here discussed. E.S.B. is co-founder of Expansion Technologies, a company whose goal is to facilitate access to expansion microscopy technologies by the scientific community.

Figures

Figure 1
Figure 1
Design and validation of ExFISH chemistry. (a) Acryloyl-X SE (top left) is reacted to Label-IT® amine (top right) via NHS-ester chemistry to form LabelX (middle), which serves to make RNA gel-anchorable by alkylating its bases (e.g., the N7 position of guanines) (bottom). (b) Workflow for ExFISH: biological specimens are treated with LabelX (left), which enables RNA to be anchored to the ExM gel (middle). Anchored RNA can be probed via hybridization (right), after gelation, digestion, and expansion. (c) smFISH image of ACTB before expansion. Inset shows zoomed-in region, highlighting transcription sites in nucleus. (d) As in (c), using ExFISH. (e) smFISH counts before versus after expansion for seven different transcripts (n = 59 cells; each symbol represents one cell). (f) smFISH image of XIST long non-coding RNA (lncRNA) in the nucleus of a HEK293 cell before expansion (white line denotes nuclear envelope in f–h). (g) As in (f), using ExFISH. (h) smFISH image before expansion (top), and using ExFISH (bottom), of NEAT1 lncRNA in the nucleus of a HeLa cell. Magenta and green indicate probesets binding to different parts of the 5′ (1–3756 nts) of NEAT1 (see Methods). (i) Insets showing a NEAT1 cluster (boxed region of (h)) with smFISH (left) and ExFISH (right). Scale bars (white, in pre-expansion units; blue scale bars are divided by the expansion factor noted))): (c, d) 10 μm (expansion factor, 3.3×), inset 2 μm; (f, g) 2 μm (3.3×), Z scale represented by color coding in pre-expansion units; (h) 2 μm (3.3×); (i) 200 nm (3.3×).
Figure 2
Figure 2
Serially hybridized and multiplexed ExFISH. (a) Widefield fluorescence image of ExFISH targeting GAPDH. (b) Boxed region of (a), showing 5 repeated re-stainings following probe removal (see Methods); lower right panel, overlay of the 5 images (with each a different color, red, green, blue, magenta, yellow), showing co-localization. (c) ExFISH RNA counts for each round, normalized to the round 1 count; plotted is mean ± standard error; n = 3 regions of (a). (d) Signal-to-noise ratio (SNR) of ExFISH across the five rounds of staining of (a), computed as the mean puncta brightness divided by the standard deviation of the background. (e) Composite image showing ExFISH with serially delivered probes against six RNA targets in a cultured HeLa cell (raw images in Supplementary Fig. 6); colors are as follows: NEAT1, blue; EEF2, orange; GAPDH, yellow; ACTB, purple; UBC, green; USF2, light blue. Scale bars (expanded coordinates): (a) 20 μm; (b) 10 μm; (e) 20 μm.
Figure 3
Figure 3
Nanoscale imaging of RNA in mammalian brain. (a) Widefield fluorescence image of Thy1-YFP mouse brain. (b) Post-expansion widefield image of (a). (c) Widefield fluorescence showing HCR-ExFISH of YFP mRNA in the sample of (b). (d) As in (c), but for Gad1 mRNA. (e) Composite of (b–d), highlighting distribution of Gad1 versus Thy1-YFP mRNAs. (f) Confocal image of mouse hippocampal tissue from (e) showing single RNA puncta. Inset, one plane of the boxed region (red, YFP protein; cyan, YFP mRNA; magenta, Gad1 mRNA). (g) Confocal image (i) and processed image (ii) of HCR-ExFISH using a missense Dlg4 probe, in Thy1-YFP mouse tissue (green, YFP protein). The raw image (i) uses alternating probes in two colors (red, Dlg4 missense even; blue, Dlg4 missense odd). The processed image (ii) shows zero co-localized spots (magenta). (h) As in (g), but for HCR-ExFISH targeting Actb in Thy1-YFP mouse brain (green, YFP protein; red, Actb even, and blue, Actb odd in (i); co-localized spots in magenta (ii)). (i) Confocal image of hippocampal tissue showing co-localized Dlg4 puncta (magenta) overlaid on YFP (green). (j) Dendrites with Dlg4 mRNA localized to spines (arrows). (i), (ii), two representative examples. (k) As in (j), but with HCR-ExFISH of Camk2a mRNA showing transcripts in dendritic spines and processes. Scale bars (white, in pre-expansion units; blue scale bars are divided by the expansion factor noted): (a) 500 μm; (b–e) 500 μm (expansion factor 2.9×); (f) 50 μm (2.9×), inset 10 μm; (g–i) 10 μm (3×); (j,k) 2 μm (3×). (e,i) maximum-intensity projection (MIP) 27 μm thick (pre-expanded units); (g,h,j,k) MIPs ~1.6 μm thick.

Comment in

References

    1. Chen F, Tillberg PW, Boyden ES. Expansion microscopy. Science (80-) 2015;347:543–548. - PMC - PubMed
    1. Femino AM, Fay F, Fogarty K, Singer R. Visualization of Single RNA Transcripts in Situ. Science (80-) 1998;280:585–590. - PubMed
    1. Levsky JM, Singer RH. Fluorescence in situ hybridization: past, present and future. J Cell Sci. 2003;116:2833–2838. - PubMed
    1. Raj A, van den Bogaard P, Rifkin SA, van Oudenaarden A, Tyagi S. Imaging individual mRNA molecules using multiple singly labeled probes. Nat Methods. 2008;5:877–9. - PMC - PubMed
    1. Choi HMT, et al. Programmable in situ amplification for multiplexed imaging of mRNA expression. Nat Biotechnol. 2010;28:1208–12. - PMC - PubMed

Publication types