. 2017 Apr:177:76-86.
doi: 10.1016/j.clim.2016.06.013. Epub 2016 Jul 1.

Adoptive transfer of natural killer cells promotes the anti-tumor efficacy of T cells

Affiliations

Adoptive transfer of natural killer cells promotes the anti-tumor efficacy of T cells

Stephen R Goding et al. Clin Immunol. 2017 Apr.

Abstract

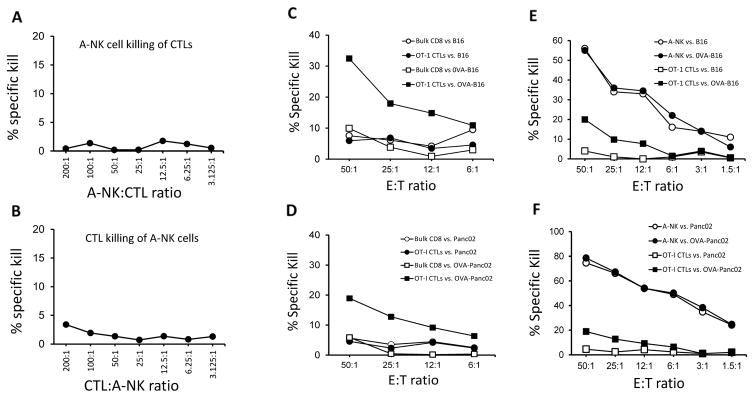
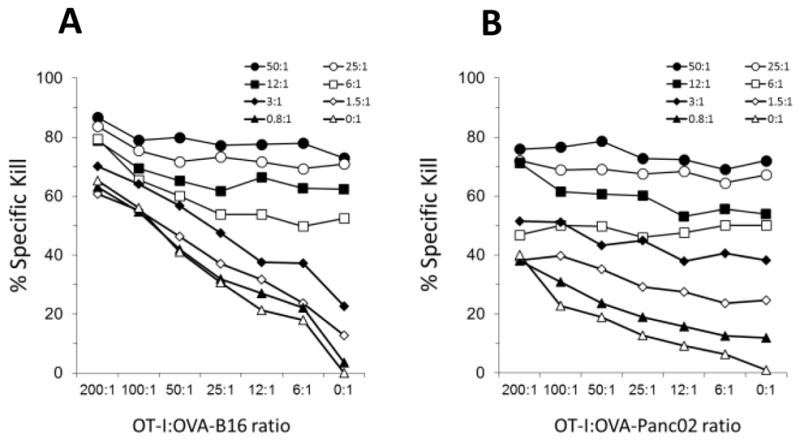
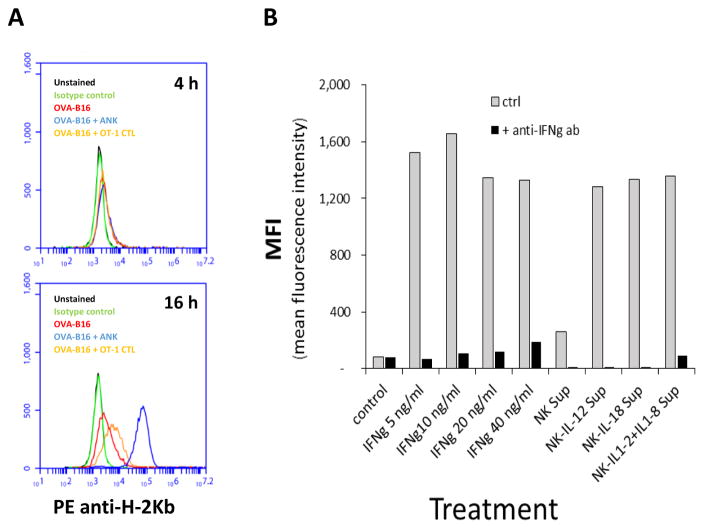
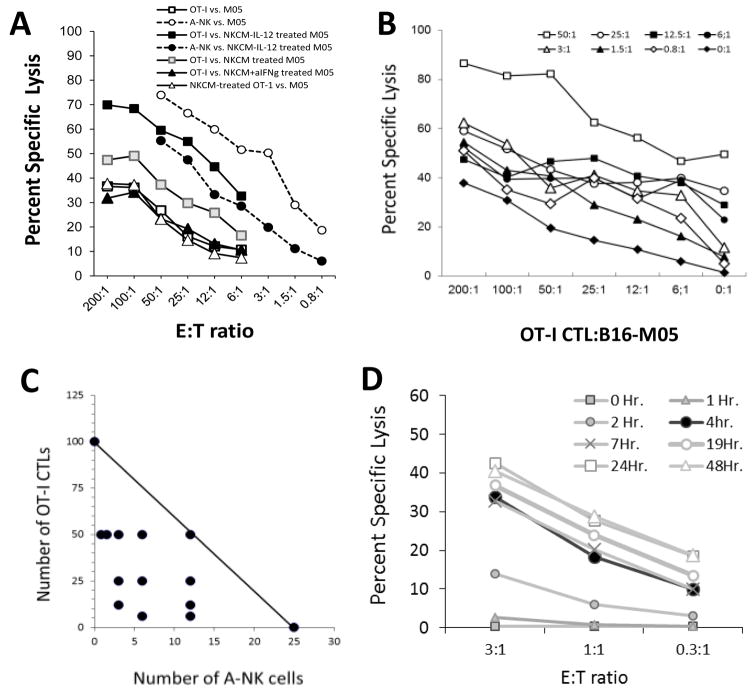
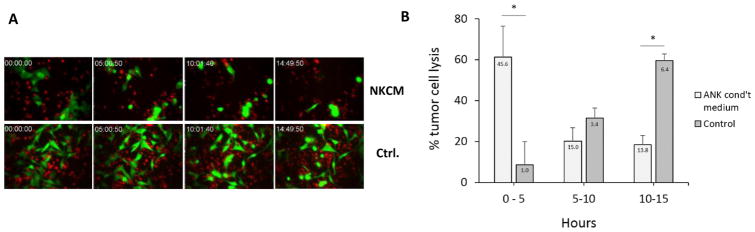
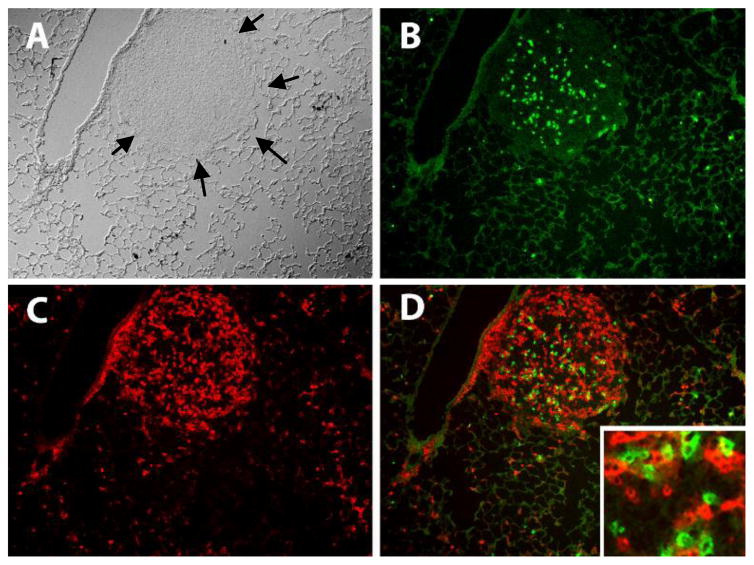
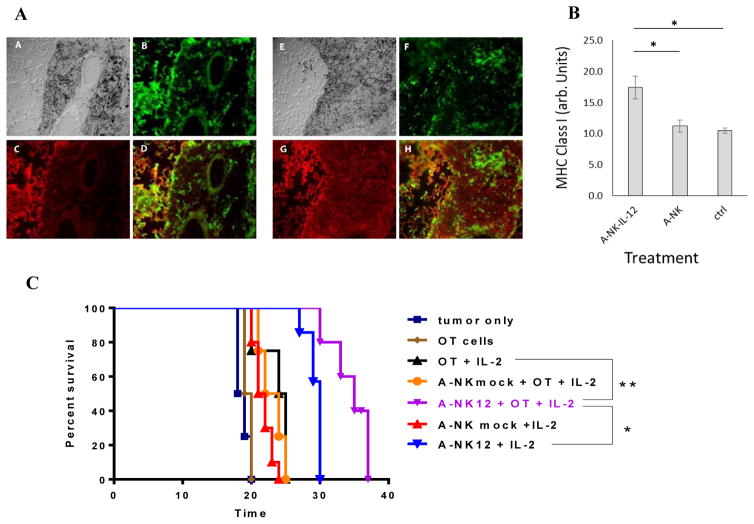
The density of NK cells in tumors correlates positively with prognosis in many types of cancers. The average number of infiltrating NK cells is, however, quite modest (approximately 30 NK cells/sq.mm), even in tumors deemed to have a "high" density of infiltrating NK cells. It is unclear how such low numbers of tumor-infiltrating NK cells can influence outcome. Here, we used ovalbumin-expressing tumor cell lines and TCR transgenic, OVA-specific cytotoxic T lymphocytes (OT-I-CTLs) to determine whether the simultaneous attack by anti-tumor CTLs and IL-2-activated NK (A-NK) cells synergistically increases the overall tumor cell kill and whether upregulation of tumor MHC class-I by NK cell-derived interferon-gamma (IFNγ) improves tumor-recognition and kill by anti-tumor CTLs. At equal E:T ratios, A-NK cells killed OVA-expressing tumor cells better than OT-I-CTLs. The cytotoxicity against OVA-expressing tumor cells increased by combining OT-I-CTLs and A-NK cells, but the increase was additive rather than synergistic. A-NK cells adenovirally-transduced to produce IL-12 (A-NKIL-12) produced high amounts of IFNγ. The addition of a low number of A-NKIL-12 cells to OT-I-CTLs resulted in a synergistic, albeit modest, increase in overall cytotoxicity. Pre-treatment of tumor cells with NK cell-conditioned medium increased tumor MHC expression and sensitivity to CTL-mediated killing. Pre-treatment of CTLs with NK cell-conditioned medium had no effect on CTL cytotoxicity. In vivo, MHC class-I expression by OVA-expressing B16 melanoma lung metastases increased significantly within 24-48h after adoptive transfer of A-NKIL-12 cells. OT-I-CTLs and A-NKIL-12 cells localized selectively and equally well into OVA-expressing B16 lung metastases and treatment of mice bearing 7-days-old OVA-B16 lung metastases with both A-NKIL-12 cells and OT-I-CTLs lead to a significant prolongation of survival. Thus, an important function of tumor-infiltrating NK cells may be to increase tumor cell expression of MHC class-I through secretion of IFNγ, to prepare them for recognition by tumor-specific CTLs.

Keywords: Adoptive cell transfer; Cancer immunotherapy; Cell traffic; Cytotoxic T lymphocytes (CTL); Cytotoxicity; Natural killer cells (NK cells).


Figures

Figure 1
Figure 1. Cytotoxicity against wt. and OVA-expressing tumor cells by A-NK cells and OVA-specific and non-specific CTLs
A–B. To determine if highly activated A-NK cells and CTLs kill each other, CTLs and A-NK cells were used as either effector cells or target cells in standard four hour 51-Cr-release assays. A: Percent Specific lysis of CTL by A-NK cells. B: Percent Specific lysis of A-NK cells by CTLs. C–F: Cytotoxicity of A-NK cells OVA-specific and non-specific CTLs was determined in standard four hour 51-Cr-release assays. C: Percent Specific lysis of wt. B16 and OVA-expressing B16-M05 tumor cells by OVA-specific (OT-I) CTLs and bulk-activated, non-specific CD8 cells. D: Percent Specific lysis of wt. and OVA-Panc02 tumor cells by OVA-specific (OT-I) CTLs and bulk-activated, non-specific CD8 cells. E: Percent Specific lysis of B16 and OVA-expressing B16-M05 tumor cells by OVA-specific (OT-I) CTLs and A-NK cells. F: Percent Specific lysis of wt. and OVA-Panc02 tumor cells by OVA-specific (OT-I) CTLs and NK cells. Representative of two (Panc02) and multiple (B16) experiments.
Figure 2
Figure 2. Additive killing of B16-M05 and OVA-Panc02 tumor cells by OVA-specific (OT-I) CTLs and non-specific A-NK cells
Cytotoxicity of mixtures of OVA-specific (OT-I) CTLs and A-NK cells was determined in standard four hour 51-Cr-release assays. CTLs and A-NK cells were mixed with tumor cells at ratios from 0:1 to 200:1 and 0:1 to 50:1, respectively. A: Percent specific lysis of B16-M05 tumor cells (representative of multiple experiments). B: Percent specific lysis of OVA-Panc02 tumor cells (representative of two experiments). Legend identifies A-NK cell:tumor cell ratios.
Figure 3
Figure 3. Tumor cell expression of H-2Kb following incubation with IFNγ, CTLs, A-NK cells, or medium from CTL and A-NK cell cultures
A: Tumor cell expression of H-2Kb after four and sixteen hours of co-culture with OVA-specific (OT-I) CTLs and A-NK cells. Expression of MHC class-I by B16-M05 tumor cells, which had been incubated with OVA-specific (OT-I) CTLs or A-NK cells for 4–16 hours in the presence (black columns) or absence (grey columns) of blocking antibodies to IFNγ was determined by flow cytometry. MHC class-1 was visualized by staining with PE-conjugated H-2Kb antibody. Black: non-stained cells; Green: isotype control; Red: B16-M05 cells; Blue: B16-M05 cells + A-NK cells (E:T=1:1); Orange: B16-M05 cells + CTLs (OT-I). Representative of two experiments. B: H-2Kb expression by B16-M05 tumor cells was measured by flow cytometry after 16 hours of incubation with IFNγ (5–40ng/ml) or conditioned medium from mock, IL-12, IL-18, and IL-12+IL-18 gene-transduced A-NK cells (collected at 72 hours after the transduction). All incubations were performed in the presence (black columns) or absence (grey columns) of blocking antibodies to IFNγ Values represent Mean Fluorescence Intensity (MFI) Representative of two (IFNγ) and three (NK-supernatants) experiments.
Figure 4
Figure 4. A-NK cell-produced IFNγ increased sensitivity of B16-M05 to killing by OVA-specific (OT-I) CTLs, but lowers their sensitivity to A-NK cell-mediated lysis
B16-M05 cells were incubated in conditioned medium from A-NK cells and IL-12 gene-transduced A-NK cells for 16 hours, washed and then tested in four hour 51-Cr-release assays against A-NK cells and OT-I-CTLs. A: Percent specific lysis by OT-I-CTLs against B16-M05 cells pre-incubated in: control medium (white squares); NKCM from A-NK cells (grey squares); NKCM from NKIL-12 cells (black squares); NKCM from NKIL-12 cells + 0.1 microg/ml blocking anti-IFNγ Ab (black triangles). Percent specific lysis by OT-I-CTLs pre-incubated in NKCM from NKIL-12 cells against non-treated B16-M05 (white triangles). Percent specific lysis by A-NK cells against B16-M05 cells pre-incubated in: control medium (white circles); NKCM from A-NKIL-12 cells (black circles). Lysis of NKCM pretreated B16-M05 cells by OT-I-CTLs was significantly higher at all E:T ratios compared to non-treated B16-M05 (p<0.01). Lysis of NKCM-IL-12 pretreated B16-M05 cells by OT-I-CTLs was significantly higher at all E:T ratios compared to non-treated and NKCM-treated B16-M05 (p<0.01). Lysis of NKCM-IL-12+ anti-IFNγ pretreated B16-M05 cells by OT-I-CTLs was significantly lower at all E:T ratios compared to lysis of NKCM-IL-12 pretreated B16-M05 (p<0.005) and was not significantly better than OT-I-CTL-mediated lysis of non-treated B16-M05. At the E:T ratios tested, lysis of B16-M05 cells by NKCM pre-treated OT-I-CTLs was equal to or lower than lysis of B16-M05 cells by non-treated OT-I-CTLs. B: Cytolysis of B16-M05 tumor cells with heterogeneous expression of MHC class-1: B16-M05 cells were pre-incubated in control medium and in conditioned medium from A-NKIL-12 cells. After incubation, the tumor cells were mixed 1:1 and used as target cells for mixtures of CTLs and A-NK effector cells at E:T ratios from 0:1 to 200:1 and 0:1 to 50:1, respectively, as indicated by the legends. C: Isobolograms were constructed to determine if the concerted cytotoxicity by the CTLs and A-NK cells against the B16-M05 tumor cells was synergistic. The isobole at 30% lysis indicates the CTL:A-NK cells ratios between 100 CTLs:zero A-NK cells and Zero CTL:25 A-NK cells that should produce a 30% lysis of the tumor cells, if their combined cytolytic capacity is additive. Many A-NK cell:CTL mixtures with a total number of effector cells below the 30% isobole were able to kill 30% or more of the tumor cells (black circles), indicating that the combined cytolysis by these effector cell mixtures, was synergistically enhanced. D: Lysis of B16-M05 tumor cells by A-NK cells at 1h (grey squares), 2 h (grey triangles), 4 h (black circles), 7 h (grey x), 19 h (white circle), 24 h (white square), and 48 h (white triangle). Representative of two experiments.
Figure 5
Figure 5. Rapid lysis of NK cell-conditioned tumor cells by tumor-specific CTLs
To determine the influence of pre-treatment with NKCM on the kinetics of tumor cell lysis by tumor-specific CTLs, B16-M05 tumor cells were incubated with 50% NKCM for 18–25 hours. NKCM pretreated and non-treated, GFP+ B16-M05 tumor cells were mixed with CellTracker Orange labeled OT-I-CTLs (E:T = 3:1) and observed by live cell microscopy for 15 hours (DIC, red and green fluorescence images were acquired every 3 minutes). A: Images of co-cultures of OT-I-CTLs and NKCM pretreated (upper row: NKCM) and non-treated (lower row: Control) B16-M05 tumor cells acquired after approximately 0 h, 5 h, 10 h and 15 h of incubation. Left panels show merged DIC and red fluorescence images. Right panels show merged red and green fluorescence images. B: The time of lysis of individual tumor cells within 0–5, 5–10 and 10–15 hours of culture was determined in 12 randomly chosen areas of each co-culture (NKCM and Control). Data are expressed as the percentage of NKCM-treated (light columns) and control (dark columns) tumor cells killed within a 5 hour period relative to all NKCM-treated and control tumor cells, respectively, killed between 0 h and 15 h. *: p<0.05. Numbers in columns indicate the percentage of tumor cells killed within a 5 hour period relative to all tumor cells that could have been killed between 0 h and 15 h. Error bars indicate SE. Representative of three individual experiments.
Figure 6
Figure 6. A-NK cells and tumor-specific CTLs accumulate preferentially in tumor tissue
To determine if A-NK cells interfere with each other’s ability to localize at tumor sites, five million PHA and IL-2 stimulated, Thy1.1+ OT-I-CTLs and 2 million CD45.1 A-NK cells were mixed and injected into Thy1.2+, CD45.2+ mice with well-established, day 10 OVA-MC38 metastases. 10,000 IU Peg-IL-2 was given i.p. immediately after the effector cell injection and again 24 hours later. At ~48 hours after the cell injection, lungs were removed, snap frozen, cryo-sectioned and stained with PE-anti-Thy1.1 antibody and FITC-anti-CD45.1 antibody to in the lungs. Black arrows marks the border between tumor and normal lung tissue. B: FITC-positive (green) CD45.1+ A-NK cells. C: PE-positive (red) Thy1.1+ OT-I-CTLs. D: Overlay of B and C. Insert shows that the OT-I cells and A-NK cells are found in close proximity in the tumor tissue.
Figure 7
Figure 7. Anti-tumor effect of combined treatment with IL-12 gene-transduced A-NK cells and tumor specific CTLs
Tumor-homing by A-NK and IL-12-gene-transduced A-NK cells (A-NKIL-12) and changes in tumor MHC class-I expression was measured in mice with 0VA-B16 lung tumors. Tissue-sections were stained with FITC-anti-Thy1.1 to reveal the transferred A-NK cells and with PE-anti-H-2Kb to reveal MHC expression in the tissues. The expression of MHC was measured by image analysis of tissue-sections. A: A+E: DIC images of B16-M05 tumors from mice treated with A-NK cells (A) and A-NKIL-12 cells (E), respectively. B+F: FITC-Thy1.1 positive A-NK (B) and A-NKIL-12 (F) cells, respectively. C+G: PE-H-2Kb weakly and strongly positive tumors from mice treated with A-NK (C) and A-NKIL-12 (G) cells. D+H: Overlay of B and C (D) and F and G (H). B: Expression of H-2Kb (arbitrary units) in tumors from animals receiving IL-12 gene-transduced A-NK cells (A-NKIL-12), mock-transduced A-NK cells (A-NK), and no cells (ctrl). *: p<0.01. C: Mice bearing 7 days old B16-OVA lung tumors were injected i.v. with A-NK cells (4 × 10⁶), OT-I cells (3 × 10⁶), or both (n=4–6 animals per group). All mice (except those receiving neither A-NK, nor OT-I cells (“tumor only”) or only OT-I cells (“OT cells”) received one i.p. injection of 30,000 IU Peg-IL-2 immediately after the cell injection. Kaplan-Meyer survival curves were constructed. A-NK12 + OT + IL-2 vs. tumor only: +16.5 days (p<0.005); vs. A-NK12+IL-2: + 5 days (p<0.01); vs. A-NKmock + OT-I + IL-2: +12 days (p<0.005); vs. OT-I + IL-2: +11days (p=0.005); vs. OT-1: +15.5 days (p=0.005). *: p<0.01; **: p<0.005.

References

    1. Herberman RB, Nunn ME, Lavrin DH. Natural cytotoxic reactivity of mouse lymphoid cells against syngeneic acid allogeneic tumors. I. Distribution of reactivity and specificity. International journal of cancer. Journal international du cancer. 1975;16(2):216–229. http://www.ncbi.nlm.nih.gov/pubmed/50294. - PubMed
    1. Kiessling R, Klein E, Wigzell H. “Natural” killer cells in the mouse. I. Cytotoxic cells with specificity for mouse Moloney leukemia cells. Specificity and distribution according to genotype. European journal of immunology. 1975;5(2):112–117. doi: 10.1002/eji.1830050208. http://www.ncbi.nlm.nih.gov/pubmed/1234049. - DOI - PubMed
    1. Domogala A, Madrigal JA, Saudemont A. Natural Killer Cell Immunotherapy: From Bench to Bedside. Frontiers in immunology. 2015;6:264. doi: 10.3389/fimmu.2015.00264. http://www.ncbi.nlm.nih.gov/pubmed/26089820. - DOI - PMC - PubMed
    1. Gras Navarro A, Bjorklund AT, Chekenya M. Therapeutic potential and challenges of natural killer cells in treatment of solid tumors. Frontiers in immunology. 2015;6:202. doi: 10.3389/fimmu.2015.00202. http://www.ncbi.nlm.nih.gov/pubmed/25972872. - DOI - PMC - PubMed
    1. Liu LL, Pfefferle A, Yi Sheng VO, Bjorklund AT, Beziat V, Goodridge JP, Malmberg KJ. Harnessing adaptive natural killer cells in cancer immunotherapy. Molecular oncology. 2015;9(10):1904–1917. doi: 10.1016/j.molonc.2015.10.001. http://www.ncbi.nlm.nih.gov/pubmed/26604011. - DOI - PMC - PubMed

Publication types