. 2016 Jul 25;213(8):1571-87.
doi: 10.1084/jem.20151916. Epub 2016 Jul 4.

Brain-resident memory T cells represent an autonomous cytotoxic barrier to viral infection

Affiliations

Brain-resident memory T cells represent an autonomous cytotoxic barrier to viral infection

Karin Steinbach et al. J Exp Med. .

Abstract

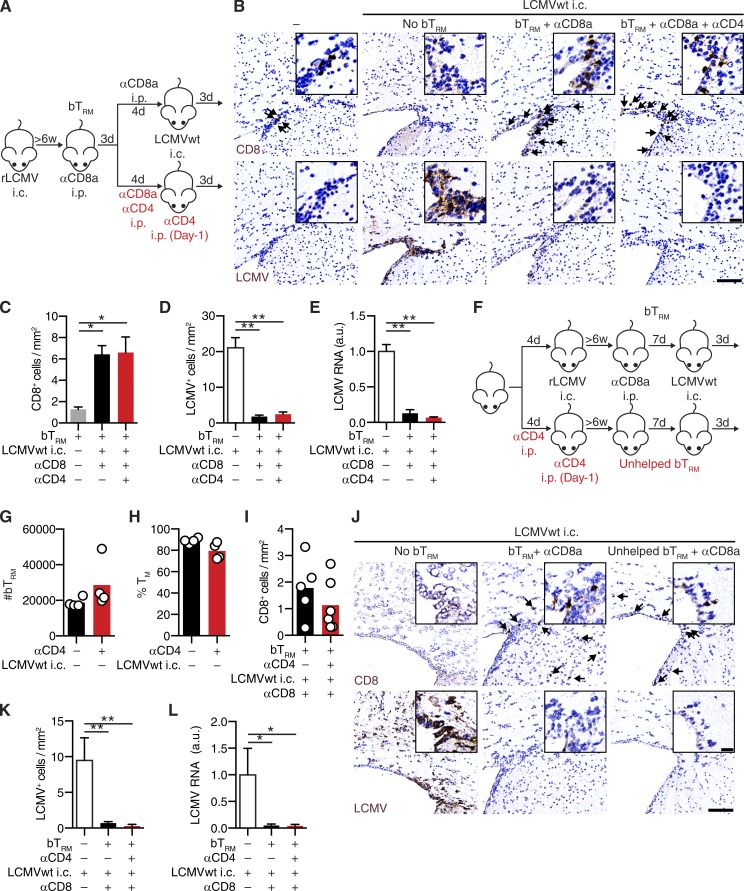
Tissue-resident memory T cells (TRM) persist at sites of prior infection and have been shown to enhance pathogen clearance by recruiting circulating immune cells and providing bystander activation. Here, we characterize the functioning of brain-resident memory T cells (bTRM) in an animal model of viral infection. bTRM were subject to spontaneous homeostatic proliferation and were largely refractory to systemic immune cell depletion. After viral reinfection in mice, bTRM rapidly acquired cytotoxic effector function and prevented fatal brain infection, even in the absence of circulating CD8(+) memory T cells. Presentation of cognate antigen on MHC-I was essential for bTRM-mediated protective immunity, which involved perforin- and IFN-γ-dependent effector mechanisms. These findings identify bTRM as an organ-autonomous defense system serving as a paradigm for TRM functioning as a self-sufficient first line of adaptive immunity.


Figures

Figure 1.
Figure 1.
CD103+ and CD103 TM persist in the brain after cerebral viral infection. (A) Representative brain sections of WT mice immunostained for LCMV nucleoprotein (arrows) at indicated days after rLCMV i.c. infection. Bars: 100 µm; (inset) 20 µm. (B–F) Flow cytometric analysis of brain-derived CD8+ T cells after rLCMV i.c. infection (as in Fig. S1). (B) Quantification of brain CD8+ T cell numbers and (C) frequencies of TM and short-lived effectors (SLE) at indicated days (d) after infection. (D) CD69+ brain TM (bTM) were analyzed for surface expression of CD103, binding of Db-NP396-404-tetramer, and intracellular expression of Bcl-2 and Granzyme B (GzmB; filled histograms, antibody stainings; open histograms, staining controls) 6 wk after infection. Numbers indicate frequencies of positive cells (mean ± SEM; n = 3 mice). (E) Frequencies of CD103+ bTM at indicated days (d) after infection. (F and G) P14 or OT-1 TCR transgenic CD8+ T cells were adoptively transferred into naive WT mice 24 h before infection with indicated viruses. CD69 and CD103 surface expression on the adoptively transferred T cells (CD45.1+) and on endogenous MVA-specific CD8+ T cells (Kb-B8R20-27-Tet+) in brains was analyzed by flow cytometry at 14 (F) or 6 wk (G) after infection. The frequencies of cells in the different gates are indicated (mean ± SEM; n = 4–5 mice per group). (H) 3 mo after infection with rLCMV i.c., anti–CD8b-PE was injected i.v. and PE-labeled CD8b+ T cells were measured in the blood and the brain by flow cytometry. Representative plots of CD8b-positive (intravascular, red) and -negative (extravascular, blue) CD8a+ T cells in relation to CD69 expression are shown. The frequencies of cells in the different gates are indicated (mean ± SEM; n = 4–5 mice per group). (I) rLCMV i.c. infected WT mice were treated with anti-CD8a depleting antibody i.p. 6 wk after infection. Frequencies and numbers of CD103+ and CD103 brain TM (CD8+CD44+CD69+) were analyzed by flow cytometry 6 wk later. (B, E, and I) Bars represent mean + SEM (n = 5–6 mice per group). One representative of (A, D, H, and I) or data pooled from (B, C, and E) at least two independent experiments is shown. (F and G) Experiments were performed once. For flow cytometric gating strategy see Fig. S1.
Figure 2.
Figure 2.
Brain TRM generated by local infection are associated with accelerated virus clearance. (A) WT mice were infected with rLCMV i.v. or co-infected i.v. + i.c., and brains were analyzed at least 6 wk later. (B) Frequencies of Db-NP396-404–specific CD8+ T cells in peripheral blood. (C) Representative images of immunostained brain sections for CD8+ T cells (arrows) and quantification thereof. Bars: 100 µm; (inset) 20 µm. (D) Frequencies of bTRM (CD8+CD44+CD69+) in total brain leukocytes as determined by flow cytometry (as in Fig. S1). (E) Representative flow cytometry plot of CD103 and Db-NP396-404-tetramer on brain TM (left) and frequencies of Db-NP396-404–specific brain CD8+ T cells (CD8+CD44+CD69+; right). Numbers represent frequencies (%) of positive events. (F) WT mice were infected with rLCMV as in A and challenged with LCMVwt i.c. 6 wk later. Naive WT mice infected with LCMVwt i.c. were used as controls. Quantification of LCMV RNA by qPCR in the brain (normalized to the virus load in naive mice infected with LCMVwt i.c. = 1). (B–E) Bars represents mean and each symbol represents an individual mouse (n = 3–4 mice per group) or (F) bars represent mean + SEM. (n = 5 mice per group). **, P < 0.01, one-way ANOVA followed by Tukey’s multiple comparisons test. One out of at least two independent experiments is shown.
Figure 3.
Figure 3.
bTRM are localized in proximity to surface-associated structures and show homeostatic proliferation. (A–G) Mice were infected with rLCMV i.c. to generate bTRM and analyzed at least 6 wk later. (A) Regional distribution of CD8+ T cells within the brain. Representative immunofluorescent images of CD8+ cells localized at meninges (M), choroid plexus (CP), periventricular area (PV), interareal borders (B), and parenchyma (P), and quantification of CD8+ cell density in these areas are shown. Vessels are visualized by immunostaining for Von-Willebrand Factor (VWF). Dotted lines mark the separation to the brain parenchyma. (B) Density plot of brain CD8+ cells in relation to surface structures and vessels. Data are pooled from three mice. (C) Representative images of brain immunofluorescence co-staining for CD8 and CD103 and quantification of CD103+ and CD103 CD8+ T cells grouped in brain areas as defined in A are shown. Data are pooled from three mice (n = total counted cells). (D) Representative flow cytometry plot of Ki-67–expressing bTRM (CD8+CD44+CD69+; n = 4–5 mice per group). (E and F) Representative images of Ki-67– (E) or P-Stat5–positive and negative (F) T cells (left) and proportion of positive T cells at brain surface structures (meninges, choroid plexus, periventricular areas, interareal borders) in comparison to brain parenchyma (right). *, P < 0.05, paired two-tailed Student’s t test. (G) Histocytometry analysis of P-Stat5–positive T cells in relation to their distance to surface (meninges). Data are pooled from three mice. Numbers represent frequencies (%) of cells in corresponding gates. Bars: (A, E, F, and inset in C) 10 µm; (C) 100 µm. For histocytometry data processing and gating strategy, see Fig. S2.
Figure 4.
Figure 4.
bTRM mediate rapid LCMV clearance independently of circulating TM cell recruitment. (A) WT mice were infected with rLCMV i.v. (no bTRM) or i.v. + i.c. (bTRM). At least 6 wk later, mice were treated i.p. with anti-CD8a depleting antibody before LCMVwt i.c. challenge or left unchallenged, and brains were analyzed 3 d later. (B) CD8+ T cells quantification on immunostained brain sections in relation to the presence of bTRM (+), circulating CD8 depletion (+) and LCMVwt i.c. challenge (+). (C) Representative images of CD8 (top, arrows) or LCMV (bottom, arrows) on immunostained brain sections. Bars: 100 µm; (inset) 20 µm. (D) Representative flow cytometry plot (left) and frequencies (right) of Ki-67–expressing bTRM (CD8+CD44+CD69+) after LCMVwt i.c. challenge (+) or in unchallenged control mice (–). Numbers represent frequencies of positive cells. (E) Frequencies of CD103-expressing bTRM in LCMVwt i.c. challenged (+) or unchallenged (–) mice as in D. (F) Frequencies of Ki-67–expressing CD103+ and CD103 bTRM as in D. (D–F) Each symbol represents an individual mouse and bars indicate mean. (G) Quantification of LCMV+ cells by immunohistochemistry on brain sections and (H) LCMV RNA by qPCR (normalized to naive mice infected with LCMVwt i.c. = 1) in the brain of mice as in B. Data represent mean + SEM (n = 3–5 mice for unchallenged controls (−); n = 5–6 for mice challenged with LCMVwt i.c.) *, P < 0.05; **, P < 0.01, one-way ANOVA followed by Sidak’s multiple comparisons test (B, G, and H); unpaired two-tailed Student’s t test (D). One representative out of at least two independent experiments is shown (B–H).
Figure 5.
Figure 5.
bTRM generation and functionality in the absence of CD4+ T cell help. (A) WT mice were infected with rLCMV i.c. 11 wk later, mice were treated with anti-CD8a alone or in combination with anti-CD4 depleting antibody i.p., and subsequently challenged with LCMVwt i.c. Naive WT mice infected with LCMVwt i.c. were used as controls. Brains were analyzed 3 d later. (B) Representative images of brain sections immunostained for CD8 (top, arrows) or LCMV (bottom). Quantification of CD8+ T cells (C), LCMV+ cells by immunohistochemistry (D), or LCMV RNA by qPCR (E; normalized to naive mice infected with LCMVwt i.c. = 1). (F) WT mice were treated with anti-CD4 depleting antibody as indicated and were infected with rLCMV i.c. 6 wk later, rLCMV memory mice containing helped or unhelped bTRM were treated with anti-CD8a depleting antibody and challenged with LCMVwt i.c. (G) numbers of bTRM (CD8+CD44+CD69+) and (H) frequencies of TM cells (CD127+KLRG1) among bTRM (CD8+CD44+CD69+) were determined by flow cytometry in unchallenged rLCMV memory mice. (I–L) 6 wk after antibody-mediated depletion of CD4+ T cells, rLCMV memory mice, as in F, were challenged with LCMVwt i.c. and analyzed 3 d later. (I) Quantification of CD8+ T cells by immunohistochemistry. (J) Representative images of brain sections immunostained for CD8 (top, arrows) or LCMV (bottom). (G–I) Each symbol represents an individual mouse and bars indicate mean. Quantification of (K) LCMV+ cells by immunohistochemistry (L) LCMV RNA by qPCR (normalized to naive mice infected with LCMVwt i.c. = 1) 3 d after LCMVwt i.c. challenge. Data represent mean + SEM (where included). (B–E) n = 5 mice per group, (G–H) n = 4 mice per group, (I–L) n = 3 mice for naive WT mice infected with LCMVwt i.c. (white bars), n = 5–6 mice per group of rLCMV memory mice after LCMVwt i.c. challenge. *, P < 0.05; **, P < 0.01, one-way ANOVA with Tukey’s multiple comparison test. One experiment was performed. Bars: 100 µm; (inset) 20 µm.
Figure 6.
Figure 6.
bTRM-mediated rapid viral clearance is independent of circulating NK cells. (A) WT mice were infected with rLCMV i.c. 12 wk later, mice were treated with anti-CD8a only or in combination with anti-NK1.1 depleting antibody i.p., and subsequently challenged with LCMVwt i.c. Naive WT mice infected with LCMVwt i.c. were used as controls. Brains were analyzed 3 d after i.c. challenge. (B) Representative images of brain sections immunostained for CD8 (top, arrows) or LCMV (bottom). Bars: 100 µm; (inset) 20 µm. Quantification of CD8+ T cells (C), LCMV+ cells (D), or LCMV RNA by qPCR (E; normalized to naive mice infected with LCMVwt i.c. = 1). Data represent mean + SEM (n = 5 mice per group). **, P < 0.01, one-way ANOVA with Tukey’s multiple comparison test. One experiment was performed.
Figure 7.
Figure 7.
MHC-I–restricted presentation of cognate antigen is required for bTRM-mediated virus clearance. (A) WT mice were infected with rLCMV i.c. to generate bTRM. At least 6 wk later, mice were treated with anti-CD8a depleting antibody i.p. before i.c. challenge with LCMVwt or LCMV-NPN400S or left unchallenged. Brains were analyzed 3 d later. (B) Representative images of CD8 (top, arrows) or LCMV (bottom) on brain sections of virus challenged or unchallenged (−) mice. Bars: 100 µm; (inset) 20 µm. Quantification of CD8+ T cells (C), LCMV+ cells (D), or LCMV RNA by qPCR (E; normalized to naive mice infected with LCMV i.c. = 1). (F) Quantification of Ifitm3 mRNA by qPCR in the brain of mice in relation to the presence of bTRM (+) and LCMVwt or LCMV-NPN400S i.c. infection (+; normalized to uninfected mice = 1). (G) Representative flow cytometry plot of GzmB and Ki-67–expressing bTRM (CD8+CD44+CD69+). Numbers represent frequencies of positive cells. Frequencies of (H) GzmB and (I) Ki-67–expressing bTRM. (H and I) Each symbol represents an individual mouse. Data represent mean + SEM (n = 3–5 mice per group). *, P < 0.05; **, P < 0.01, one-way ANOVA followed by Tukey’s (C, D, E, H, and I) or Dunnet’s multiple comparison test (F). One representative out of two independent experiments is shown (B–I).
Figure 8.
Figure 8.
bTRM-mediated rapid virus clearance depends on IFN-γ and perforin. (A) Mice were infected with rLCMV i.c to generate bTRM. At least 6 wk later, mice were treated with anti-CD8a depleting antibody i.p. before LCMVwt i.c. challenge or left unchallenged. Brains were analyzed 3 d later. (B, left) Representative flow cytometry plot of IFN-γ production and degranulation as measured by surface exposure of CD107a in bTRM (CD8+CD44+CD69+) of unchallenged (bTRM) or LCMVwt i.c.-challenged (bTRM + LCMVwt i.c.) WT mice with (+) or without (–) in vitro NP396-404 peptide stimulation. Numbers indicate frequencies (%) of cells in corresponding gates. (right) Frequencies (mean + SEM) of IFN-γ–positive (black bars), CD107a positive (gray bars), and double-positive (blue bars) bTRM with (+) or without (–) LCMVwt i.c. challenge and with (+) or without (–) in vitro NP396-404 peptide stimulation (n = 3–4 mice per group). (C–G) IFN-γ–competent (control)- or GKO-rLCMV memory mice were generated and treated as in A. (C) Frequencies of TM cells (CD127+KLRG1) among bTRM (CD8+CD44+CD69+) as determined by flow cytometry in unchallenged IFN-γ–competent (control) and GKO mice. Each symbol represents an individual mouse and bars indicate mean (n = 4 mice per group). (D) Representative images of immunostained brain sections for CD8 (top, arrows) or LCMV (bottom). (E) Quantification of CD8+ T cells, (F) LCMV+ cells, or (G) LCMV RNA by qPCR (normalized to naive mice infected with LCMVwt i.c. = 1) in brains of GKO and control mice with (+) or without (–) LCMVwt i.c. challenge. Data represent mean + SEM (n = 3–10 mice per group). (H–M) Perforin-competent (control)- or PKO-rLCMV memory mice were generated and treated as in A. (H) Frequencies of TM cells among bTRM (as in C) in unchallenged perforin-competent (control) and PKO mice. Each symbol represents an individual mouse and bars indicate mean (n = 4 mice per group). (I) Frequencies of GzmB-expressing cells among bTRM as determined by flow cytometry 3 d after LCMVwt i.c. challenge of control or PKO mice. Each symbol represents an individual mouse, and bars indicate mean (n = 4–6 mice per group). (J) Representative images of immunostained brain sections for CD8 (top, arrows) or LCMV (bottom). (K) Quantification of CD8+ T cells, (L) LCMV+ cells, or (M) LCMV RNA by qPCR (normalized to naive mice infected with LCMVwt i.c. = 1) in brains of PKO and control mice with (+) or without (–) LCMVwt i.c. challenge. Data represent mean + SEM (n = 4–6 mice per group). *, P < 0.05; **, P < 0.01, asterisk colors represent multiple comparisons performed, two-way ANOVA with Tukey’s multiple comparisons (B), one way ANOVA with Sidak’s multiple comparisons test (I), unpaired two-tailed Student’s t test (C, F, G, H, L, and M). One representative (B–F and J–M) or pool (G) of two independent experiments is shown. (H and I) Experiments were performed once. Bars, 100 µm; (inset) 20 µm.
Figure 9.
Figure 9.
bTRM protect against LCMV-induced choriomeningitis in an antigen-dependent manner. (A) WT mice were infected with rLCMV i.v. (no bTRM) or i.v. + i.c. (bTRM). At least 6 wk later, mice were treated with anti-CD8a-depleting antibody i.p. followed by 6 wk reconstitution of naive CD8+ T cells. Subsequently mice were challenged with LCMVwt or LCMV-NPN400S i.c. (B) Representative images of CD8 (top, arrows) or LCMV (bottom, arrow) on brain sections 3 d after LCMVwt i.c. challenge. Bars: 100 µm; (inset) 20 µm. (C) Quantification of CD8+ T cells and (D) LCMV+ cells of mice as in C. Each symbol represents an individual mouse and bars indicate mean (n = 3–4 mice per group). (E) LCMV RNA by qPCR (normalized to naive mice infected with LCMV i.c. = 1) of mice as in C. Data represent mean + SEM (n = 3–4 mice per group). (F) Incidence of fatal choriomenigitis after LCMVwt i.c. challenge (n = 7–8 mice per group). (G) Incidence of disease after LCMVwt or LCMV-NPN400S i.c. challenge (n = 5 mice per group). *, P < 0.05; **, P < 0.01, (C–E) one-way ANOVA with Sidak’s multiple comparisons test, (F and G) Log rank Mantel-Cox test. (C, D, E, and G) Experiments were performed once. (F) Data are pooled from two independent experiments.

References

    1. Adachi T., Kobayashi T., Sugihara E., Yamada T., Ikuta K., Pittaluga S., Saya H., Amagai M., and Nagao K.. 2015. Hair follicle-derived IL-7 and IL-15 mediate skin-resident memory T cell homeostasis and lymphoma. Nat. Med. 21:1272–1279. 10.1038/nm.3962 - DOI - PMC - PubMed
    1. Anderson K.G., Mayer-Barber K., Sung H., Beura L., James B.R., Taylor J.J., Qunaj L., Griffith T.S., Vezys V., Barber D.L., and Masopust D.. 2014. Intravascular staining for discrimination of vascular and tissue leukocytes. Nat. Protoc. 9:209–222. 10.1038/nprot.2014.005 - DOI - PMC - PubMed
    1. Ariotti S., Beltman J.B., Chodaczek G., Hoekstra M.E., van Beek A.E., Gomez-Eerland R., Ritsma L., van Rheenen J., Marée A.F., Zal T., et al. . 2012. Tissue-resident memory CD8+ T cells continuously patrol skin epithelia to quickly recognize local antigen. Proc. Natl. Acad. Sci. USA. 109:19739–19744. 10.1073/pnas.1208927109 - DOI - PMC - PubMed
    1. Ariotti S., Hogenbirk M.A., Dijkgraaf F.E., Visser L.L., Hoekstra M.E., Song J.Y., Jacobs H., Haanen J.B., and Schumacher T.N.. 2014. T cell memory. Skin-resident memory CD8+ T cells trigger a state of tissue-wide pathogen alert. Science. 346:101–105. 10.1126/science.1254803 - DOI - PubMed
    1. Battegay M., Cooper S., Althage A., Bänziger J., Hengartner H., and Zinkernagel R.M.. 1991. Quantification of lymphocytic choriomeningitis virus with an immunological focus assay in 24- or 96-well plates. J. Virol. Methods. 33:191–198. 10.1016/0166-0934(91)90018-U - DOI - PubMed

Publication types

MeSH terms