Review
. 2016 Aug 5;371(1700):20150429.
doi: 10.1098/rstb.2015.0429.

Impairments of neural circuit function in Alzheimer's disease

Affiliations
Review

Impairments of neural circuit function in Alzheimer's disease

Marc Aurel Busche et al. Philos Trans R Soc Lond B Biol Sci. .

Abstract

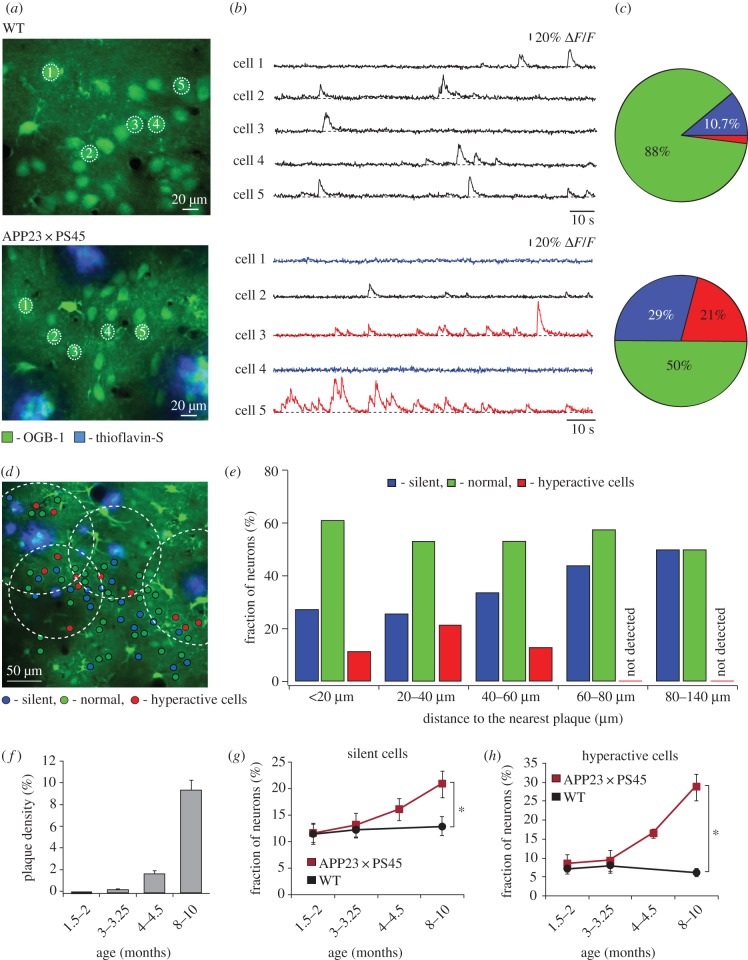
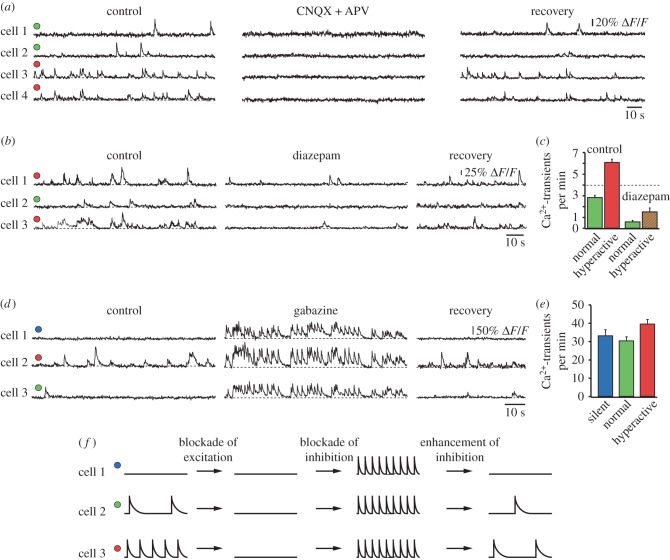
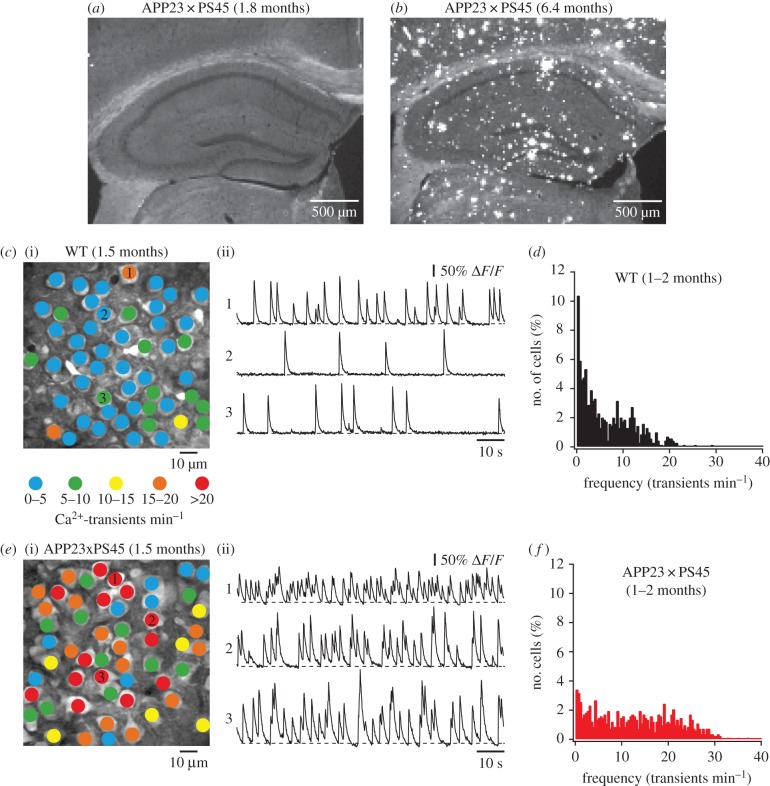
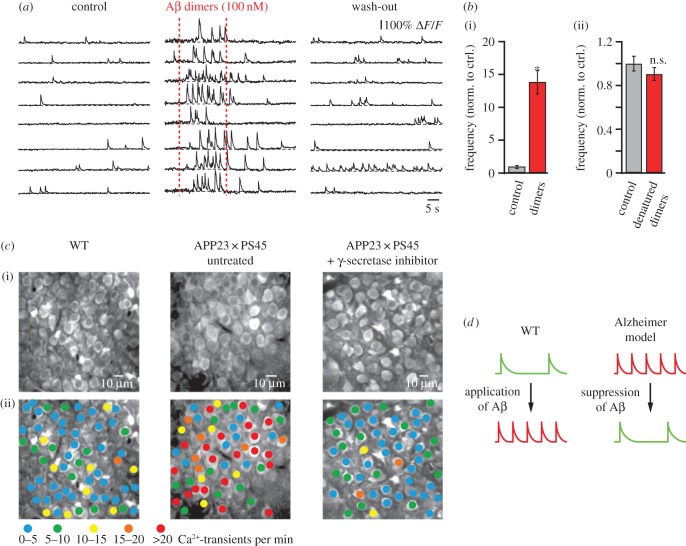
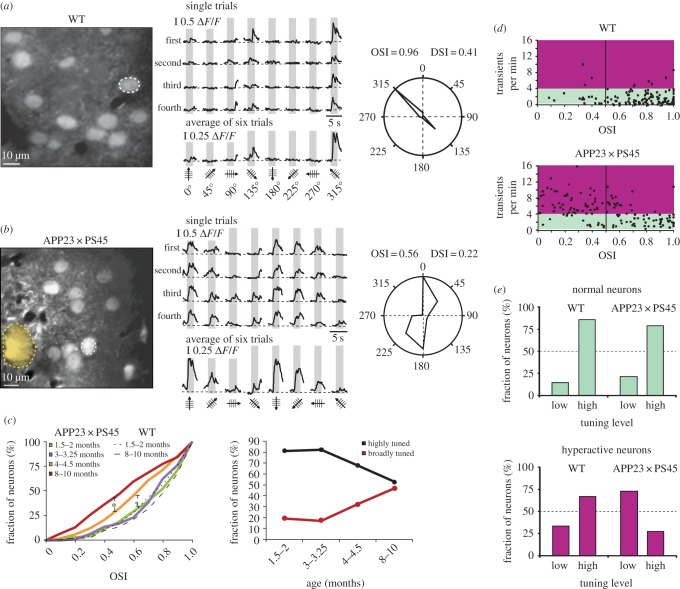
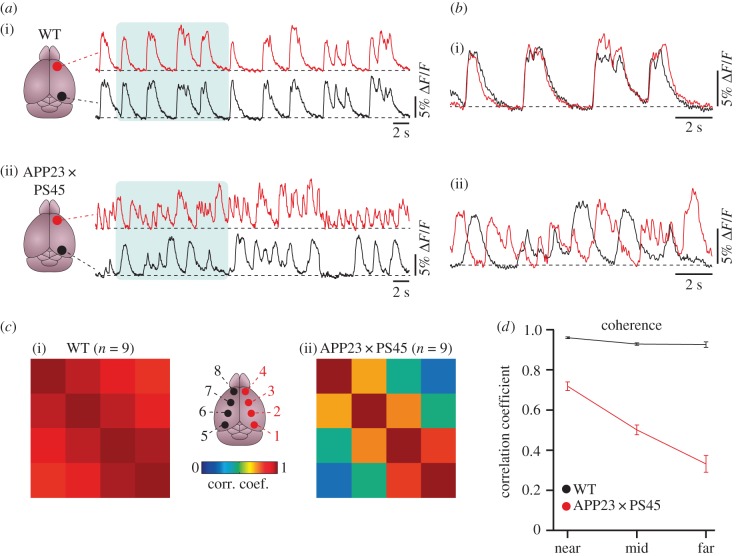
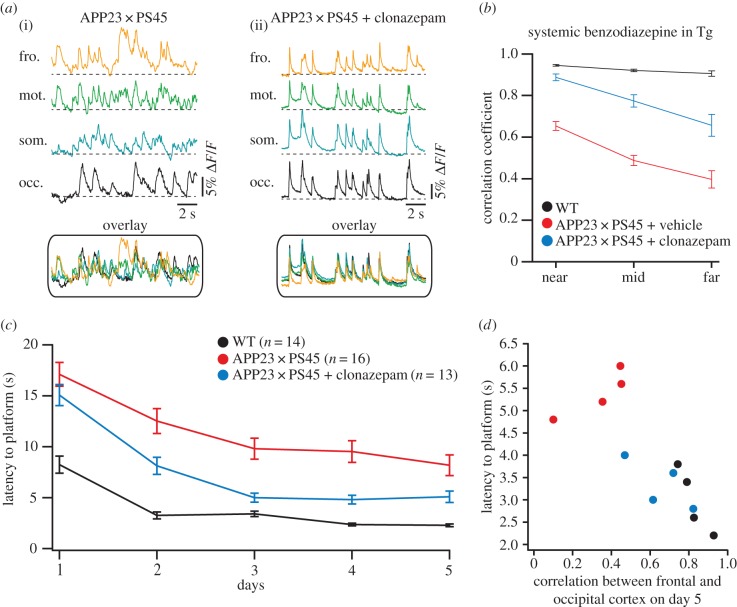
An essential feature of Alzheimer's disease (AD) is the accumulation of amyloid-β (Aβ) peptides in the brain, many years to decades before the onset of overt cognitive symptoms. We suggest that during this very extended early phase of the disease, soluble Aβ oligomers and amyloid plaques alter the function of local neuronal circuits and large-scale networks by disrupting the balance of synaptic excitation and inhibition (E/I balance) in the brain. The analysis of mouse models of AD revealed that an Aβ-induced change of the E/I balance caused hyperactivity in cortical and hippocampal neurons, a breakdown of slow-wave oscillations, as well as network hypersynchrony. Remarkably, hyperactivity of hippocampal neurons precedes amyloid plaque formation, suggesting that hyperactivity is one of the earliest dysfunctions in the pathophysiological cascade initiated by abnormal Aβ accumulation. Therapeutics that correct the E/I balance in early AD may prevent neuronal dysfunction, widespread cell loss and cognitive impairments associated with later stages of the disease.This article is part of the themed issue 'Evolution brings Ca(2+) and ATP together to control life and death'.

Keywords: Alzheimer's disease; amyloid-β; in vivo calcium imaging; mouse models.


Figures

Figure 1.
Figure 1.
Functional impairments of cortical neurons in mouse models of AD in vivo. (a) In vivo two-photon calcium image of layer 2/3 neurons in the frontal cortex of a wild-type (WT) mouse (top panel) and an APP23 × PS45 transgenic mouse with thioflavin-S labelled amyloid plaques (bottom panel). (b) Spontaneous Ca2+-transients from neurons marked in (a): blue, silent neurons; black, normal neurons; red, hyperactive neurons. (c) Relative fractions of silent (blue), normal (green) and hyperactive (red) neurons. (d) Activity map of cortical region in an APP23 × PS45 mouse with neurons colour-coded according to the frequency of their spontaneous Ca2+ transients. Broken line circles are centred at the respective plaques and delineate the area located less than 60 µm from the plaque border. Adapted from [18]. Reproduced with permission from AAAS. (e) Bar graphs showing the abundance of silent (blue), normal (green) and hyperactive (red) neurons at different distances from the border of the nearest plaque. (f) Age-dependent increase in plaque burden in the cortex of APP23 × PS45 mice. (g,h) Relative proportions of silent (g) and hyperactive (h) neurons in WT (black) and APP23 × PS45 (red) mice at four different age groups (1.5–2, 3–3.25, 4–4.5 and 8–10 months). Error bars indicate s.e.m. Adapted from [19].
Figure 2.
Figure 2.
Impaired excitation–inhibition (E/I) balance in the amyloid-bearing mouse cortex. (a) Spontaneous Ca2+-transients in normal (green circles) and hyperactive (red circles) cortical neurons before, during and after local application of the glutamate receptor antagonists CNQX and APV. (b) Ca2+-transients in normal and hyperactive neurons before, during and after local application of the GABAA-receptor agonist diazepam. (c) Summary graph illustrating the effect of diazepam on the frequency of Ca2+-transients. (d) Ca2+-transients in silent (blue), normal and hyperactive neurons before, during and after local application of the GABAA-receptor antagonist gabazine. (e) Summary graph illustrating the effect of gabazine on the frequency of Ca2+-transients. Adapted from [18]. Reprinted with permission from AAAS. (f) Schematic model summarizing the results shown in (ae).
Figure 3.
Figure 3.
Hyperactivity precedes amyloid plaque formation in the hippocampus. (a,b) Confocal fluorescence images of sagittal hippocampal sections from a young APP23 × PS45 mouse without (a) and an aged APP3 × PS45 mouse with several (b) amyloid plaques. Plaques were labelled with thioflavin-S. (c) (i) Activity map of hippocampal region in a WT mouse with neurons colour-coded according to the frequency of their spontaneous activity. (ii) Ca2+-transients of the corresponding neurons marked in (i). (d) Histogram showing the frequency distribution of Ca2+-transients in WT mice (n = 693 cells in six mice). (e) Activity map of the hippocampus and example traces from individual neurons in a young APP23 × PS45 mouse without plaques. (f) Histogram of frequency distribution of Ca2+-transients in APP23 × PS45 mice before plaque formation (n = 818 cells in seven mice). Adapted from [24].
Figure 4.
Figure 4.
Hippocampal hyperactivity is determined by soluble Aβ. (a) Ca2+-transient activity in CA1 hippocampal neurons in a WT mouse before, during and after local application of Aβ dimer solution (100 nM). (b) (i) Summary graph illustrating the effect of amyloid dimers on the frequency of Ca2+-transients. (ii) Summary graph showing that heat-denatured dimers have no significant effect on neuronal activity. Error bars indicate s.e.m. (c) (i) In vivo two-photon image of CA1 hippocampal neurons in a WT, an untreated APP23 × PS45, and a γ-secretase inhibitor (LY-411575)-treated APP23 × PS45 mouse. (ii) Activity maps of the hippocampal region shown in top panel with neurons colour-coded according to the frequency of their spontaneous Ca2+-transients. Adapted from [24]. (d) Schematic model summarizing the results shown in (ac).
Figure 5.
Figure 5.
Impaired signal processing in the visual cortex of the AD mouse model. (a) Left panel, in vivo two-photon image of layer 2/3 neurons in the visual cortex of a WT mouse. Middle panel, stimulus-evoked Ca2+-transients recorded from the orientation selective neuron indicated in the left panel by a white dotted circle. Grey regions indicate periods of visual stimulation with drifting gratings schematized by oriented arrows on the bottom of each panel. Four single trials are represented on top and the average of six trials is shown below. Right panel, polar plot showing the neuron's response function to oriented drifting gratings. The responses to each of the eight directions tested were normalized with respect to the maximal response. Then, the function was constructed by connecting the eight values. (b) Left panel, in vivo two-photon image of layer 2/3 neurons in the visual cortex of an APP23 × PS45 mouse. The broken yellow line delineates a thioflavin-S-positive plaque observed in the imaged focal plane. Middle panel, stimulus-evoked Ca2+-transients recorded from the neuron marked in the left panel. Right panel, polar plot showing the neuron's response function to oriented drifting gratings. (c) Left panel, cumulative distributions of the orientation selectivity indices (OSIs) determined for all responsive neurons recorded in APP23 × PS45 as well as WT mice at different age groups. Right panel, proportion of highly (OSI > 0.5) and broadly (OSI < 0.5) tuned neurons in the visual cortex of APP23 × PS45 mice (same neurons as used for analysis in left panel). (d) Scatter plots showing the relationship between the OSI and the frequency of spontaneous Ca2+-transients in WT (top panel) and APP23 × PS45 (bottom panel) mice. Coloured areas indicate the frequency domains of ‘normal’ (green) and hyperactive (purple) neurons. (e) Comparison of the fractions of normal (top panel) and hyperactive (bottom panel) neurons with low (OSI < 0.5) and high orientation tuning (OSI > 0.5) levels in WT and APP23 × PS45 mice (same neurons as used for analysis in d). Adapted from [19].
Figure 6.
Figure 6.
Impaired slow-wave oscillations in mouse models of AD in vivo. (a) Example traces of slow-wave oscillations from the frontal (red) and occipital (black) cortex in a WT (i) and an APP23 × PS45 mouse (ii). (b) Superimposed traces from the shaded areas in (a). (c) Cross-correlation matrix from the cortical regions indicated in the scheme at centre of WT (i) and APP23 × PS45 (ii) mice. (d) Summary graph displaying the average cross-correlation coefficients and standard errors plotted against the cortical distance (categorized as ‘near’ for two neighbouring cortical regions, ‘mid’ for domain pairs separated by one region and ‘far’ for domain pairs separated by two regions) in WT (black) and APP23 × PS45 mice (red). Adapted from [56].
Figure 7.
Figure 7.
Pharmacological rescue of slow-wave activity and memory deficits in AD mouse models. (a) Slow-wave oscillations in an untreated APP23 × PS45 (i) and a benzodiazepine-treated (ii) APP23 × PS45 mouse (occ., occipital; som., somatosensory; mot., motor; fro., frontal cortex). (b) Summary graph showing the average cross-correlation coefficients and standard errors plotted against the cortical distance in WT (black), untreated APP23 × PS45 (red) and benzodiazepine-treated (blue) APP23 × PS45 mice. (c) Results from a discriminatory water maze showing the mean time required to reach the platform (latency) for WT (black), untreated APP23 × PS45 (red) and benzodiazepine-treated APP23 × PS45 mice (blue). (d) The latency to find the platform on day 5 is plotted against the correlation between frontal and occipital cortex in WT (black), untreated APP23 × PS45 (red) and benzodiazepine-treated APP23 × PS45 (blue) mice. Each circle represents an individual animal. All error bars indicate s.e.m. Adapted from [56].

References

    1. Masters CL, Bateman R, Blennow K, Rowe CC, Sperling RA, Cummings JL. 2015. Alzheimer's disease. Nat. Rev. Dis. Primers 1, 15056 ( 10.1038/nrdp.2015.56) - DOI - PubMed
    1. McKhann GM, et al. 2011. The diagnosis of dementia due to Alzheimer's disease: recommendations from the National Institute on Aging-Alzheimer's Association workgroups on diagnostic guidelines for Alzheimer's disease. Alzheimers Dement. 7, 263–269. ( 10.1016/j.jalz.2011.03.005) - DOI - PMC - PubMed
    1. Golde TE, Schneider LS, Koo EH. 2011. Anti-Aβ therapeutics in Alzheimer's disease: the need for a paradigm shift. Neuron 69, 203–213. ( 10.1016/j.neuron.2011.01.002) - DOI - PMC - PubMed
    1. Jansen WJ, et al. 2015. Prevalence of cerebral amyloid pathology in persons without dementia: a meta-analysis. J. Am. Med. Assoc. 313, 1924–1938. ( 10.1001/jama.2015.4668) - DOI - PMC - PubMed
    1. Ossenkoppele R, et al. 2015. Prevalence of amyloid PET positivity in dementia syndromes: a meta-analysis. J. Am. Med. Assoc. 313, 1939–1949. ( 10.1001/jama.2015.4669) - DOI - PMC - PubMed

Publication types

Substances