. 2016 Jul 5:6:29035.
doi: 10.1038/srep29035.

In vivo label-free measurement of lymph flow velocity and volumetric flow rates using Doppler optical coherence tomography

Affiliations

In vivo label-free measurement of lymph flow velocity and volumetric flow rates using Doppler optical coherence tomography

Cedric Blatter et al. Sci Rep. .

Abstract

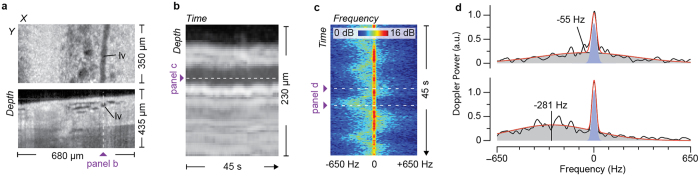
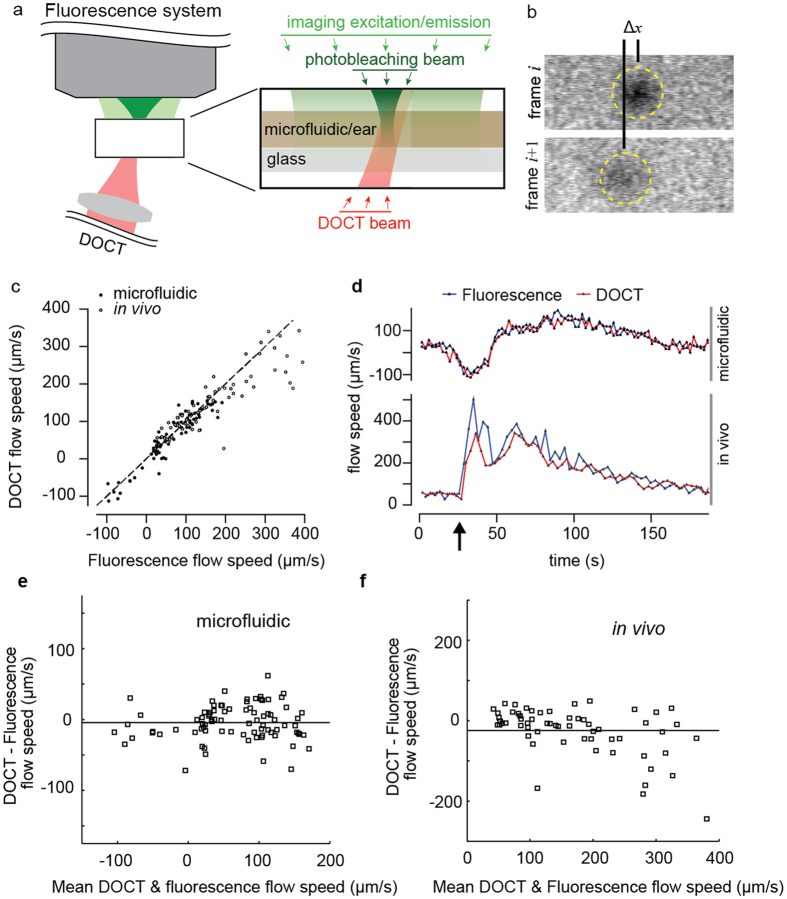
Direct in vivo imaging of lymph flow is key to understanding lymphatic system function in normal and disease states. Optical microscopy techniques provide the resolution required for these measurements, but existing optical techniques for measuring lymph flow require complex protocols and provide limited temporal resolution. Here, we describe a Doppler optical coherence tomography platform that allows direct, label-free quantification of lymph velocity and volumetric flow rates. We overcome the challenge of very low scattering by employing a Doppler algorithm that operates on low signal-to-noise measurements. We show that this technique can measure lymph velocity at sufficiently high temporal resolution to resolve the dynamic pulsatile flow in collecting lymphatic vessels.


Figures

Figure 1
Figure 1. Illustration of the method to measure lymphatic flow velocity with DOCT under low SNR settings and in the presence of artifacts from neighboring static tissue signals.
(a) Three-dimensional OCT datasets viewed in en face (upper panel) and cross sectional (lower panel) presentations are used to identify lymphatic vessels and select the location for flow measurement. (b) The depth-resolved OCT signal at a fixed transverse (x,y) location is recorded for five minutes and used to generate an M-Mode intensity image to identify the lymphatic vessel upper and lower boundaries. Depths within the lymphatic vessel are analyzed using Doppler methods. (c) A spectrogram is obtained for each depth, here shown for the depth indicated by the dashed line in (b). (d) Spectra showing the static and lymph signals at times of small (upper panel, −55 Hz) and moderate (lower panel, −281 Hz) Doppler shifts. Each spectral curve (black trace) within the spectrogram (panel c) is fit to a parametric model comprising two Gaussians and a white noise background (red trace). One Gaussian represents the static component and is centered at 0 Hz (blue peak). The second Gaussian represents the component due to lymph flow and is a broad distribution centered on the Doppler frequency (grey peak). The sign of the Doppler frequency shift denotes the direction of flow relative to the imaging beam.
Figure 2
Figure 2. Comparison of DOCT and fluorescence photobleaching measurements of lymph proxy flow in microfluidic phantoms and in vivo.
(a) Schematic of the experimental setup showing fluorescence widefield illumination (light green), focused and pulsed illumination for photobleaching (dark green) and DOCT (red). (b) Two cropped fluorescence frames taken from the video sequence acquired immediately after creation of a photobleached spot (in a microfluidic phantom). The translation of the spot is used to calculate flow velocity. (c) Comparison of simultaneous DOCT and fluorescence based flow velocity measurements in the microfluidic phantom and mouse ear. (d) The time-resolved velocity measurements from DOCT and fluorescence modalities in the microfluidic and in vivo experiments. Note that the larger discrepancies between the modalities in the in vivo measurements occur from 25 seconds to 65 seconds, immediately after creation of the flow bolus (arrow) when flow velocity is changing rapidly. (e,f) Bland-Altman plots, displaying the difference between DOCT and fluorescence flow measurements compared to the mean flow speed, show agreement between the two modalities in the microfluidic and in vivo experiments respectively.
Figure 3
Figure 3. M-Mode DOCT measurement of pulsatile lymph flow velocity.
(a) Depth and time-resolved flow velocity in the lymphatic vessel lumen overlaid on the M-Mode intensity image. The measurement location is highlighted in Fig. 1(a). The positive velocity indicates flow proximally toward the body. The animal leg was lying lower than the abdomen. The flow direction was therefore against gravity. A velocity time trace was calculated by averaging the flow velocity in the vessel over the lymphatic vessel (LV) depth. The maximum amplitude of this velocity is smaller than in the image above because of this depth averaging. (b) An M-Mode measurement showing periods of backflow. (c) A measurement in another animal showing an oscillatory flow velocity at relatively higher frequency than pulsatile flow exemplified by panel (a). (d) The average pulse interval for 10 animals showing pronounced pulsatile flow dynamics. The box plot for each animal includes data obtained over multiple five minute duration measurements. The mean pulse interval is 19.8 seconds and is much longer than respiratory or cardiac cycles. (e) The mean flow velocity in the same animals as in (d) calculated as the average over individual five minute measurements. formula image 
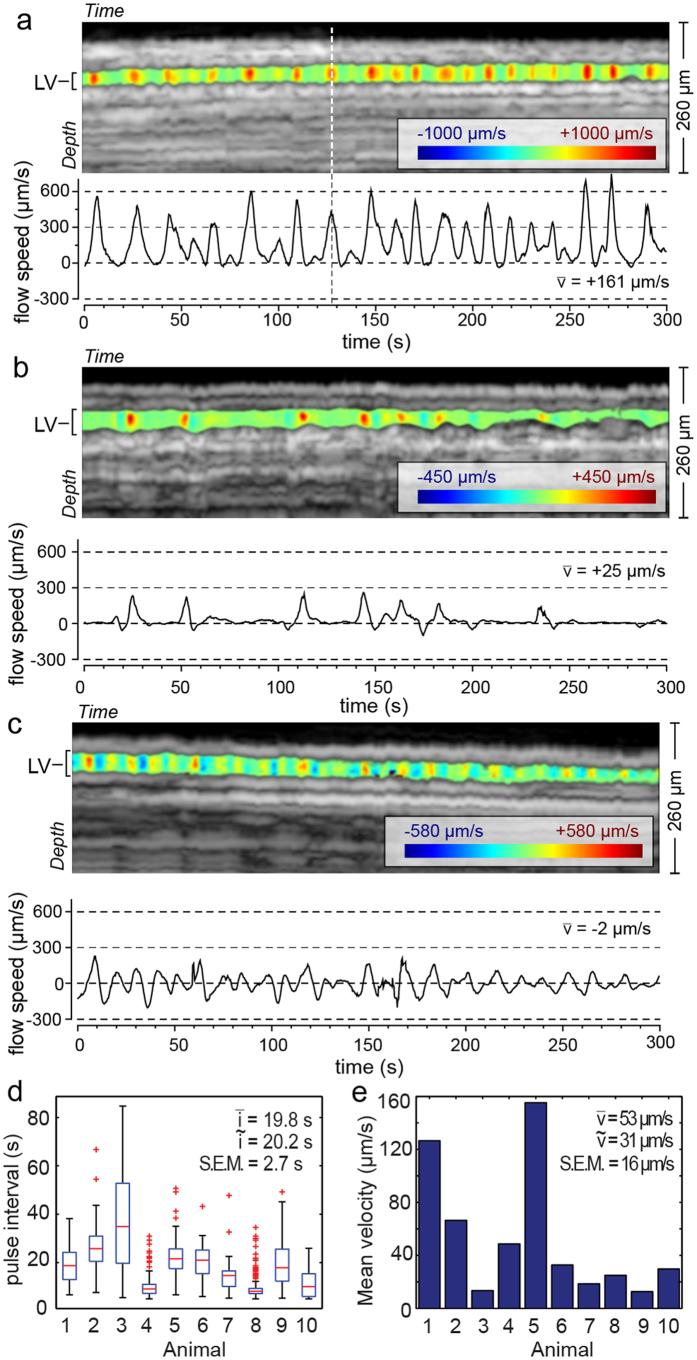
and S.E.M. denote mean, median and standard error of the mean respectively.
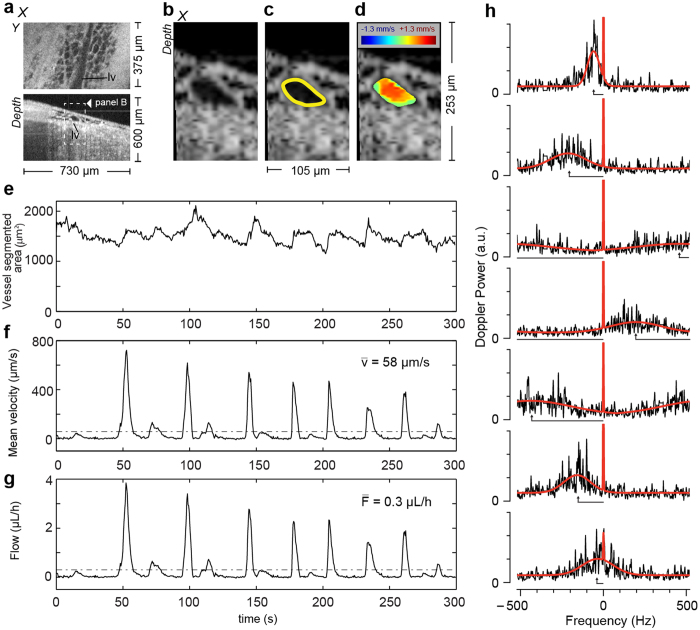
Figure 4
Figure 4. B-Mode DOCT measurement of spatially and temporally resolved lymph flow velocity, vessel cross-sectional area and volumetric flow rates.
(a) Three-dimensional OCT datasets viewed in en face (upper panel, lv: lymphatic vessel) and cross-sectional (lower panel) presentations are used to identify lymphatic vessels and select the flow measurement cross-section. Representative image of the time series (Supplementary Video 1) showing the vessel cross-section (b), its segmentation result (c), yellow curve) and the calculated flow velocity spatial distribution (d). The velocity image was filtered with a two dimensional median filter and unwrapped. (e) The segmented cross-sectional area of the lymphatic vessel is reported over the five minutes measurement. (f) The mean velocity calculated over the vessel cross-sectional area is reported with its mean value indicated by the dashed line. (g) The lymphatic volumetric flow is calculated as the product of the cross-sectional area and the mean velocity (methods). The velocity measurement resolves the pulsatile flow, similar to previous measurements. Interestingly, the vessel cross-section profile shows changes in accordance with the flow pulses. (h) Seven spectra (black line) at a particular spatial location in the vessel during a flow pulse show high velocity frequency components being wrapped, i.e. appearing on the right side of the frequency scale. The fitting model in red operates on a circular coordinate system. The length of the black arrow pointing to the center of the broad Gaussian indicates the value of the frequency/velocity estimator after unwrapping.

References

    1. Pereira E. R., Jones D., Jung K. & Padera T. P. The lymph node microenvironment and its role in the progression of metastatic cancer. Semin. Cell. Dev. Biol. 38, 98–105 (2015). - PMC - PubMed
    1. Mortimer P. S. & Rockson S. G. New developments in clinical aspects of lymphatic disease. J. Clin. Invest. 124, 915–921 (2014). - PMC - PubMed
    1. Kesler C. T., Liao S., Munn L. L. & Padera T. P. Lymphatic vessels in health and disease. WIREs Syst. Biol. Med. 5, 111–124 (2013). - PMC - PubMed
    1. Padera, et al.. “Lymphatic Metastasis in the Absence of Functional Intratumor Lymphatics,” Science 296, 1883–1886 (2002). - PubMed
    1. Sharma R. et al.. Quantitative imaging of lymph function. Am. J. Physiol. Heart Circ. Physiol. 292, 3109–3118 (2007). - PubMed

Publication types

LinkOut - more resources