

Editorial
doi: 10.1002/jnr.23785.
Epub 2016 Jul 5.
Transparent reporting for reproducible science
Affiliations
- PMID: 27377972
- PMCID: PMC5330667
- DOI: 10.1002/jnr.23785
Item in Clipboard
Editorial
Transparent reporting for reproducible science
J Neurosci Res.
2016 Oct.
No abstract available
Figures
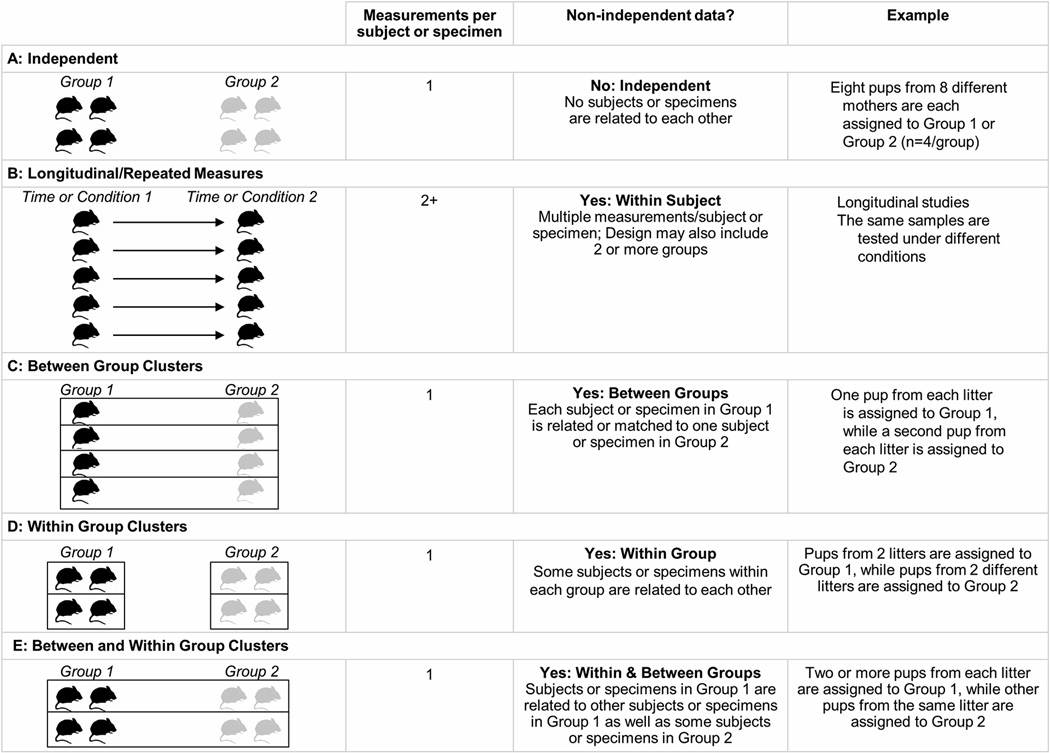
The figure illustrates study designs for independent (A), longitudinal or repeated measures (Panel B), Between group clustered (C), within group clustered (D) and between and within group clustered (E) designs.
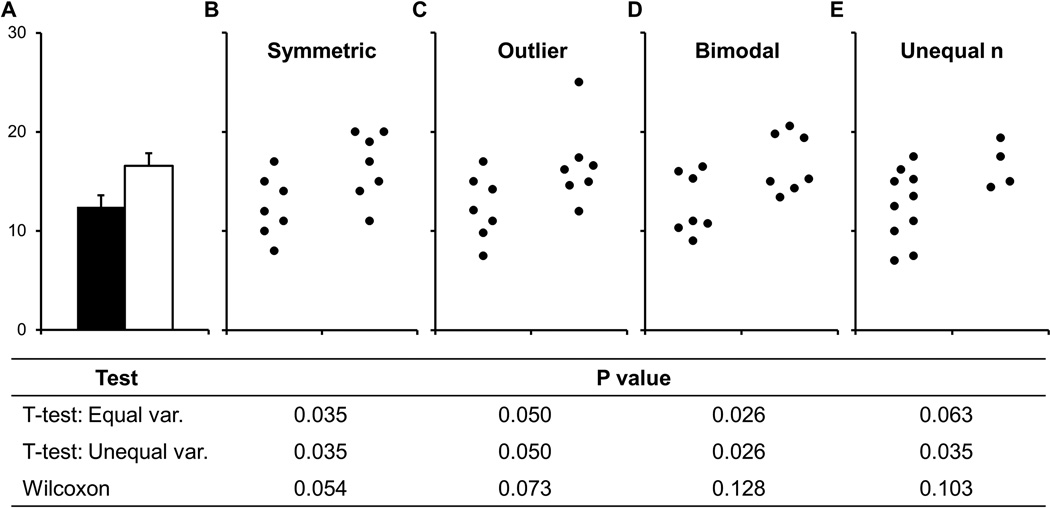
The full data may suggest different conclusions from the summary statistics. The means and standard errors for the four example datasets show in Panels B-E are all within 0.5 units of the means and standard errors shown in the bar graph (A). P-values were calculated in R statistical software (version 3.0.3) using an unpaired t-test, an unpaired t-test with Welch’s correction for unequal variances or a Wilcoxon rank sum test. In Panel B, the distribution in both groups appears symmetric. Although the data suggest a small difference between groups, there is substantial overlap between groups. In Panel C, the apparent difference between groups is driven by an outlier. Panel D suggests a possible bimodal distribution. Additional data are needed to confirm that the distribution is bimodal and to determine whether this effect is explained by a covariate. In Panel E, the smaller range of values for group 2 may simply be due to the fact that there are only three observations. Additional data for group 2 would be needed to determine whether the groups are actually different. Abbreviations: var, variance. Reprinted from Weissgerber et al. 2015 under a creative commons license.
References
-
- Reproducing our irreproducibility. Nature. 2013;496:398.
-
- Take the long view. Nat Med. 2016;22(1):1. - PubMed
-
- Ashander J. Easy alternatives to bar charts in native R graphics, Rapid evolution: Theory, computation and inference. 2015 Apr 28; 2015. http://www.ashander.info/posts/2015/04/barchart-alternatives-in-base-r/
Publication types
MeSH terms
Grants and funding
LinkOut - more resources
Full Text Sources
Other Literature Sources
