. 2017 Jun;22(6):820-835.
doi: 10.1038/mp.2016.95. Epub 2016 Jul 5.

Altered proliferation and networks in neural cells derived from idiopathic autistic individuals

Affiliations

Altered proliferation and networks in neural cells derived from idiopathic autistic individuals

Maria C Marchetto et al. Mol Psychiatry. 2017 Jun.

Abstract

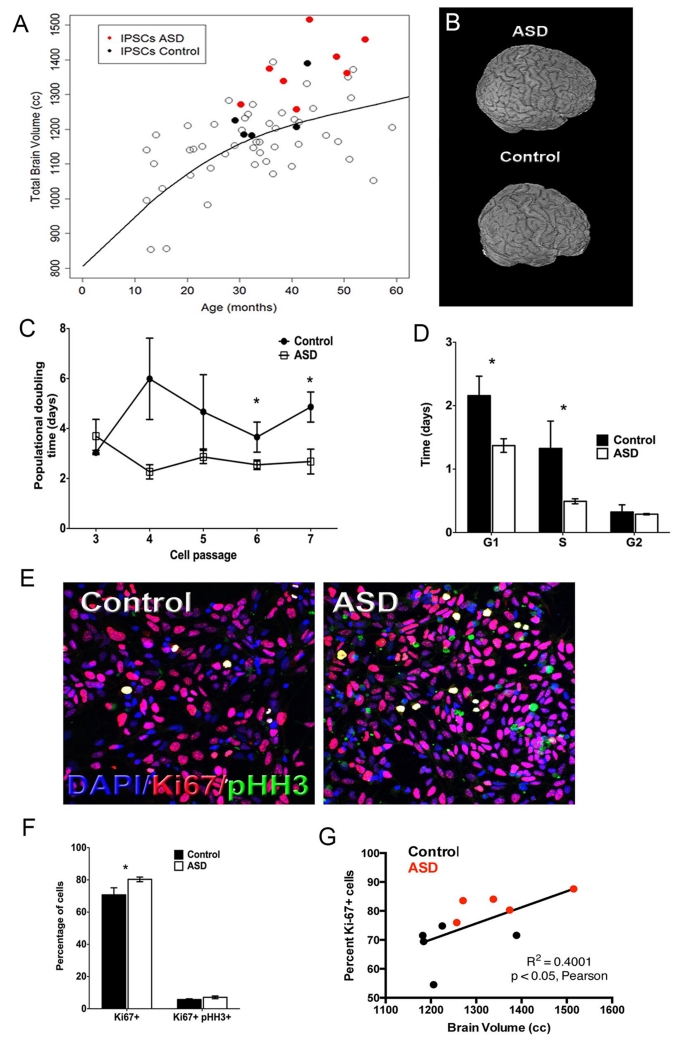
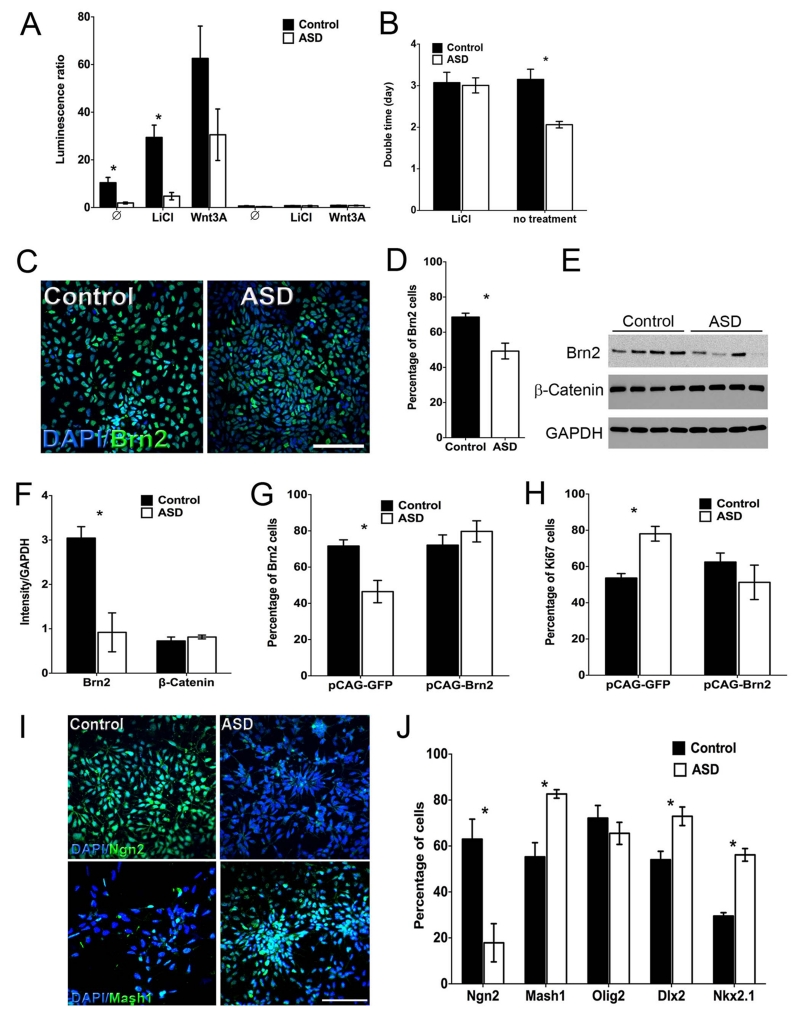
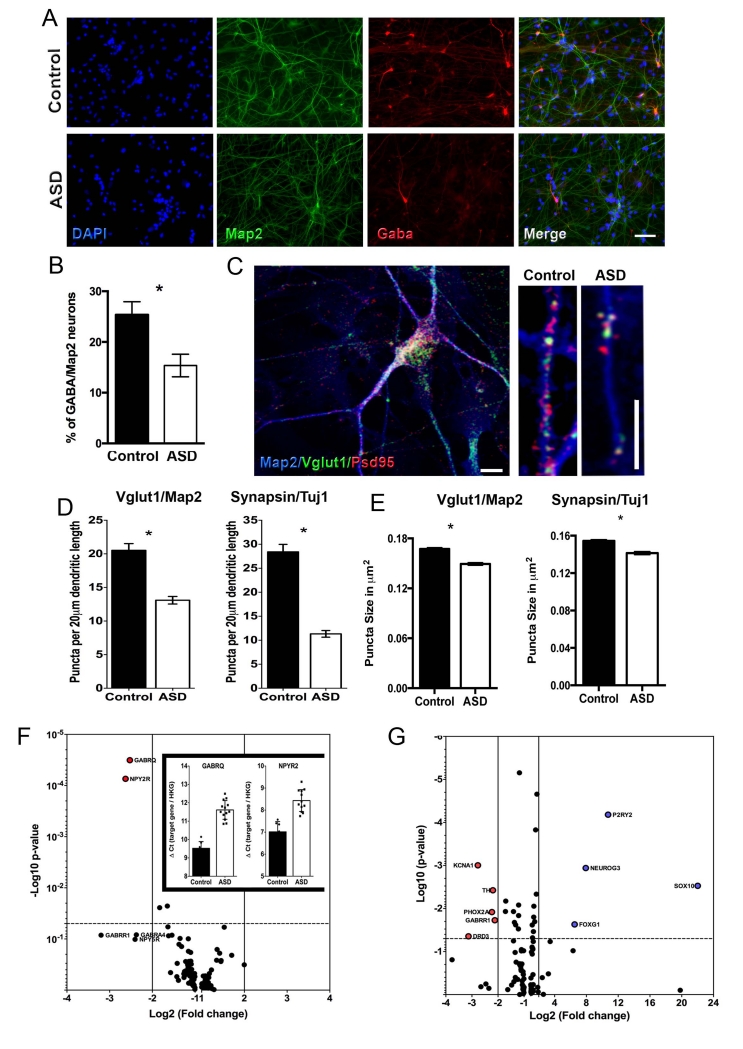
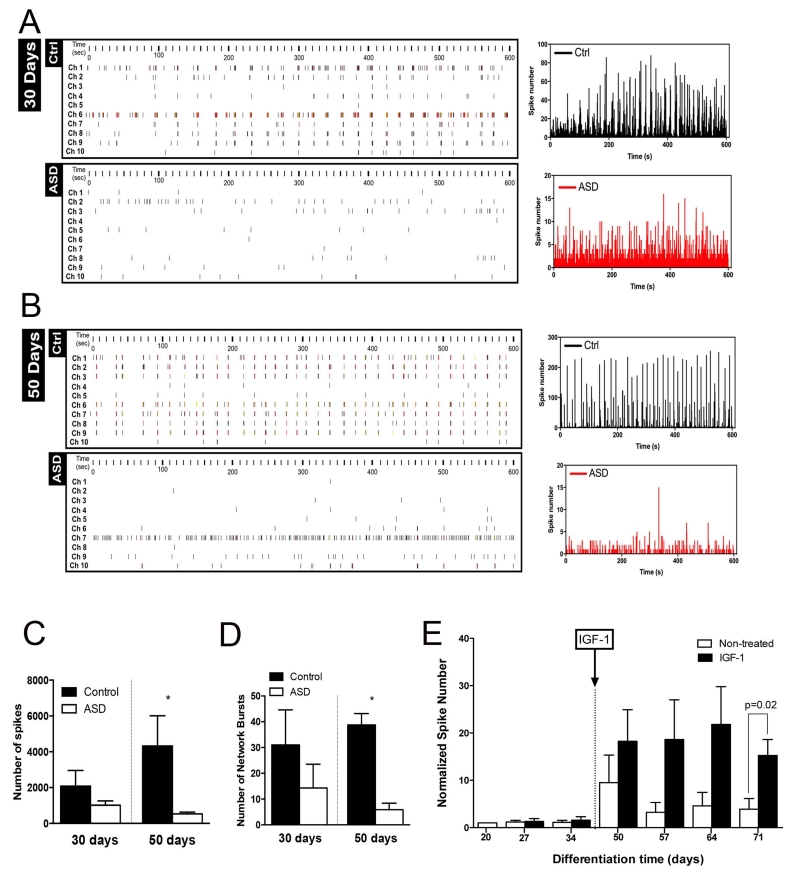
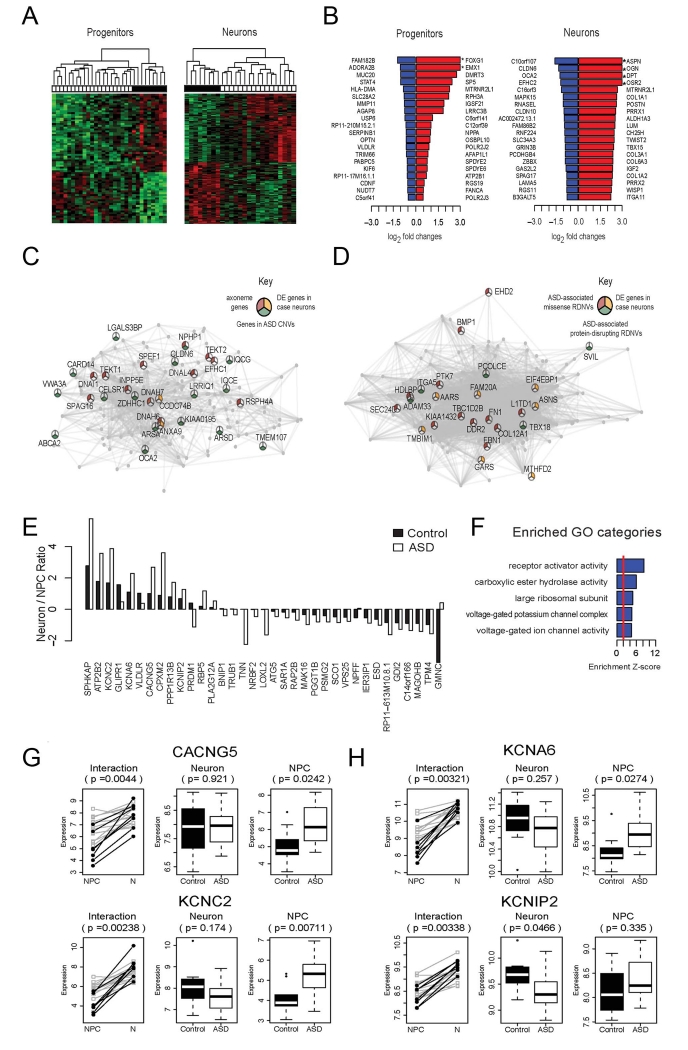
Autism spectrum disorders (ASD) are common, complex and heterogeneous neurodevelopmental disorders. Cellular and molecular mechanisms responsible for ASD pathogenesis have been proposed based on genetic studies, brain pathology and imaging, but a major impediment to testing ASD hypotheses is the lack of human cell models. Here, we reprogrammed fibroblasts to generate induced pluripotent stem cells, neural progenitor cells (NPCs) and neurons from ASD individuals with early brain overgrowth and non-ASD controls with normal brain size. ASD-derived NPCs display increased cell proliferation because of dysregulation of a β-catenin/BRN2 transcriptional cascade. ASD-derived neurons display abnormal neurogenesis and reduced synaptogenesis leading to functional defects in neuronal networks. Interestingly, defects in neuronal networks could be rescued by insulin growth factor 1 (IGF-1), a drug that is currently in clinical trials for ASD. This work demonstrates that selection of ASD subjects based on endophenotypes unraveled biologically relevant pathway disruption and revealed a potential cellular mechanism for the therapeutic effect of IGF-1.


Figures

Figure 1
Figure 1
Altered ASD iPSC-derived NPCs proliferation. (A) Left panel, scatterplot of Total Brain Volume (TBV) across ages. Open black circles indicate brain size of typically developing subjects. Black solid dots represent control donors. Red solid dots represent ASD donors. (B) Three-dimensional reconstructions of the brain from one control donor and one ASD donor. (C) iPSCs from ASD and control were differentiated to NPCs. From passages 2 to 6 cells were plated at the same density and population-doubling time at each passage was calculated. Results of all lines (2 clones per line) are presented as mean ± SEM (*repeated measurements p=0.02, post-hoc p<0.04). (D) Adherent monolayer NPCs from control and ASD iPSCs were dissociated, counted for calculation of population doubling time and prepared for cell cycle analysis. Results are presented as the time spent in each cell cycle stage (n≥4, mean ± SEM, ANOVA p<0.04, post-hoc p<0.04 for comparing the time spent in G1 phase in the ASD NPCs with those of the control NPCs, respectively). (E) Control and ASD NPCs were immunostained with DAPI (Blue), anti-pHH3 (Green) and anti-ki67 (Red) (Scale bar: 200 μm). Representative images of the staining are shown. (F) Quantification of the percentage of Ki67+ and Ki67+pHH3+ labeled cells are presented as mean ± SEM (n≥5; *p<0.03 for comparing the results of the ASD with those of the control NPCs). (G) Pairwise correlation between individual brain size (volume) and respective NPC cell line proliferation rates (% of Ki67 positive cells).
Figure 2
Figure 2
Regulation of NPC proliferation by the Wnt pathway and differential expression of early fate determinants. (A) Control and ASD NPCs were transfected with TOP-Flash and firefly renilla reporters and treated with either 5 mM LiCl or 100 ng/ml Wnt3A. Results are presented as mean ± SEM (n≥5, *p<0.04 for comparing the luminescence ratio in the ASD NPCs with those of the control NPCs). (B) Doubling time of control and ASD NPCs, treated or not with 5 mM LiCl. Results are presented as mean ± SEM (n≥5, ANOVA<0.05 *p<0.05 for comparing the ASD NPCs doubling time with control NPCs). (C) Control and ASD NPCs were fixed and immunostained for Brn2 and representative images of the staining are shown (Scale bar: 200 μm). (D) Quantification of the percentage of Brn2+-labeled cells is presented as mean±SEM (n≥5; *p<0.001 for comparing the results of the ASD with those of the control NPCs). (E) Representative immunoblot of control and ASD-derived NPCs that were lysed and immunoblot for Brn2, β-catenin and GAPDH. (F) The levels of Brn2 and β-catenin, which were normalized to GAPDH levels were quantified and results are presented as mean ± SEM (n≥5; *p<0.03 for comparing the results of the ASD with those of the control NPCs). (G) The percentage of Brn2+ and (H) Ki67+ cells were measured. Results are presented as mean ± SEM (n≥4, ANOVA<0.02 *p<0.05, comparing the results of the GFP-transfected ASD NPCs with those of the control and the Brn2 transfected ASD NPCs). (I) Representative images of the control and ASD NPCs immunostained for Ngn2 and Mash1. (Scale bar: 200um) (G) Quantification of the percentage of Ngn2+, Mash1+, Olig2, Dlx2+ and Nkx2.1+ labeled cells is presented as mean ± SEM (n≥5; *p<0.03 for comparing the results of the ASD with those of the control NPCs).
Figure 3
Figure 3
Synaptic alterations in ASD neuronal networks. (A) Representative images of cells after neuronal differentiation. iPSC-derived neurons express a marker for inhibitory neurons, GABA. Bar = 20 μm. (B) The graph shows the quantification of GABA-positive neurons in all ASD-derived neurons compared to all controls (*p<0.001). (C) Representative images of cells after neuronal differentiation. iPSC-derived neurons express markers for excitatory neurons, such as postsynaptic density protein 95 (Psd95) and vesicular glutamate transporter 1 (VGlut1). (Scale bar: 5 μm) (D) Bar graphs show synaptic density and (E) synaptic puncta size in ASD and control neurons. (**p<0.001 for comparing the results of the ASD with those of the control neurons for (D) and *p<0.05 for (E)). (F and G) Volcano plots of qPCR array data. Plot illustrates differences in expression patterns of neurotransmitters receptor-related genes of iPSC-derived neurons from ASD (n = 13) and related controls (n = 7). The blue-gray plots represent more than or equal to 2.0-fold differentially expressed genes between the groups at P<0.05 (unpaired two-sample Student’s t-test). Insert: Bar graphs show the distribution of ΔCt values (inverse to gene expression) of each individual for GABRQ and NYR2 genes in control and ASD.
Figure 4
Figure 4
Functional defects in ASD-derived neuronal networks shown by Multielectrode array activity (MEA). Representative spike raster plots of 10 channels from one well plated with control and ASD cultures over (A) 30 days and (B) 50 days. XY graphs on the left show overlay of a representative generated from the raw data of a spike raster plot, using the number of spikes recorded over 10 minutes at 30 days and 50 days of culture maturation (n=3 wells per cell type). (C) Total number of spikes from data obtained from controls (n=6) and ASD (n=10) clonal lines differentiating over 30 days and controls (n=4) and ASD (n=9) clonal lines at 50 days after differentiation over 10 minutes of recording. Results are presented as mean ± SEM (*p=0.0046 for comparing the results of the ASD with control networks). (D) Number of network bursts from wells that were able to generate bursts (10 spikes over 100 ms). Results are presented as mean ± SEM (*p<0.0001 for comparing the results of the ASD with control networks). (E) ASD neuronal cultures were treated with IGF1 as indicated in the graph (arrow) and was kept in the cultures for the duration of the experiment.
Figure 5
Figure 5
Gene expression changes in neurons and NPCs derived from idiopathic ASD Individuals with macrencephaly. (A) Hierarchical clustering using the differentially expressed (DE) genes identified in NPCs (left) and neurons (right). The heatmap shows color-coded scaled expression values, up-regulation in red and down-regulation in green. Each column represents a line from an iPSC clone. The horizontal bar on the top shows disease status: white cell lines are derived from ASD cases, and black represents cell lines from controls. (B) Log2 transformed fold changes of the top 20 down-regulated (blue) and top 20 up-regulated (red) genes in patient neural progenitors (left) and neurons (right) as compared to controls. Genes highlighted with * have log2 fold change > 3. (C) Visualization of the top connections in the brown module, which is down-regulated in ASD neurons. Genes are connected if their pairwise correlation is larger than 0.8. Pie chart: genes in GO category “axoneme” (red); genes in ASD CNVs (yellow); differentially expressed genes (p<0.005)(green). (D) Visualization of the top connections in the tan module, which shows up-regulation in ASD neurons. Genes are connected if their pairwise correlation is larger than 0.8. Pie chart: genes that are previously identified to be affected by ASD-associated missense (red) and protein disrupting (green) rare de novo variation (RDNVs), and differentially expressed genes (p<0.005) (yellow). (E) Barplot showing the ratios of neuronal/progenitor expression of the DE genes in the progenitor to neuron transition. Black bars represent the ratios in control samples, and white bars represent the ratios in ASD samples. (F) The top 5 enriched GO categories among the genes showing differentiation-dependent expression changes in ASD Individuals vs. controls. (G and H) Dynamic expression patterns (log2 transformed read counts) of the genes that show significant differentiation-dependent expression alterations during neuronal differentiation (p<0.005) and that are in the GO category “voltage gated ion channel activity.” White: cell samples derived from ASD individuals; black: cell samples from controls. P-value in the interaction plot shows the significance of the interaction effect between cell type and disease status. P-values in the neuronal and progenitor plots represent the significance of the difference between ASD cases vs. controls.

References

    1. Piven J, Palmer P, Jacobi D, Childress D, Arndt S. Broader autism phenotype: evidence from a family history study of multiple-incidence autism families. The American journal of psychiatry. 1997;154(2):185–190. - PubMed
    1. Ronald A, Happe F, Bolton P, Butcher LM, Price TS, Wheelwright S, et al. Genetic heterogeneity between the three components of the autism spectrum: a twin study. J Am Acad Child Adolesc Psychiatry. 2006;45(6):691–699. - PubMed
    1. Garber K. Neuroscience. Autism’s cause may reside in abnormalities at the synapse. Science. 2007;317(5835):190–191. - PubMed
    1. Marchetto MC, Carromeu C, Acab A, Yu D, Yeo GW, Mu Y, et al. A model for neural development and treatment of Rett syndrome using human induced pluripotent stem cells. Cell. 2010;143(4):527–539. - PMC - PubMed
    1. Sanders SJ, Murtha MT, Gupta AR, Murdoch JD, Raubeson MJ, Willsey AJ, et al. De novo mutations revealed by whole-exome sequencing are strongly associated with autism. Nature. 2012;485(7397):237–241. - PMC - PubMed

Publication types

MeSH terms