. 2016 Jul 5;17(1):147.
doi: 10.1186/s13059-016-1014-0.

The mRNA-bound proteome of the human malaria parasite Plasmodium falciparum

Affiliations

The mRNA-bound proteome of the human malaria parasite Plasmodium falciparum

Evelien M Bunnik et al. Genome Biol. .

Abstract

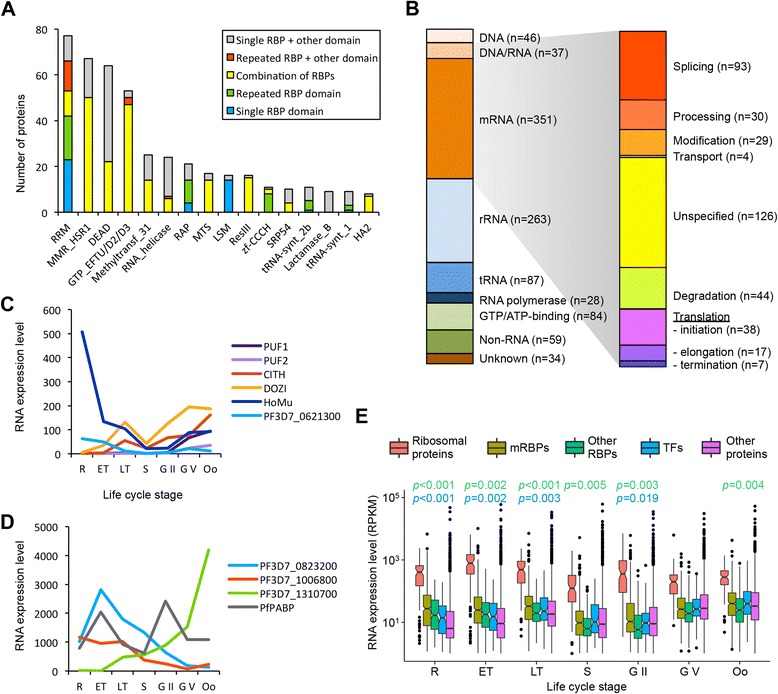
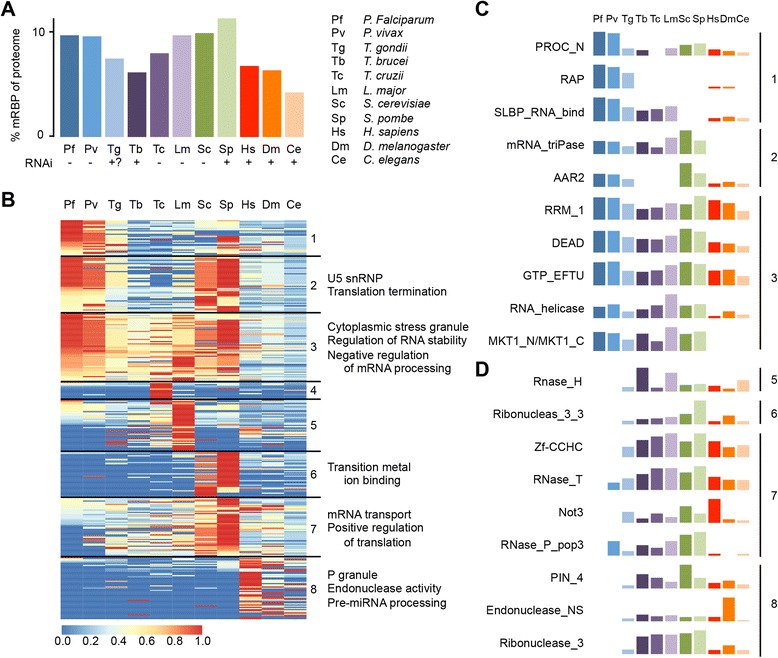
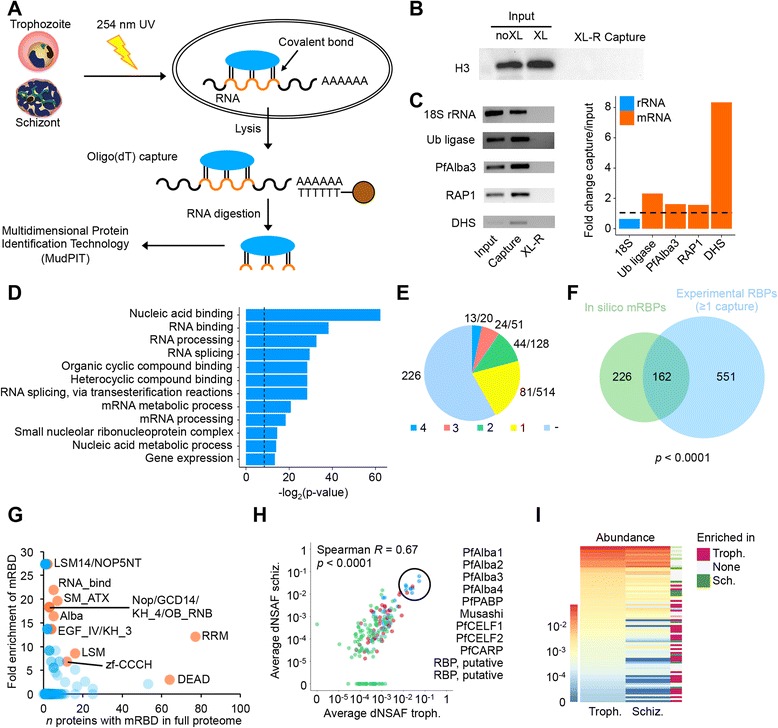
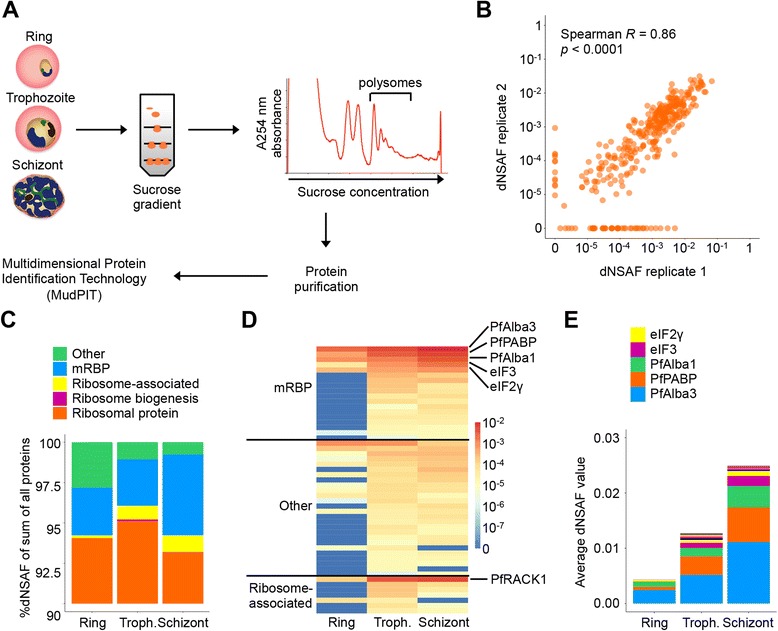
Background: Gene expression is controlled at multiple levels, including transcription, stability, translation, and degradation. Over the years, it has become apparent that Plasmodium falciparum exerts limited transcriptional control of gene expression, while at least part of Plasmodium's genome is controlled by post-transcriptional mechanisms. To generate insights into the mechanisms that regulate gene expression at the post-transcriptional level, we undertook complementary computational, comparative genomics, and experimental approaches to identify and characterize mRNA-binding proteins (mRBPs) in P. falciparum.

Results: Close to 1000 RNA-binding proteins are identified by hidden Markov model searches, of which mRBPs encompass a relatively large proportion of the parasite proteome as compared to other eukaryotes. Several abundant mRNA-binding domains are enriched in apicomplexan parasites, while strong depletion of mRNA-binding domains involved in RNA degradation is observed. Next, we experimentally capture 199 proteins that interact with mRNA during the blood stages, 64 of which with high confidence. These captured mRBPs show a significant overlap with the in silico identified candidate RBPs (p < 0.0001). Among the experimentally validated mRBPs are many known translational regulators active in other stages of the parasite's life cycle, such as DOZI, CITH, PfCELF2, Musashi, and PfAlba1-4. Finally, we also detect several proteins with an RNA-binding domain abundant in Apicomplexans (RAP domain) that is almost exclusively found in apicomplexan parasites.

Conclusions: Collectively, our results provide the most complete comparative genomics and experimental analysis of mRBPs in P. falciparum. A better understanding of these regulatory proteins will not only give insight into the intricate parasite life cycle but may also provide targets for novel therapeutic strategies.

Keywords: Gene expression; Post-transcriptional regulation; Protein domains; RNA-binding proteins; Translation.


Figures

Fig. 1
Fig. 1
Overview of RNA-binding proteins in P. falciparum. a Characterization of RNA-binding domains (RBDs) that were found in eight or more proteins. b Classification of proteins containing one or more of 793 different RBDs based on the type of molecule that they most likely interact with, using information from existing annotations, functions of homologs in other species, and the nature of the RBD. Proteins that are known or predicted to interact with mRNA were further categorized into functional groups. c Steady-state mRNA expression levels of several RNA-binding proteins (RBPs) known to be involved in post-transcriptional regulation during the transmission stages. Expression data were obtained from PlasmoDB [34]. d Steady-state mRNA expression levels of three putative RBPs during the asexual and sexual erythrocytic stages and the mosquito ookinete stage. The expression level of polyA-binding protein (PABP), which is ubiquitously present in the cell, is plotted as a reference. e Comparison of expression levels of mRNA-binding proteins to other classes of proteins during different stages of the parasite’s life cycle. Statistically significant differences in average expression levels between mRBPs and other RBPs or transcription factors are indicated by a p value in green or blue, respectively, at the top of the plot (Welch’s t test). R ring, ET early trophozoite, LT late trophozoite, S schizont, G II stage II (early) gametocytes, G V stage V (late) gametocytes, Oo ookinete
Fig. 2
Fig. 2
Relative abundance of mRNA-binding domains in P. falciparum in comparison to other eukaryotes. a Percentage of proteins in the full proteome that contain an mRNA-binding domain (mRBD). Abbreviations are listed on the right. The presence (+) or absence (–) of RNA interference machinery is indicated at the bottom. b k-means clustering of mRBDs based on relative abundance among all 11 organisms. The mRBD frequency in an organism was first normalized by proteome size and then scaled to the mRBD frequency in the organism with the highest relative abundance of that mRBD, which was given an arbitrary abundance value of 1. For clusters with unique enriched Gene Ontology (GO) terms associated with the Pfam domains (false discovery rate, FDR <0.01), a subset of these terms is shown on the right. See Additional file 4 for the full data set. c Selection of mRBDs that are relatively enriched in P. falciparum as compared to all or select groups of other eukaryotes. The cluster that these mRBDs fall into is indicated on the right. d Selection of mRBDs that are relatively depleted in P. falciparum as compared to all or select groups of other eukaryotes
Fig. 3
Fig. 3
Capturing the mRNA interactome of P. falciparum. a Schematic overview of the experimental procedure, described in detail in the Methods section. b Non-RNA-interacting protein histone H3 is not detected in the capture sample, indicating that the capture methodology results in depletion of proteins that do not interact with poly-adenylated RNA. c Depletion of 18S ribosomal RNA and enrichment of mRNA transcripts in the capture sample, indicating that our approach to capture of poly-adenylated RNA is successful. No RNA was detected in the RNase-digested sample. d Selection of most highly enriched GO terms among the 199 proteins that were captured in two or more experiments. The vertical dashed line indicates a p value of 0.01. e Fraction of candidate RBPs identified by HMM search that were experimentally captured in one, two, three, or four individual experiments. The numbers to the right of the chart indicate the number of proteins with an RBD out of the total number of proteins captured experimentally. f Overlap between the mRBPs identified by HMM search (n = 388) and RBPs captured in one or more experiment (n = 713). The overlap between these two groups of proteins was assessed using the hypergeometric test. g Fold enrichment of RNA-binding domains in captured proteins as compared to the full proteome. mRBDs that are enriched among the mRNA interactome are indicated in orange (p < 0.05, FDR <5 %, hypergeometric test), while non-enriched and depleted mRBDs are shown in blue. h Correlation in abundance between 199 proteins captured at the trophozoite and schizont stages. Proteins are color-coded according to the number of experiments in which they were detected: in two (green), three (magenta), or four (blue) experiments. Highly abundant proteins are encircled and are listed on the right. i Average normalized spectral abundance factor (dNSAF) values of proteins captured at the trophozoite and schizont stages. Proteins absent at a particular stage are indicated in dark blue. The bar on the right indicates the stage at which a higher enrichment of the protein was observed
Fig. 4
Fig. 4
Identification of proteins associated with polysomes at the ring, trophozoite, and schizont stages of P. falciparum. a Schematic overview of the experimental procedure, described in detail in the Methods section. b Correlation in protein abundance between replicate experiments. c Relative frequencies of functional protein groups detected in polysome fractions. d Average normalized abundance (dNSAF values) of non-ribosomal proteins detected in polysome fractions at the main three IDC stages. Values are the average of two replicates. e Average normalized abundance of mRBDs at the different IDC stages

References

    1. WHO. The World Malaria Report. 2015. http://www.who.int/malaria/publications/world-malaria-report-2015/report....
    1. Ashley EA, Dhorda M, Fairhurst RM, Amaratunga C, Lim P, Suon S, Sreng S, Anderson JM, Mao S, Sam B, et al. Spread of artemisinin resistance in Plasmodium falciparum malaria. N Engl J Med. 2014;371:411–23. - PMC - PubMed
    1. Takala-Harrison S, Jacob CG, Arze C, Cummings MP, Silva JC, Dondorp AM, Fukuda MM, Hien TT, Mayxay M, Noedl H, et al. Independent emergence of artemisinin resistance mutations among Plasmodium falciparum in Southeast Asia. J Infect Dis. 2015;211:670–9. - PMC - PubMed
    1. Gardner MJ, Hall N, Fung E, White O, Berriman M, Hyman RW, Carlton JM, Pain A, Nelson KE, Bowman S, et al. Genome sequence of the human malaria parasite Plasmodium falciparum. Nature. 2002;419:498–511. - PMC - PubMed
    1. Bozdech Z, Llinas M, Pulliam BL, Wong ED, Zhu J, DeRisi JL. The transcriptome of the intraerythrocytic developmental cycle of Plasmodium falciparum. PLoS Biol. 2003;1:E5. doi: 10.1371/journal.pbio.0000005. - DOI - PMC - PubMed

Publication types

MeSH terms