. 2016 Jul 6:7:12057.
doi: 10.1038/ncomms12057.

Signal transduction controls heterogeneous NF-κB dynamics and target gene expression through cytokine-specific refractory states

Affiliations

Signal transduction controls heterogeneous NF-κB dynamics and target gene expression through cytokine-specific refractory states

Antony Adamson et al. Nat Commun. .

Abstract

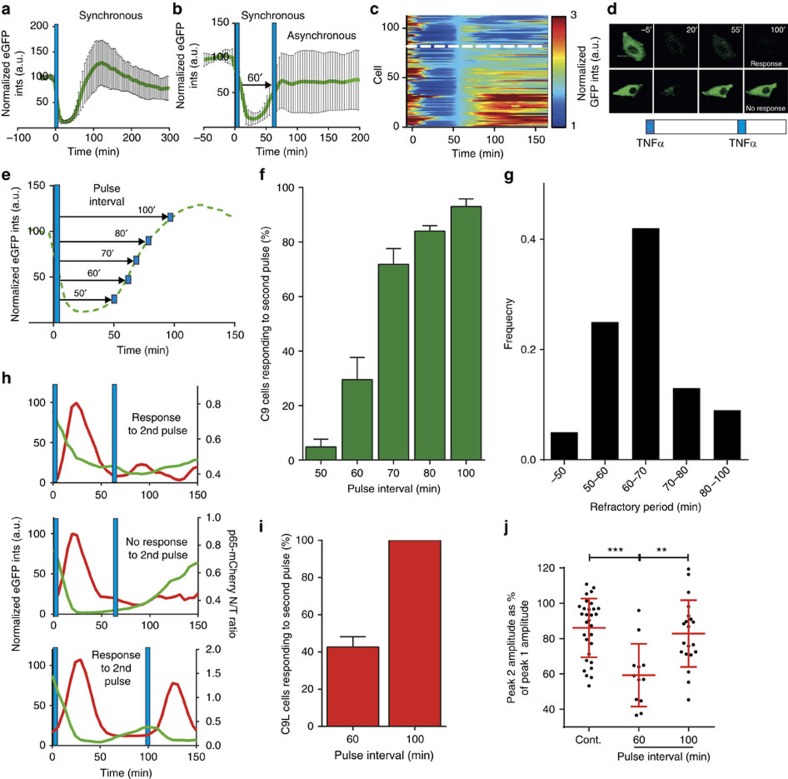
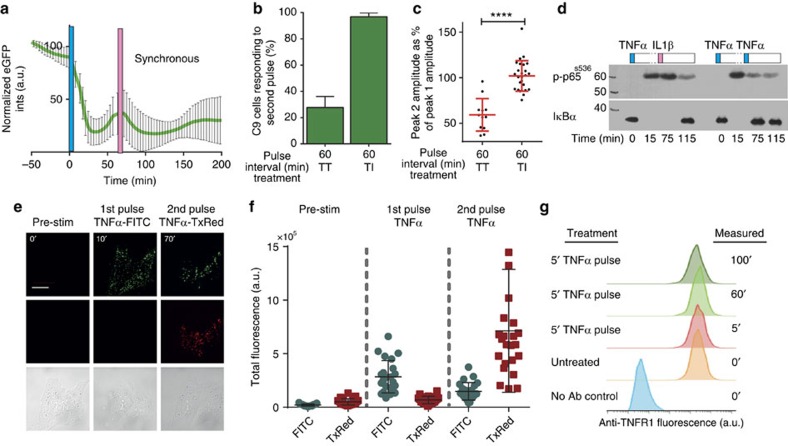
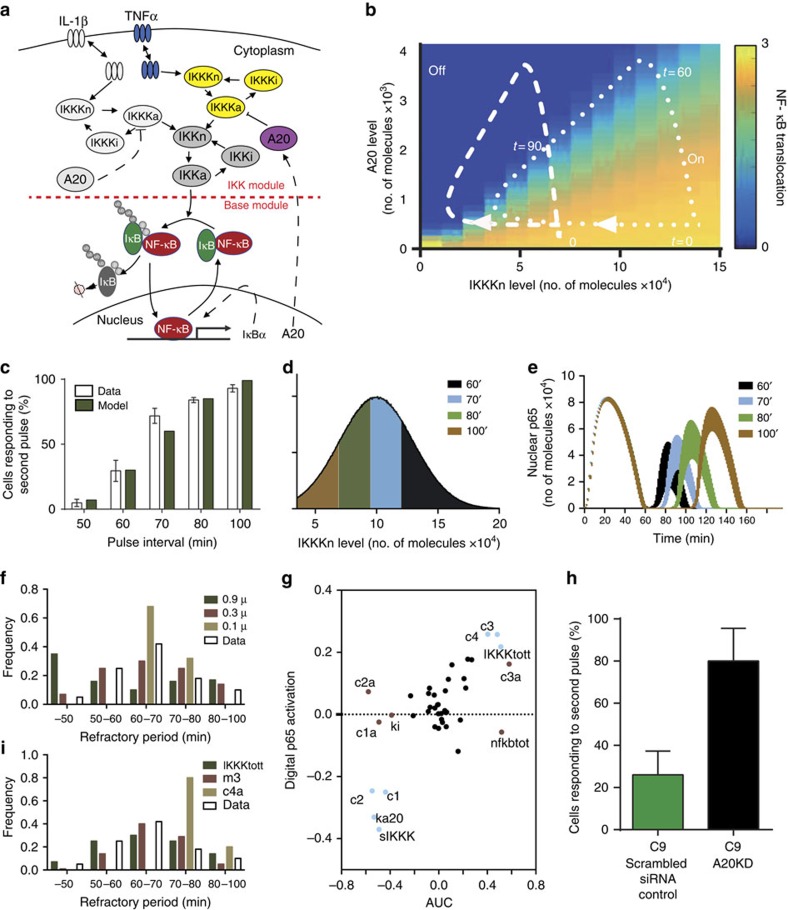
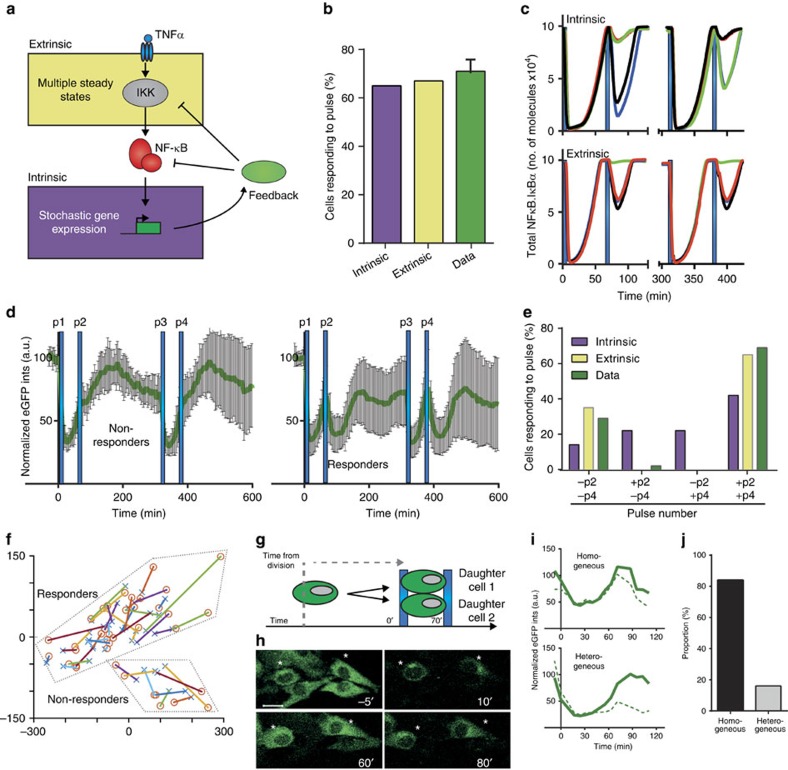
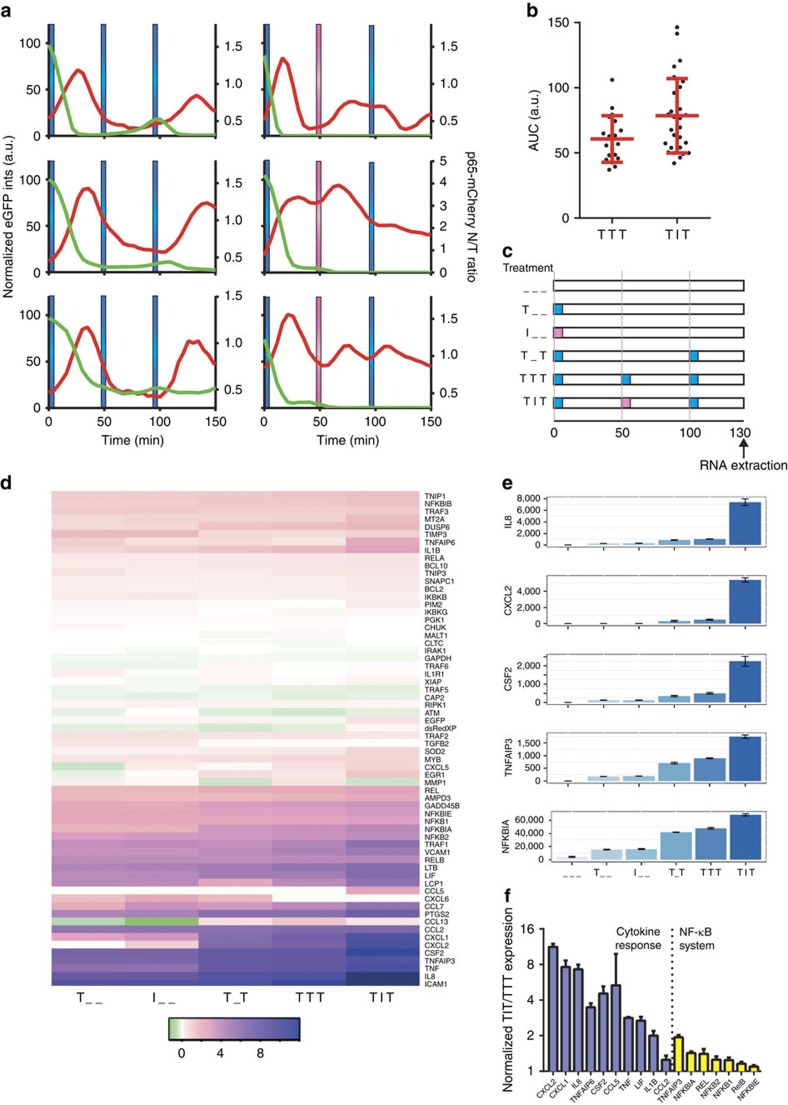
Cells respond dynamically to pulsatile cytokine stimulation. Here we report that single, or well-spaced pulses of TNFα (>100 min apart) give a high probability of NF-κB activation. However, fewer cells respond to shorter pulse intervals (<100 min) suggesting a heterogeneous refractory state. This refractory state is established in the signal transduction network downstream of TNFR and upstream of IKK, and depends on the level of the NF-κB system negative feedback protein A20. If a second pulse within the refractory phase is IL-1β instead of TNFα, all of the cells respond. This suggests a mechanism by which two cytokines can synergistically activate an inflammatory response. Gene expression analyses show strong correlation between the cellular dynamic response and NF-κB-dependent target gene activation. These data suggest that refractory states in the NF-κB system constitute an inherent design motif of the inflammatory response and we suggest that this may avoid harmful homogenous cellular activation.


Figures

Figure 1
Figure 1. IκBα levels oscillate out-of-phase with NF-κB p65 nuclear localization in response to TNFα and IL-1β stimulation.
(a) Schematics of IκBα-eGFP BAC and NF-κB p65-mCherry lentiviral constructs. (b) IκBα and NF-κB oscillations in response to continuous TNFα. Shown are confocal microscopy images of representative C9 (top panel) and C9L (bottom panel) single cells. IκBα-eGFP and p65-mCherry signal depicted in green and red colours, respectively. Time from stimulation depicted in minutes. Scale bar, 10 μm. (c) Representative traces of C9 (left panel) and C9L (right panel) cells stimulated with continuous TNFα or IL-1β, respectively. Shown are the normalized total IκBα-eGFP intensity (in green, with respect to 0 min) and the mean p65-mCherry nuclear to total (N/T) fluorescence ratio (in red). Time depicted in minutes. (d) Time to NF-κB activation in response to TNFα and IL-1β stimulation, respectively. Time to activation (T1) defined as the first trough of the total IκBα-GFP signal. Shown are individual C9 and C9L cell data (depicted with dots), with corresponding means (±s.d.), per condition (based on single-cell trajectories as in c). (e) The amplitude of the first NF-κB p65 translocation. The amplitude (P1) defined as the peak p65-mCherry N/T ratio of the first NF-κB nuclear translocation. Shown are individual C9 and C9L cell data, with corresponding means (±s.d.), per condition (based on single-cell trajectories as in c). (f) Timing of TNFα- and IL-1β-stimulated NF-κB oscillations. Shown are individual peak-to-peak timings for C9 and C9L cells, respectively, with corresponding mean (±s.d.) per condition. Peak-to-peak defined as the time between consecutive troughs in the total IκBα-eGFP signal. (g) Power spectrum analysis of the NF-κB oscillation period. Shown are power spectra calculated for three representative C9 cells (depicted with different colour) in response to TNFα based on the IκBα-eGFP trajectories (for times >35 min, Fig. 5). Peak in the power spectra indicates a dominant period in a cell. (h) Period of NF-κB oscillations in single cells. Shown are individual cell oscillation periods identified based on the power spectrum analysis as in g, for C9 cells stimulated with TNFα (data from f).
Figure 2
Figure 2. TNFα pulsing reveals a heterogeneous refractory period in the NF-κB system.
(a) Response to a single 5-min pulse of TNFα. Shown is the mean (in green) (±s.d.) of the normalized total IκBα-eGFP intensities in single C9 cells. Timing of TNFα stimulation represented with a blue bar. (b) Response to two 5 min TNFα pulses applied at 0 and 60 min. Shown is the mean (±s.d.) of the normalized total IκBα-eGFP intensity in single C9 cells. Timing of TNFα stimulation represented with blue bars. (c) Clustering analysis of single-cell data from b with respect to normalized total IκBα-eGFP single-cell intensities at the time of the second pulse. Broken line indicates responding (top) and non-responding (bottom) clusters. (d) Confocal images of representative non-responding (top) and responding (bottom) cells from c. The IκBα-eGFP signal shown in green colour. Scale bar, 10 μm. (e) Schematic representation of repeat pulsing: Two 5 min TNFα pulses applied at time intervals ranging from 50 to 100 min. Green dotted line represents a putative IκBα-GFP response to the first TNFα pulse. (f) Fraction of C9 cells responding at different TNFα pulse intervals. Single-cell responsiveness (means ±data range of at least two replicates) based on clustering analysis of normalized single-cell total IκBα-eGFP intensities (as in c). (g) Distribution of refractory periods based on data in f. (h) Representative C9L cells stimulated with TNFα pulses at 60 and 100 min intervals (as depicted with blue bars). Shown are normalized total IκBα-eGFP intensities (in green) and the nuclear to total (N/T) ratio of the p65-mCherry signal (in red). (i) Fraction of responding C9L cells at 60 and 100 min pulse interval. Shown is mean±data range per condition. (j) Amplitude of the second NF-κB translocation. Shown are C9L cell responses to continuous, as well as 5 min TNFα pulses at 60 and 100 min intervals, respectively, with mean ±s.d. of the second peak (P2) nuclear NF-κB p65-mCherry translocation amplitude, expressed as a fraction of the first-peak amplitude. Statistical difference assessed with a Student's t-test (**P value<0.01, ***P value<0.001).
Figure 3
Figure 3. The refractory period is controlled downstream of TNFR and upstream of IKK.
(a) Response to alternate TNFα and IL-1β pulses applied at 0 and 60 min Shown is the mean (±s.d.) of normalized total IκBα-GFP intensity in single C9 cells. Timing of TNFα (0 min) and IL-1β (60 min) stimulation represented with blue and pink bars, respectively. (b) Comparison between responses to two TNFα pulses (TT) and alternate TNFα and IL-1β (TI) pulses at 60 min interval. Shown are fractions (mean ±s.d.) of C9 cells that responded to the second pulse. (c) NF-κB amplitude of cells responding to two TNFα pulses (TT) and alternate TNFα and IL-1β (TI) pulses at 60 min interval. Shown are the peak 2 (P2) p65-mCherry translocation amplitudes (expressed as the fraction of the peak 1 amplitude, P1) of individual C9L cells, with corresponding mean and±data range per condition. In TI, TNFα and IL-1β pulses applied at 0 and 60 min, respectively. Statistical difference assessed with a Mann-Whitney test (**** P val<0.0001). (d) Immunoblotting analysis of IκBα and serine 536-phosphorylated NF-κB p65 levels in WT cells stimulated with two pulses of TNFα, or alternate TNFα and IL-1β pulses at 60 min interval. Timing of TNFα and IL-1β stimulation represented with blue and pink bars, respectively. (e) Confocal microscopy images of WT cells stimulated with two pulses of fluorescently labelled TNFα at 60 min interval. FITC-conjugated TNFα (top) was applied at 0 min and measured 10 min after stimulation. Tx-Red-conjugated TNFα (middle) was applied on the same cells at 60 min, and measured at 70 min after the start of the experiment. Corresponding bright field images shown at the bottom. Scale bar, 20 μm. (f) TNFα internalization in WT cells as in e. Shown is total fluorescence levels per cell measured at 10 min after stimulation at 0 and 60 min, respectively. (g) Flow cytometry analysis of TNFR1 receptor expression. WT SK-N-AS cells were stimulated with 5 min pulse of TNFα and TNFR1 expression was measured by flow cytometry at 5, 60 and 100 min after treatment (in addition to untreated and unlabelled controls).
Figure 4
Figure 4. Mathematical model recapitulates single-cell responses.
(a) Schematic representation of the IKK signalling module. (b) IKKK and A20 levels regulate NF-κB response. Cells stimulated with two 5-min TNFα pulses at 70 min interval. Shown is the nuclear NF-κB level in response to a second TNFα pulse, stratified into ‘responsive' (yellow) and ‘non-responsive' (blue) regimes (defined by a normalized net NF-κB translocation), simulated for different A20 and IKKKn levels. Two single-cell trajectories (for different levels of total IKKK, see Supplementary Table 7) in response to a 5-min pulse shown with dashed lines. Refractory periods indicated with time stamps. (c) Fraction of cells responding at different pulse intervals. Model simulations (300 cells per condition, in black) versus data (from Fig. 2f). (d) Fitted IKKK level distribution. Quantiles define fractions of responding cells at different pulsing intervals. (e) Nuclear NF-κB amplitude in responding cells. Shown is the range between single-cell trajectories corresponding to the minimum value of each quantile and the maximum IKKK level as in d. (f) Refractory period distribution as a function of the s.d. of IKKK distribution (σ). Simulations (300 cells) for σ equal to 0.9 μ, 0.3 μ and 0.1 μ, where μ=106 is mean IKKK level. Shown also, is the measured distribution from Fig. 2g. (g) Global sensitivity analysis of NF-κB system response to 70 min TNFα pulse stimulation. Shown is the correlation between sensitivity scores for fraction of responding cells (defined by a net NF-κB nuclear translocation) and area under the curve (AUC) of nuclear NF-κB trajectory in response to the second pulse. Shown in blue are parameters controlling the NF-κB amplitude and AUC, in brown parameters controlling only AUC. (h) A20 regulates refractory period. Shown is the fraction of cells treated with A20 siRNA (or scrambled control) responding to the second pulse (mean±data range). C9 cells stimulated with two 5 min TNFα pulses applied at 0 and 60 min. (i) Refractory periods simulated with distributed total IKKK level (IKKKtott, μ=nominal parameter value), IKKK recovery rate (m3, μ=1.2 × nominal value), IκBα protein half-life (c4a, μ=nominal value), versus data (Fig. 2g). s.d. of the normal distribution set to σ=0.3μ for respective parameters (300 simulated cells per condition).
Figure 5
Figure 5. Single-cell responses to pulsed TNFα stimulation are imprinted.
(a) Schematic representation of the intrinsic (blue) and extrinsic (yellow) noise in the NF-κB system. (b) Different noise models fit single-cell data. Shown is the comparison between simulation (300 cells) of extrinsic noise (via the distributed A20 transcription rate) and intrinsic noise (via the stochastic regulation of A20 gene activity) model, and the data for TNFα pulses at 70 min interval. (c) Simulated single-cell traces (shown as NF-κB:IκBα complex levels, in different coloured lines) for different noise models. TNFα applied at two 70 min intervals separated by 4 h equilibration phase (as depicted with blue bars). (d) C9 cell responses to equilibrated TNFα pulses (as in c). Shown are means (in green, ±s.d.) of normalized single-cell total IκBα-GFP intensities in nine non-responsive (left panel) and 32 responsive cells (right panel) to second (p2) and fourth (p4) pulse. (e) Comparison between model simulations and the data for equilibrated TNFα pulses. Simulation performed with 300 cells assuming intrinsic (in yellow) and extrinsic (in blue) noise (as in c). Data from d presented in fraction of cells (total 79) responding to second (+p2,−p4), fourth (−p2,+p4) or both second and fourth (+p2,+p4) pulses. (f) Principal component analysis of single-cell data from d. For each cell, 140 min sub-trajectories corresponding to two stimulation phases were considered (depicted with symbols connected with different colour lines). Responsive and non-responsive cell clusters outlined with dashed lines. (g) Daughter cell analysis in response to two TNFα pulses at 70 min interval. Time from cell division to stimulation recorded. (h) Representative daughter C9 cell responses (as in g): Cells (indicated with stars, IκBα-eGFP intensities shown) respond to the first (depicted at 10 min after stimulation), as well as to the second TNFα pulse (at 80 min after start of the experiment). Scale bar, 20 μm. (i) Representative daughter cells trajectories (from the experiment in g). (j) Fractions of homogenous and heterogeneous daughter cells responses. 56 pairs stimulated as in g, stratified by patterns of the IκBα-eGFP signal.
Figure 6
Figure 6. Cells refractory to TNFα encode IL-1β signals.
(a) Representative single C9L cell traces stimulated with three pulses of TNFα (TTT, depicted with blue bars) or alternate TNFα and IL-1β pulses (TIT, depicted with pink bars) at 50 min intervals. Shown are normalized total IκBα-eGFP fluorescent intensities and the nuclear to total (N/T) ratios of the p65-mCherry signal. Time depicted in minutes. (b) Nuclear NF-κB activity in cells stimulated with three pulses of TNFα (TTT) or alternate TNFα and IL-1β pulses (TIT) at 50 min interval. Shown is the area under the N/T p65-mCherry trajectory (AUC) for cells as in a (base-line corrected trajectories were normalized to the first peak amplitude). (c) Schematic representation of the gene expression assay. Cells were stimulated with pulses of TNFα and IL-1β at different times (as indicated with blue and pink bars, respectively). Measurement obtained at 130 min after start of the experiment. (d) Heat map of gene expression levels for data from c. Clustering performed for log2 fold changes (as indicated with the colour scale) of three replicates. (e) Gene expression levels for IκBα, A20, CSF2, CXCL2 and IL8 transcript levels from data in d. Shown are mean expression levels (±s.d.) per condition, respectively. (f) Differential gene expression analysis between TNFα/IL-1β/TNFα (TIT) and TNFα/TNFα/TNFα (TTT) stimulation. Shown are log2 of expression fold changes for NF-κB system genes (A20, IκBα, IκBɛ, Rel, RelB, NF-κB1 and NF-κB2) and cytokine response genes (CXCL2, CXCL1, IL8, TNFAIP6, CSF2, TNFα, LIF, IL-1β and CCL2).

References

    1. Spencer S. L., Gaudet S., Albeck J. G., Burke J. M. & Sorger P. K. Non-genetic origins of cell-to-cell variability in TRAIL-induced apoptosis. Nature 459, 428–432 (2009). - PMC - PubMed
    1. Tay S. et al. Single-cell NF-κB dynamics reveal digital activation and analogue information processing. Nature 466, 267–271 (2010). - PMC - PubMed
    1. Balazsi G., van Oudenaarden A. & Collins J. J. Cellular decision making and biological noise: from microbes to mammals. Cell 144, 910–925 (2011). - PMC - PubMed
    1. Elowitz M. B., Levine A. J., Siggia E. D. & Swain P. S. Stochastic gene expression in a single cell. Science 297, 1183–1186 (2002). - PubMed
    1. Levine J. H., Lin Y. & Elowitz M. B. Functional roles of pulsing in genetic circuits. Science 342, 1193–1200 (2013). - PMC - PubMed

Publication types

MeSH terms

LinkOut - more resources