. 2016 Jul 1;143(13):2431-42.
doi: 10.1242/dev.135004.

Retinal determination genes coordinate neuroepithelial specification and neurogenesis modes in the Drosophila optic lobe

Affiliations

Retinal determination genes coordinate neuroepithelial specification and neurogenesis modes in the Drosophila optic lobe

Holger Apitz et al. Development. .

Abstract

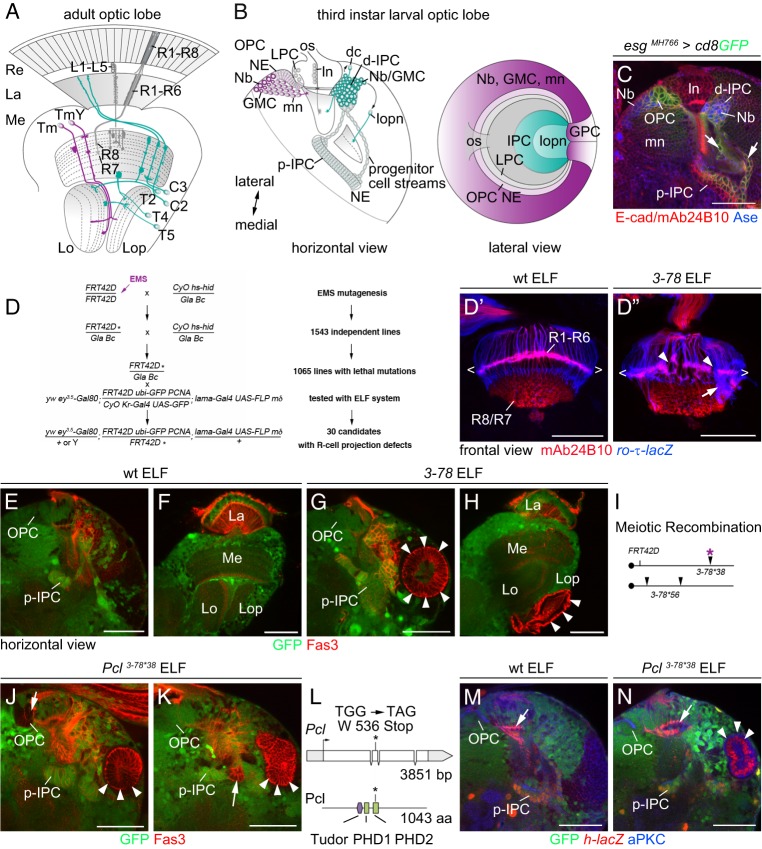
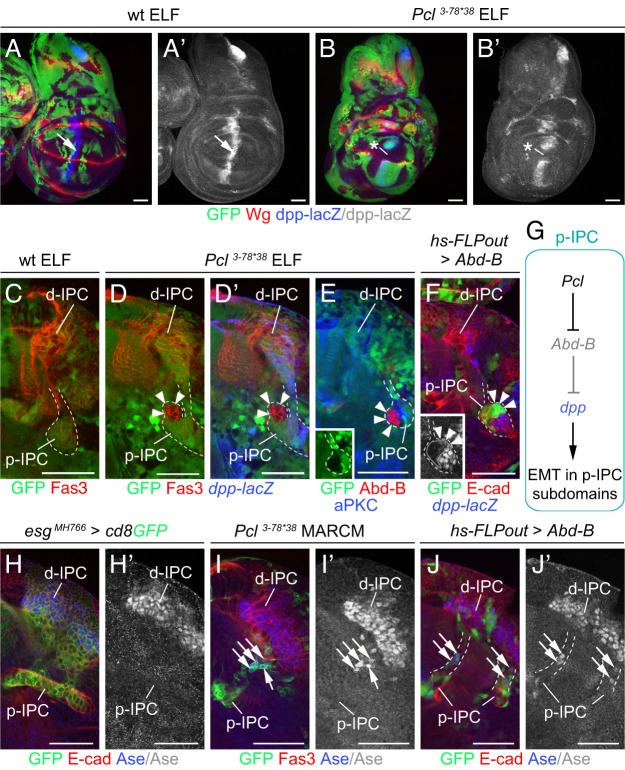
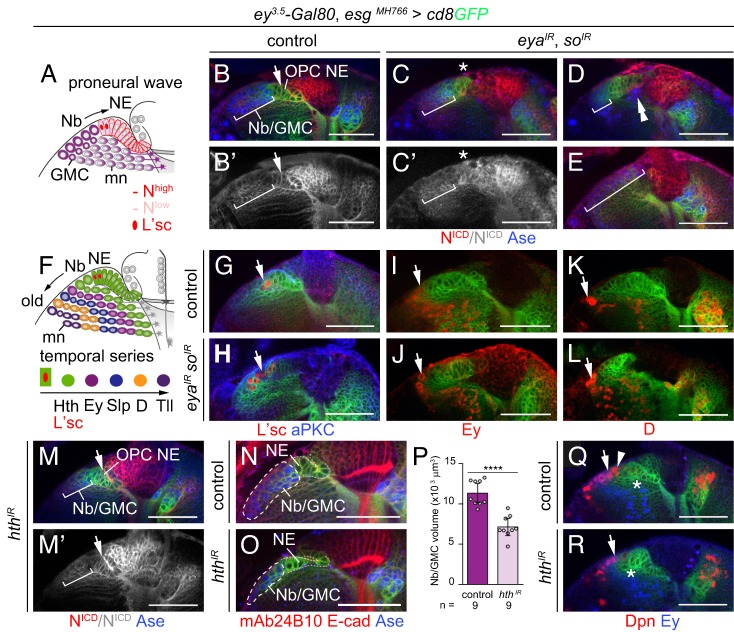
Differences in neuroepithelial patterning and neurogenesis modes contribute to area-specific diversifications of neural circuits. In the Drosophila visual system, two neuroepithelia, the outer (OPC) and inner (IPC) proliferation centers, generate neuron subtypes for four ganglia in several ways. Whereas neuroepithelial cells in the medial OPC directly convert into neuroblasts, in an IPC subdomain they generate migratory progenitors by epithelial-mesenchymal transition that mature into neuroblasts in a second proliferative zone. The molecular mechanisms that regulate the identity of these neuroepithelia, including their neurogenesis modes, remain poorly understood. Analysis of Polycomblike revealed that loss of Polycomb group-mediated repression of the Hox gene Abdominal-B (Abd-B) caused the transformation of OPC to IPC neuroepithelial identity. This suggests that the neuroepithelial default state is IPC-like, whereas OPC identity is derived. Ectopic Abd-B blocks expression of the highly conserved retinal determination gene network members Eyes absent (Eya), Sine oculis (So) and Homothorax (Hth). These factors are essential for OPC specification and neurogenesis control. Finally, eya and so are also sufficient to confer OPC-like identity, and, in parallel with hth, the OPC-specific neurogenesis mode on the IPC.

Keywords: Drosophila; Neuroepithelial specification; Neurogenesis; Polycomblike; Retinal determination genes; Visual system.


Conflict of interest statement

Competing interests

The authors declare no competing or financial interests.

Figures

Fig. 1.
Fig. 1.
Identification of Pcl in a screen for genes controlling NE patterning. (A,B) Schematic of adult (A) and third instar larval (B) Drosophila optic lobes in horizontal and lateral views. The outer and inner proliferation centers (OPC, IPC) and progeny are shown in magenta and green, respectively. (C) In third instar larval optic lobes, esgMH766-Gal4, UAS-cd8GFP (green) label the OPC, IPC and their progeny, E-cad (red) cell membranes, and mAb24B10 (red) R1-R8 axons. Nbs and GMCs express Ase (blue). Progenitor cell streams (arrows) connect the proximal and distal IPC. (D-D″) Schematic of genetic mosaic screen. Asterisks indicate EMS-induced mutations. Unlike in wild type (wt; D′), in 3-78 ELF mosaics (D″), R1-R6 axons, labeled with ro-τ-lacZ (blue), mistargeted to the medulla (arrow), causing gaps (arrowheads) in the lamina plexus (brackets). R1-R8 axons are labeled with mAb24B10 (red). (E-H) Unlike in wild type (E,F), 3-78 ELF mosaics displayed large mutant Fas3-positive (red) NE cell clusters (arrowheads) at the third instar larval stage (G), that persisted into adulthood (H). (I) Meiotic recombination crosses of 3-78 separated three lethal mutations (arrowheads). 3-78*38 carried one mutation (asterisk), 3-78*56 contained two other mutations. (J,K) 3-78*38 ELF mosaics contained large (arrowheads) and small (arrows) ectopic Fas3-positive mutant NE cell clusters. (L) Genomic locus and protein structure of Pcl indicating the stop mutation (asterisk) in Pcl3-78*38. (M) In wild type, h-lacZ was expressed in the p-IPC, but not the OPC. The mδ-lacZ transgene within the ELF system labels R4 axons (arrow). (N) Ectopic Pcl3-78*38 NE cell clusters expressed h-lacZ (arrowheads). For additional information, genotypes and sample numbers, see Fig. S1 and Table S1. dc, distal cells (include C2, C3 and T2 neurons in adults); d-IPC, distal IPC; GPC, glial precursor cell areas; La, lamina; Lo, lobula; Lop, lobula plate; ln, lamina neurons (L1-L5 in adults); lopn, lobula plate neurons (T4 and T5 in adults); Me, medulla; mn, medulla neurons; os, optic stalk; p-IPC, proximal IPC; Re, retina; Tm and TmY, transmedullary neurons. Scale bars: 50 µm.
Fig. 2.
Fig. 2.
Pcl mutant NE cells change identity from OPC to p-IPC. (A-C′) aPKC labeling (blue) of wild-type (A) and Pcl3-78*38 ELF mosaics (B-C′) showed that large Fas3-positive NE cell clusters (arrowheads) are continuous with the OPC (arrow in C,C′). (D-D″) Large cell clusters (red, arrowheads) arose adjacent to dpp-lacZ (blue)-labeled OPC subdomains. (E,F) In wild type (E), ey-FLP induces clone formation in the OPC, and not the IPC. Pcl3-78*38 clones induced in the OPC (F) form large NE cell clusters (arrowheads) expressing the p-IPC marker h-lacZ (red). (G-I′) OPC-derived ectopic NE cell clusters in Pcl3-78*38 ELF mosaics increase in size (arrowheads) and express increasing levels of Fas3 (red) at 96 h (G,G′) and 114 h (H,H′) AEL, and in late third instar (3L) larvae (I,I′). Few cells are labeled with PH3 (blue). (J) Dashed lines outline OPC neuroepithelium in neurP72-Gal4 UAS-cd8GFP (green) optic lobes labeled with Dac (red) and E-cad (red). Arrow indicates mitotic NE cell labeled with PH3 (blue). ln, lamina neurons. (K) The numbers of PH3-positive cells in control OPC neuroepithelia and Pcl3-78*38 clusters are similar in late third instar larvae (two-tailed unpaired Student's t-test, P=0.059) and at 114 h AEL (P=0.832). Graph shows data point distributions and means±95% confidence intervals. (L,M) In Pcl3-78*38 ELF mosaics, ectopic NE cell clusters (arrowheads; insets) did not give rise to Nbs labeled with Mira (red; L) and Dpn (red; M). Nbs in the vicinity (arrows, M, inset) are GFP positive and therefore heterozygous. (N-O′) Similar to Pcl3-78*38 MARCM clones in the OPC (N,N′), Sce1 mutant NE cells ectopically expressed Fas3 (arrowheads) (O,O′). See also Fig. S1. For genotypes and sample numbers, see Table S1. Scale bars: 50 µm.
Fig. 3.
Fig. 3.
Ectopic Abd-B mediates the identity change from OPC to p-IPC. (A-G) Wild-type optic lobes do not express Abd-B (red, A), Scr (red, D) or Ubx (red, F). In Pcl3-78*38 ELF mosaics, Abd-B (red, B,C), but not Scr (E, red) and Ubx (G, red), were ectopically expressed in clones, including the large clusters (arrowheads). Asterisks indicate absence of Scr and Ubx expression in clusters. (H-K) Compared with wild-type ELF mosaics (H), formation of large ectopic Fas3-positive NE cell clusters in Pcl3-78*38 ELF mosaics (I, arrowheads) was suppressed by expression of Abd-BIR with lama-Gal4 contained in the ELF system (J). Ectopic Abd-B was absent from NE cells in the OPC and p-IPC, and weakly expressed in neuronal progeny (K). (L-M′) hs-FLPout clones (green) expressing ectopic Abd-B formed large Fas3-positive NE cell clusters derived from the OPC (red, arrowheads). See also Fig. S2. For genotypes and sample numbers, see Table S1. Scale bars: 50 µm.
Fig. 4.
Fig. 4.
Ectopic Abd-B affects Dpp-dependent EMT and progenitor differentiation in the IPC. (A-B′) Unlike in controls (A,A′), dpp-lacZ expression (blue) at the anterior-posterior boundary (arrow) was repressed in Pcl3-78*38 ELF mosaic wing imaginal discs (B,B′, asterisk). (C-E) Unlike in controls (C), Pcl3-78*38 ELF mosaics (D) showed small Fas3-positive (red) clusters (arrowheads) close to the p-IPC (dashed line). These were dpp-lacZ negative (blue, D′) and Abd-B positive (red, E, inset). (F) hs-FLPout clones (green) expressing ectopic Abd-B formed small clusters (arrowheads) adjacent to p-IPC (dashed line) subdomains and downregulated dpp-lacZ (blue; inset, white; arrowheads). (G) Model of Pcl function in p-IPC subdomains. (H-J′) Progenitor cell streams between the p-IPC and d-IPC in esgMH766-Gal4, UAS-cd8GFP (green) animals did not express Ase (blue) (H,H′). Pcl3-78*38 mutant progenitors (green) generated by MARCM ectopically expressed Ase (blue, arrows) (I,I′). Ectopic expression of Abd-B using the hs-FLPout approach had the same effect (J,J′, arrows). For genotypes and sample numbers, see Table S1. Scale bars: 50 µm.
Fig. 5.
Fig. 5.
RDGN member expression distinguishes OPC and IPC. (A-E′) Optic lobes were labeled with esgMH766-Gal4, UAS-cd8GFP (green) and aPKC, E-cad or Fas3 (blue). At the third instar larval stage, Eya (red; A,A′), so-lacZ (red; B,B′) and Hth (red; C,C′) were detected in OPC but not IPC NE cells or cell streams (outlined; arrows indicate cell streams). Eya (A) and so-lacZ (B) were expressed in lamina neurons (ln), Eya in a subset of medulla neurons (mn, asterisks), and Hth (C) in some OPC Nbs, medulla neuron subtypes (asterisks) and glia (arrowheads). At the first instar larval stage, Eya (red; D,D′) and Hth (red; E,E′) were expressed in the OPC, and not the IPC (arrowheads; D′,E′). (F) Schematic of OPC-specific RDGN member expression. mn, medulla neurons. (G-N′) Cross-regulatory interactions of eya, so and hth in the OPC. Knockdown of eya resulted in the absence of so-lacZ expression (red; G,G′) in OPC NE cells. Hth (red; H,H′) was not affected in eyaclift1 ELF mosaics. Eya (red; I,I′) or Hth (red; J,J′) expression were not altered in so3 mutant OPC NE cells. No mutant lamina neurons (ln) formed in eyaclift1 and so3 ELF mosaics (H-J). Hth (red; K,K′) was not affected by simultaneous knockdown of eya and so. Eya (red; L,L) and so-lacZ (red; M,M′) were not impaired by hth knockdown. Simultaneous knockdown of hth and so did not affect Eya (red; N,N′) expression. See also Fig. S3. For genotypes and sample numbers, see Table S1. Scale bars: 50 µm (A-C′,G-N′), 25 µm (D-E′).
Fig. 6.
Fig. 6.
RDGN members are required for controlled OPC Nb formation. (A) Schematic of proneural wave progression and L'sc and N expression in the OPC. (B-E) In controls (B,B′), the intracellular domain of N (red) was detected at high levels in OPC NE cells (arrow), and at low levels in Nbs/GMCs (brackets) labeled with Ase (blue). Following simultaneous knockdown of eya and so, the boundary between high and low N was less sharp (asterisk; C,C′). Nbs/GMCs were mispositioned below NE cells (double arrowheads; D), and areas occupied by Nbs/GMCs were expanded while NE cells were missing (E). (F) Schematic illustrating the sequential expression of Hth, Ey, Slp, D and Tll in OPC Nbs. (G,H) Whereas in controls (G), L'sc (red, arrow) was detected in two cells in the NE/Nb transition zone, an increased number of cells expressed L'sc upon eya/so knockdown (H). (I-L) In controls (I,K) and upon eya/so knockdown (J,L), Nbs expressed Ey and D (red, arrows). (M,M′) N appeared to be unaffected by hth knockdown. (N,O) Compared with controls (N), hth knockdown (O) reduced the area occupied by Nbs/GMCs in the OPC (dashed line) labeled with Ase (blue). R-cell axons were stained with mAb24B10 (red), cell membranes with E-cad (red). OPC NE cells are demarcated by dashed lines. (P) Nb/GMC volume measurements in controls and upon hth knockdown. Graph shows data point distributions and means±95% confidence intervals; the two-tailed unpaired Student's t-test P value is P=0.000019. (Q,R) As in controls (Q), Dpn-positive Nbs (red) expressed Ey (blue, arrows) following hth knockdown (R). The number of Ey-negative, Dpn-positive Nbs (arrowhead) and the area preceding Ey-positive progeny (asterisks) were reduced. See also Fig. S3. For genotypes and sample numbers, see Table S1. Scale bars: 50 µm.
Fig. 7.
Fig. 7.
Loss of Pcl and ectopic Abd-B downregulate the expression of OPC-specific RDGN members. (A-C′) Mutant OPC NE cells in eyaclift1 (A) and so3 (B) ELF mosaics formed large clusters (arrowheads; outlined), but did not express ectopic Fas3 (red). L'sc-expressing cells (red) were detected in the core OPC (arrow) but not in ectopic clusters (arrowheads; outlined) in eyaclift1 ELF mosaics (C,C′). (D) MARCM generated hth64.1 mutant NE cells in the OPC (arrow; outlined) did not express Fas3 (red; white in inset). (E-G′) Simultaneous knockdown of eya, so and hth (E,E′) or eya, hth and Optix (G,G′) did not result in ectopic Fas3 expression (red) in OPC NE cells. In wild type, Optix (red) was expressed in dorso-ventral OPC subdomains (F). (H-K) In Pcl3-78*38 ELF mosaics, Eya (red; H,I; white in inset) and Hth (red; J,K; white in inset) were downregulated in the OPC crescent (arrows) and OPC-derived large ectopic NE cell clusters (arrowheads). (L-O′) hs-FLPout clones (green) expressing ectopic Abd-B in the OPC (outlined) did not affect Cut expression (red; L,L′), but led to upregulation (asterisks) of Fas3 (red; M,M′) compared with control cells (arrowheads). Eya (red; N,N′) and Hth (red; O,O′) were downregulated (asterisks), compared with control cells (arrowheads). (P) Model of Pcl function in the OPC. x, additional unidentified factor. See also Fig. S4. For genotypes and sample numbers, see Table S1. Scale bars: 50 µm.
Fig. 8.
Fig. 8.
Ectopic eya/so confer OPC-like identity to the p-IPC. (A-B′) hs-FLPout clones (green) co-expressing ectopic eya/so downregulated (asterisks) Fas3 (red; A,A′) in the p-IPC (dashed line) and induced direct conversion into Dpn-positive Nbs (red; B,B′; arrowheads) from the p-IPC. (C-D′) Ectopic hth did not downregulate Fas3 (red; C,C′), but induced the formation of Dpn-positive Nbs (red; D,D′; arrowheads) in the p-IPC. (E-G′″) Ectopic eya/so induced Hth (red; E,E′; arrowheads) and Ey (red; F-G″) expression in the p-IPC. Ey was detected in Nbs (arrowheads) and in neuronal progeny expressing Elav (blue, arrow; G-G′″) within the d-IPC. (H-K′) In controls, the most distal Nbs (arrowheads) in the d-IPC expressed Ato (red; H,H′) and Dac (red; J,J′). Dac is maintained in lobula plate neurons (lopn). Clones expressing ectopic eya/so in the d-IPC did not express Ato (red; I,I′) or Dac (red; K,K′). (L) Model of eya, so and hth function in the OPC. Asterisk indicates sufficiency but not requirement of eya/so for hth expression. x, additional unidentified factor. See also Fig. S4. For genotypes and sample numbers, see Table S1. Scale bars: 50 µm.

References

    1. Abitua P. B., Gainous T. B., Kaczmarczyk A. N., Winchell C. J., Hudson C., Kamata K., Nakagawa M., Tsuda M., Kusakabe T. G. and Levine M. (2015). The pre-vertebrate origins of neurogenic placodes. Nature 524, 462-465. 10.1038/nature14657 - DOI - PMC - PubMed
    1. Apitz H. and Salecker I. (2014). A challenge of numbers and diversity: neurogenesis in the Drosophila optic lobe. J. Neurogenet. 28, 233-249. 10.3109/01677063.2014.922558 - DOI - PubMed
    1. Apitz H. and Salecker I. (2015). A region-specific neurogenesis mode requires migratory progenitors in the Drosophila visual system. Nat. Neurosci. 18, 46-55. 10.1038/nn.3896 - DOI - PMC - PubMed
    1. Arlotta P. and Hobert O. (2015). Homeotic transformations of neuronal cell identities. Trends Neurosci. 38, 751-762. 10.1016/j.tins.2015.10.005 - DOI - PubMed
    1. Atkins M., Jiang Y., Sansores-Garcia L., Jusiak B., Halder G. and Mardon G. (2013). Dynamic rewiring of the Drosophila retinal determination network switches its function from selector to differentiation. PLoS Genet. 9, e1003731 10.1371/journal.pgen.1003731 - DOI - PMC - PubMed

Publication types

MeSH terms

Substances

LinkOut - more resources