. 2016 Aug 18;128(7):e10-9.
doi: 10.1182/blood-2015-11-680843. Epub 2016 Jul 5.

Long noncoding RNAs in B-cell development and activation

Affiliations

Long noncoding RNAs in B-cell development and activation

Tiago F Brazão et al. Blood. .

Abstract

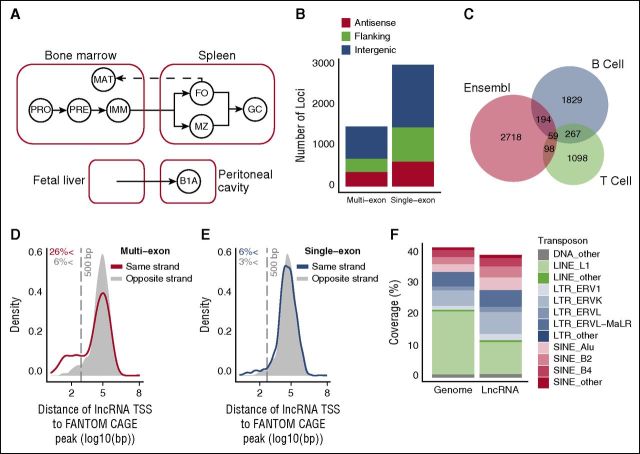
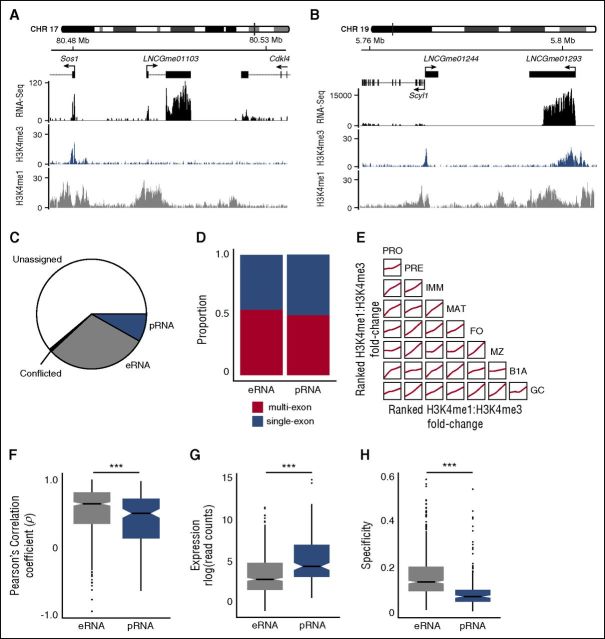
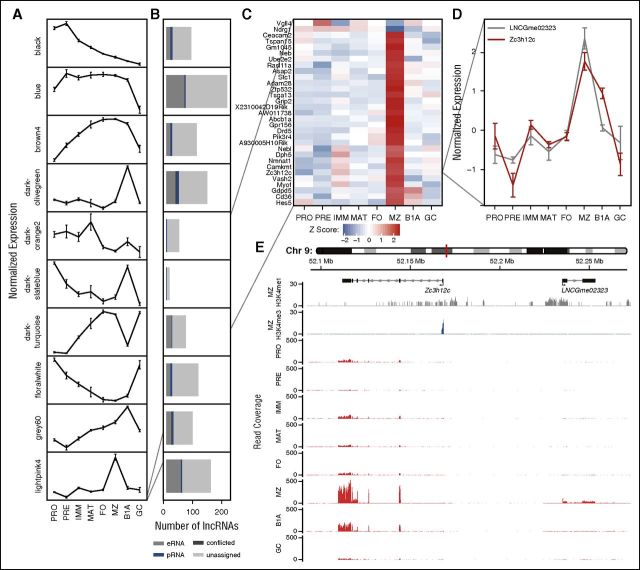
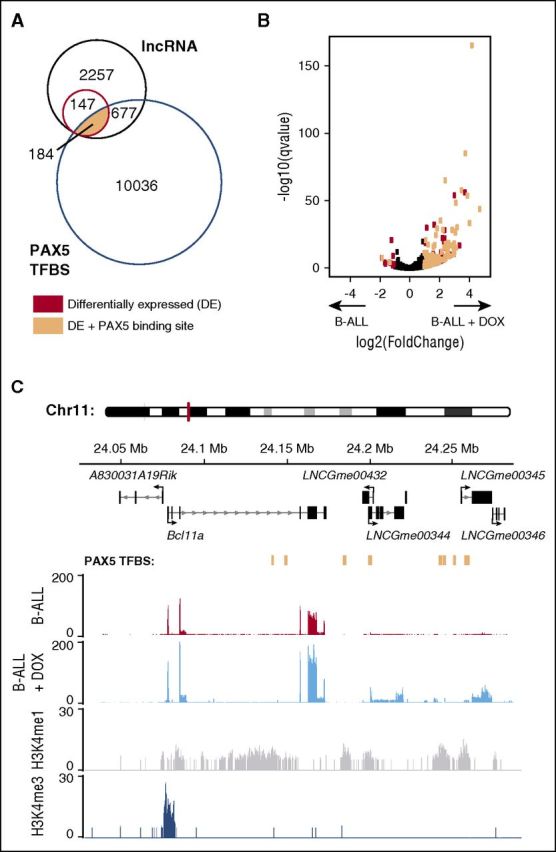
Long noncoding RNAs (lncRNAs) are potentially important regulators of cell differentiation and development, but little is known about their roles in B lymphocytes. Using RNA-seq and de novo transcript assembly, we identified 4516 lncRNAs expressed in 11 stages of B-cell development and activation. Most of these lncRNAs have not been previously detected, even in the closely related T-cell lineage. Comparison with lncRNAs previously described in human B cells identified 185 mouse lncRNAs that have human orthologs. Using chromatin immunoprecipitation-seq, we classified 20% of the lncRNAs as either enhancer-associated (eRNA) or promoter-associated RNAs. We identified 126 eRNAs whose expression closely correlated with the nearest coding gene, thereby indicating the likely location of numerous enhancers active in the B-cell lineage. Furthermore, using this catalog of newly discovered lncRNAs, we show that PAX5, a transcription factor required to specify the B-cell lineage, bound to and regulated the expression of 109 lncRNAs in pro-B and mature B cells and 184 lncRNAs in acute lymphoblastic leukemia.


Figures

Figure 1
Figure 1
Identification of lncRNAs expressed in B cells. (A) Schematic representation of the ontogenetic relationships between B-cell populations used to generate the lncRNA catalog. Solid arrows indicate developmental progression through B-cell stages or activation (to GC B cells). Dashed line indicates recirculation of follicular B cells back to the bone marrow. B1A, B1a B cells; FO, follicular B cells; GC, germinal center B cells; IMM, immature B cells; MAT, mature B cells; MZ, marginal zone B cells; PRE, pre-B cells ; PRO, pro-B cells. (B) Genomic distribution of the 1491 multiexon and 3025 single-exon lncRNAs identified by this study. Positions are described relative to Ensembl v72 protein-coding gene annotations as antisense (overlapping a coding gene on antisense strand), flanking (<5 kb from coding gene), and intergenic (>5 kb from coding gene). (C) Overlap between the 2349 intergenic lncRNAs identified by this study (B cell), with those identified in T lineage cells (T cell), and those annotated in Ensembl v78. Kernel density plots representing the distribution of distance between each multiexon (D) and single-exon (E) intergenic lncRNA TSS and the nearest annotated TSS on the same strand that appeared in 2 or more of the 128 mouse cell lines considered by the FANTOM5 consortium. CAGE, cap analysis of gene expression. Shaded regions indicate a null distribution as measured by distance to the nearest FANTOM5 annotated TSS on the opposing strand. Vertical gray dashed line indicates a distance of 500 bp. (F) Coverage of the genome and of lncRNA exons by the indicated transposon elements.
Figure 2
Figure 2
Identification of intergenic lncRNAs with enhancerlike and promoterlike characteristics. Examples of intergenic lncRNA loci with chromatin signatures in marginal zone B cells that are characteristic of (A) eRNA loci (LNCGme01103) and (B) pRNA loci (LNCGme01293). The former are distinguished by high H3K4me1 read coverage across the TSS and the absence of a corresponding H3K4me3 peak. The latter are distinguished by high H3K4me3 coverage, the presence of which excludes H3K4me1 from the TSS. (B) Also shown is a second lncRNA (LNCGme01244) that arises as a result of bidirectional transcription from the Scyl1 promoter, but this is not classified as an eRNA or pRNA because its proximity to a coding gene. CHR, chromosome. (C) The proportion of the 2349 intergenic lncRNAs identified in this study that could be classified as either eRNAs or pRNAs on the basis of their chromatin state. Remaining lncRNAs are either classified as unassigned (insufficient read coverage/fold-change to determine chromatin state) or conflicted (classified as eRNA in 1 B-cell stage and pRNA in another). (D) The proportion of eRNA and pRNA loci that are classified as multiexon or single exon. (E) Pairwise comparisons showing the consistency of chromatin signatures across B-cell populations. Within each B-cell population, intergenic lncRNAs are ranked on the ratio of H3K4me1:H3K4me3 coverage across their TSS. Individual plots show the local regression (loess) of rank order between 2 B-cell populations. (F) Distribution of the Pearson’s correlation coefficient between the expression of an eRNA or pRNA and expression of the more highly correlated of either its nearest upstream or downstream protein-coding gene. (G) Distribution of median expression values (rlog-transformed read counts) calculated across all cell stages. (H) Distribution of cell stage specificity of expression of eRNAs and pRNAs. ***Mann-Whitney U test: p < .0001.
Figure 3
Figure 3
Cell stage–specific expression at lncRNA and protein-coding loci. Principal component analysis of regularized log-transformed expression patterns at (A) protein-coding loci and (B) the 4516 lncRNA loci identified in this study. Dashed gray lines indicate groups identified by unsupervised hierarchical clustering (Supplemental Figure 7A-B). (C) Box plots of specificity of expression of all coding and lncRNA loci separated into quartile bins on the basis of their median expression across all 8 B-cell stages. Numbers below each quartile indicate the number of lncRNA and protein-coding loci that fall into each category. Venn diagrams showing the number of protein-coding (D) and lncRNA (E) loci that are either expressed in multiple cell populations (blue) or expressed in a single cell population (red) at an FPKM threshold of 1.0. Splenic plasmablasts (PB) and plasma cells (PC (SP)), and bone marrow plasma cells (PC (BM)). Numbers adjacent to each plot depict the proportion of loci falling into each category.
Figure 4
Figure 4
Association between lncRNAs and protein-coding genes based on correlation of expression across B-cell development. (A) WGCNA identifies clusters of protein-coding genes with comparable expression profiles across B-cell development: plots show a representative expression profile (eigengene) for each of 10 protein-coding gene clusters. (B) Stacked bar charts showing the number of lncRNAs whose expression is strongly correlated (|ρ| > 0.8) with the adjacent eigengene. Colors depict lncRNA classification on the basis of chromatin state. (Results are shown for WGCNA clusters with >10 associated lncRNAs.) (C) Heat map showing the normalized expression of cluster lightpink4 containing 31 protein-coding genes identified as upregulated or downregulated in marginal zone B cells. (D) The normalized expression profile of a single gene (Zc3h12c) from this cluster identified as upregulated in marginal zone B cells and a single eRNA (LNCGme02323) identified as strongly correlated with the respective WGCNA cluster. (E) Genome plots showing the location of Zc3h12c and LNCGme02323 as well as H3K4me1 and H3K4me3 chromatin signatures in marginal zone B cells and RNA-seq read coverage in all 8 B-cell populations considered in this study.
Figure 5
Figure 5
Identification of lncRNAs with PAX5-dependent expression in B-ALL cells. (A) Venn diagram depicting overlap between lncRNAs with sufficient read coverage to be included in this analysis (black), lncRNAs differentially expressed (DE) between B-ALL cells with and without doxycycline-induced Pax5 expression (red), and PAX5 transcription factor binding sites (TFBS) annotated in either pro-B cells or mature B cells (blue) that could not be associated with a protein-coding gene. A subset of lncRNAs is both DE and has PAX5 bound within the gene body or promoter region (peach). (B) Volcano plot depicting the fold-change in lncRNA expression between B-ALL cells vs B-ALL cells with doxycycline-induced Pax5 expression (see supplemental Table 7) plotted against the probability that this difference had occurred by chance (q value). Each dot represents a single lncRNA and is colored black unless it was DE (q < .05) and either near or not near a PAX5 binding site (peach or red, respectively). (C) Genome plot showing PAX5-bound eRNA loci (LNCGme00432, LNCGme00344, and LNCGme00345), together with their proximal protein-coding gene, the zinc finger protein gene B-cell lymphoma 11a (Bcl11a). All are DE in B-ALL cells upon induction of Pax5 expression. PAX5 binding sites in pro-B cells are indicated in peach. The other annotated lncRNA (LNCGme00346) is also an eRNA that is DE on induction of Pax5 expression, but it shows no evidence of PAX5 binding.

References

    1. Wang P, Xue Y, Han Y, et al. The STAT3-binding long noncoding RNA lnc-DC controls human dendritic cell differentiation. Science. 2014;344(6181):310–313. - PubMed
    1. IIott NE, Heward JA, Roux B, et al. Long non-coding RNAs and enhancer RNAs regulate the lipopolysaccharide-induced inflammatory response in human monocytes. Nat Commun. 2014;5:3979. - PMC - PubMed
    1. Ouyang J, Zhu X, Chen Y, et al. NRAV, a long noncoding RNA, modulates antiviral responses through suppression of interferon-stimulated gene transcription. Cell Host Microbe. 2014;16(5):616–626. - PMC - PubMed
    1. Willingham AT, Orth AP, Batalov S, et al. A strategy for probing the function of noncoding RNAs finds a repressor of NFAT. Science. 2005;309(5740):1570–1573. - PubMed
    1. Sehgal L, Mathur R, Braun FK, et al. FAS-antisense 1 lncRNA and production of soluble versus membrane Fas in B-cell lymphoma. Leukemia. 2014;28(12):2376–2387. - PMC - PubMed

Publication types

MeSH terms