. 2016 Sep 6;44(15):7331-49.
doi: 10.1093/nar/gkw606. Epub 2016 Jul 5.

HOXA1 binds RBCK1/HOIL-1 and TRAF2 and modulates the TNF/NF-κB pathway in a transcription-independent manner

Affiliations

HOXA1 binds RBCK1/HOIL-1 and TRAF2 and modulates the TNF/NF-κB pathway in a transcription-independent manner

Arnaud Taminiau et al. Nucleic Acids Res. .

Abstract

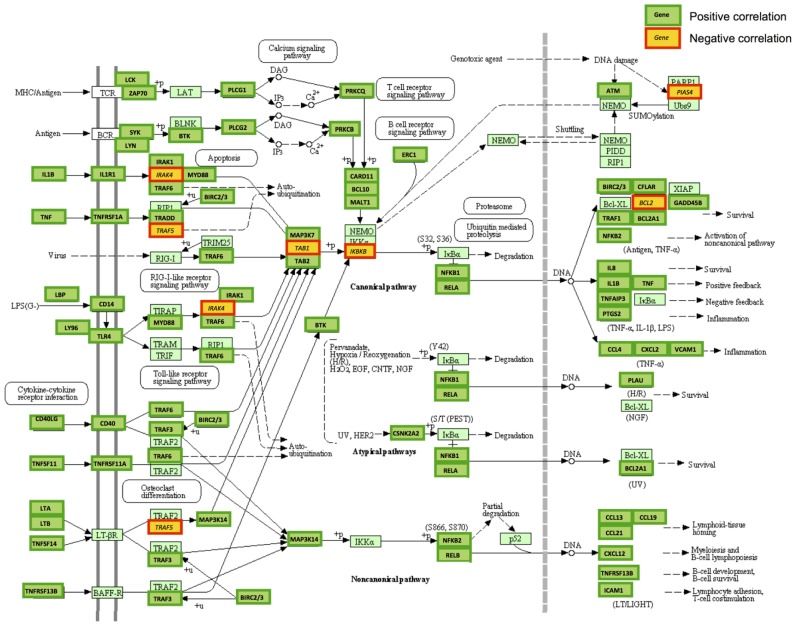
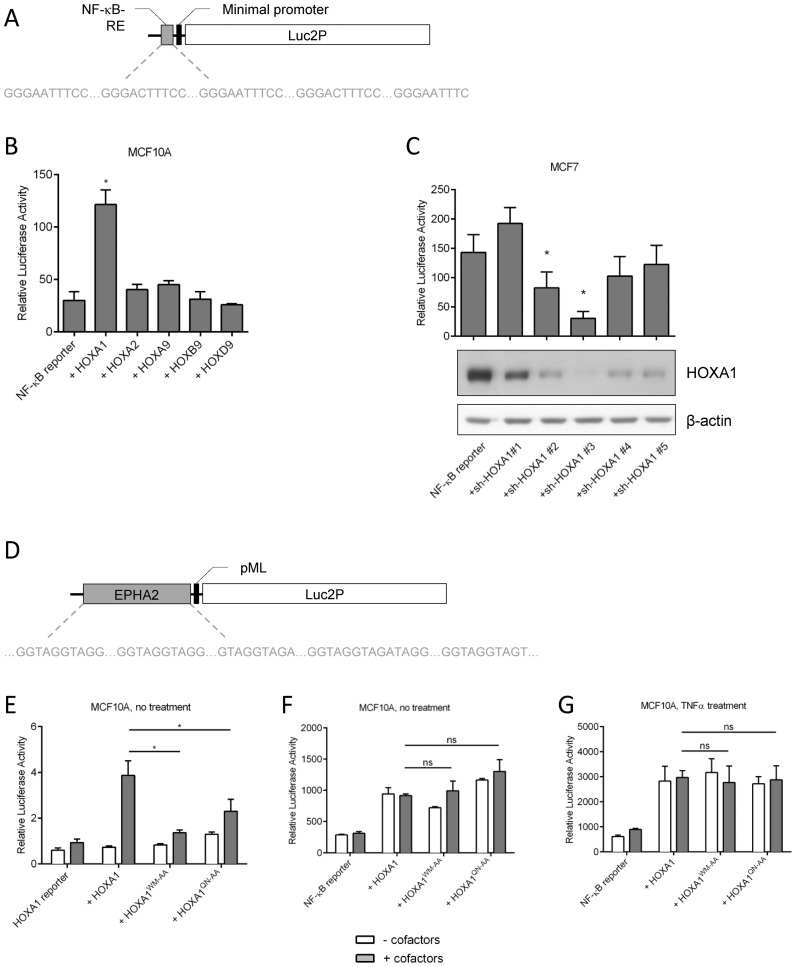
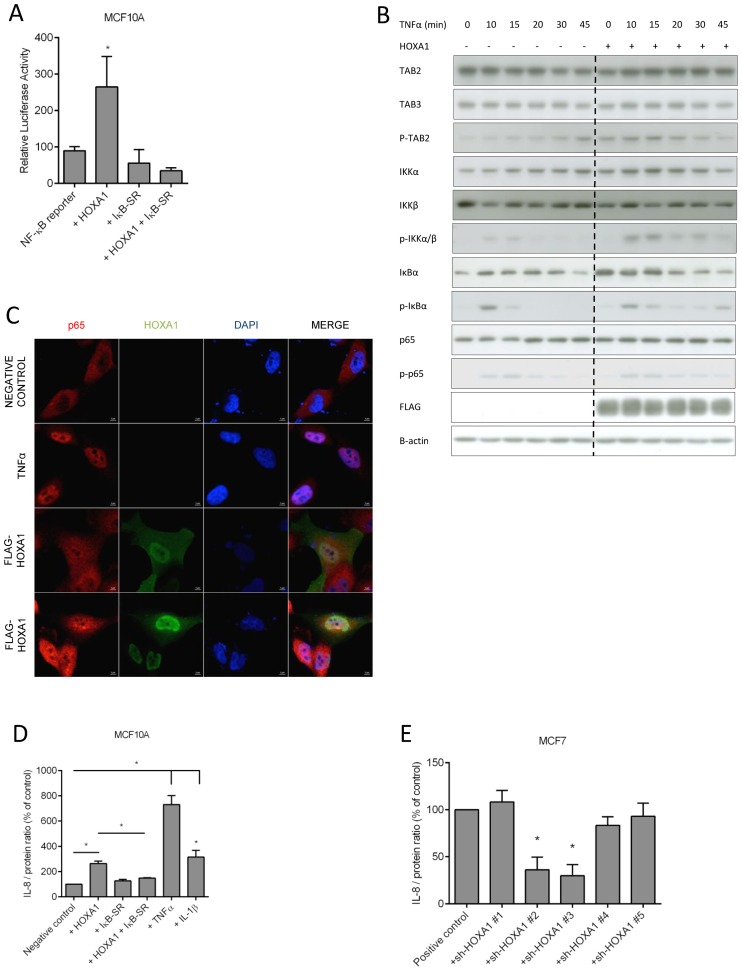
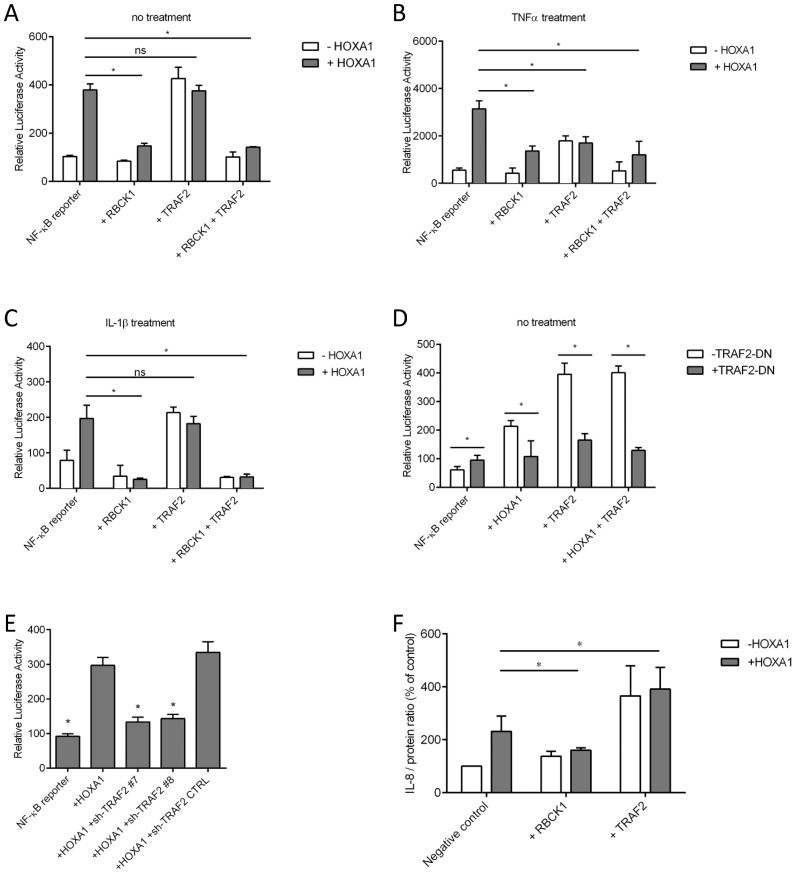
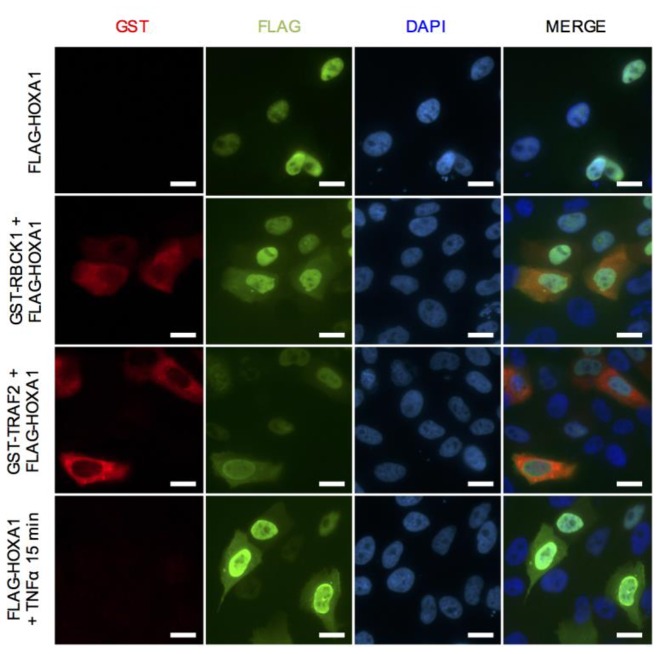
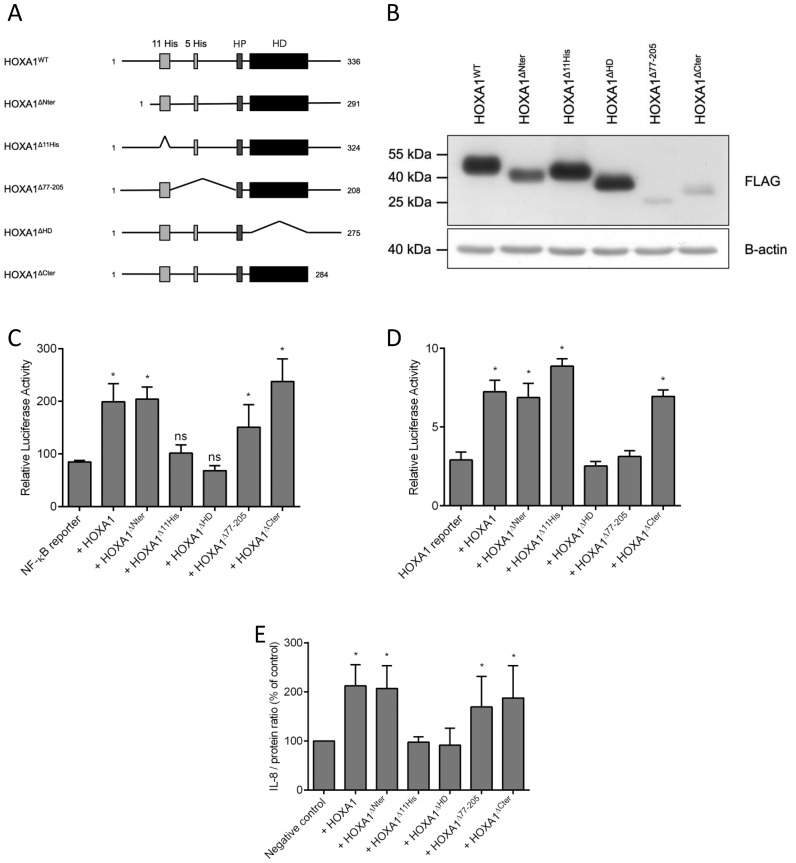
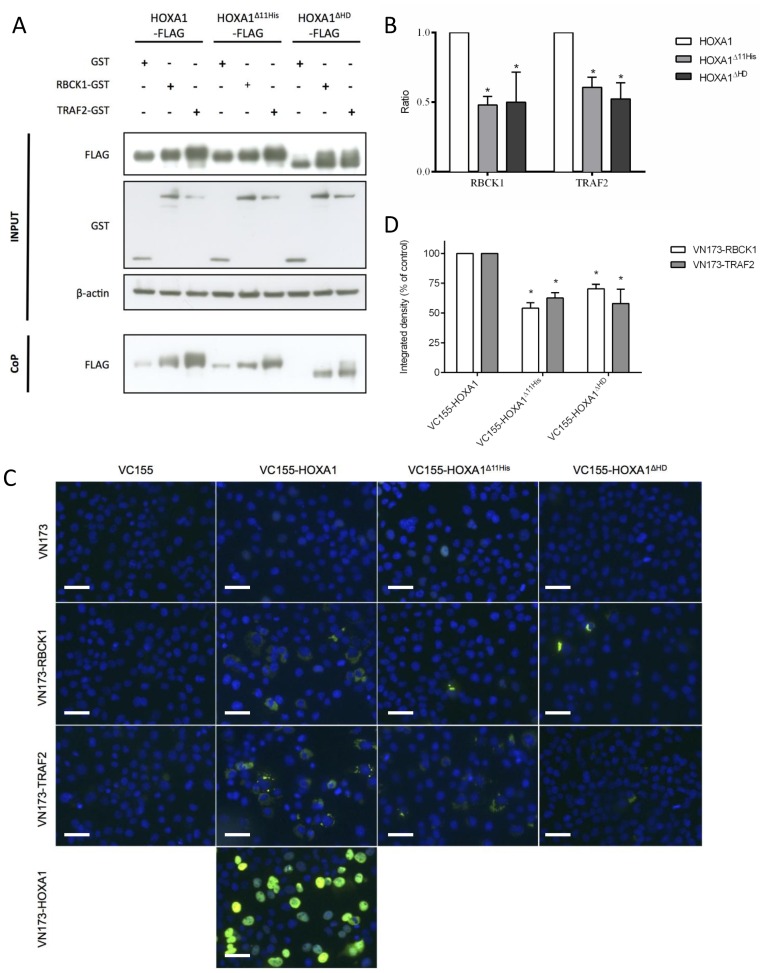
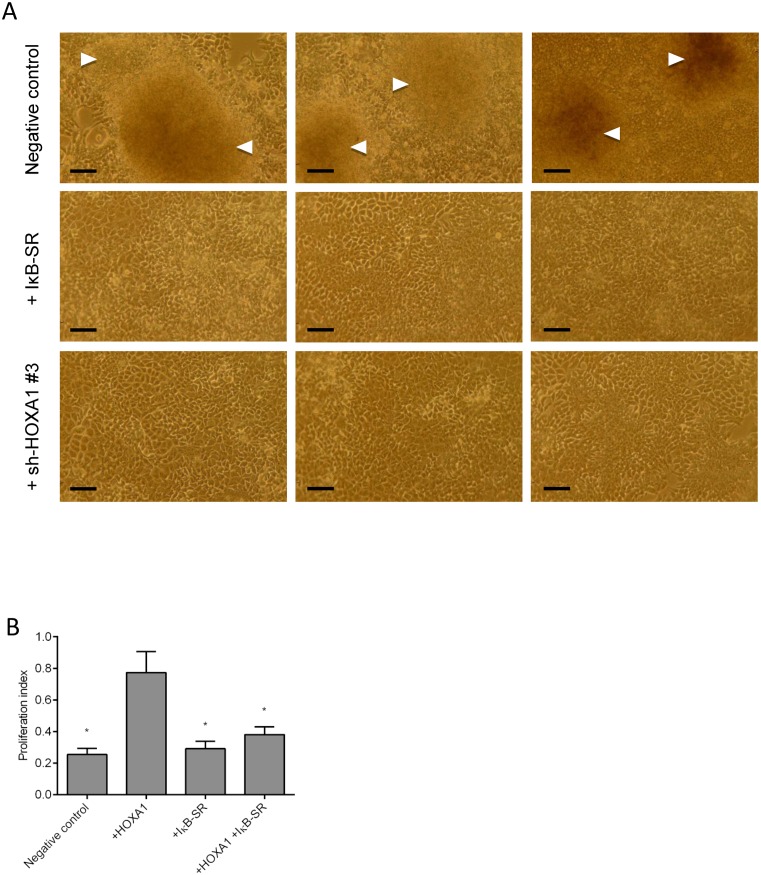
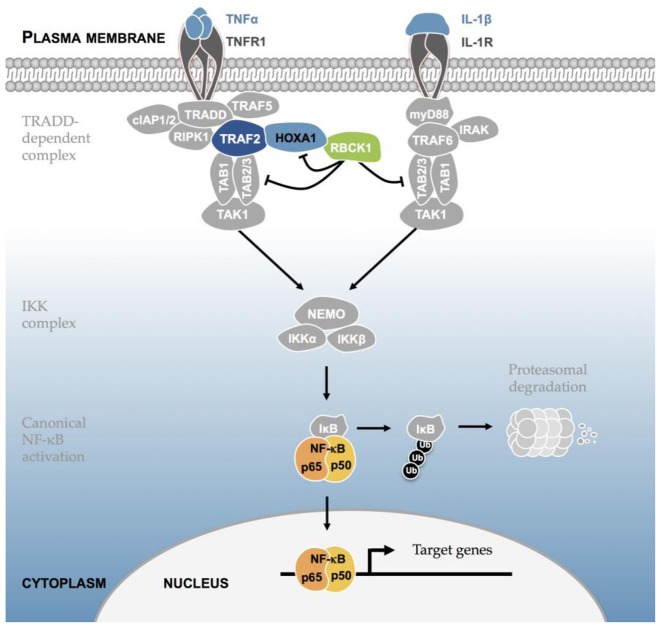
HOX proteins define a family of key transcription factors regulating animal embryogenesis. HOX genes have also been linked to oncogenesis and HOXA1 has been described to be active in several cancers, including breast cancer. Through a proteome-wide interaction screening, we previously identified the TNFR-associated proteins RBCK1/HOIL-1 and TRAF2 as HOXA1 interactors suggesting that HOXA1 is functionally linked to the TNF/NF-κB signaling pathway. Here, we reveal a strong positive correlation between expression of HOXA1 and of members of the TNF/NF-κB pathway in breast tumor datasets. Functionally, we demonstrate that HOXA1 can activate NF-κB and operates upstream of the NF-κB inhibitor IκB. Consistently, we next demonstrate that the HOXA1-mediated activation of NF-κB is non-transcriptional and that RBCK1 and TRAF2 influences on NF-κB are epistatic to HOXA1. We also identify an 11 Histidine repeat and the homeodomain of HOXA1 to be required both for RBCK1 and TRAF2 interaction and NF-κB stimulation. Finally, we highlight that activation of NF-κB is crucial for HOXA1 oncogenic activity.


Figures

Figure 1.
Figure 1.
NF-κB pathway genes with correlation to HOXA1 expression in breast cancer. Graphical overview of the NF-κB pathway showing pathway genes with a significant correlation to HOXA1 expression in the Bertucci-266 dataset. The KEGG NF-κB pathway graph with constituent genes (in pale green boxes with narrow border) is overlaid with boxes representing positively or negatively correlating genes (gene name on a green background with thick green border, or on a yellow background with thick red border, respectively). More details on correlations are in Table 1. The overview shows an almost comprehensive positive correlation with HOXA1 mRNA expression, strongly suggesting that the NF-κB pathway is activated by HOXA1 in breast cancer cells.
Figure 2.
Figure 2.
Transactivation assays on both NF-κB- and HOXA1-responsive reporters. (A) The NF-κB reporter (PGL4.32[luc2P/NF-κB-RE/Hygro]) consists in a luciferase reporter gene Luc2P controlled by five copies of a 10-nt NF-κB responsive element corresponding to p65 binding sites (GGGAATTTCC or GGGACTTTCC). (B) The specificity of HOXA1 in activating the TNF/NF-κB pathway was assessed using the NF-κB reporter and HOXA1, HOXA2, HOXA9, HOXB9 and HOXD9 expression plasmids in the human mammary epithelial cell line MCF10A. (C) The involvement of HOXA1 in NF-κB activation was assessed in a loss-of-function model by using sh-RNAs directed against HOXA1 in human breast cancer MCF7 cells. The HOXA1 protein level was analyzed by western blot, and the NF-κB activity was quantified by reporter Luciferase assay. (D) The HOXA1 reporter (pML-EPHA2-r4-luc) consists in a luciferase reporter gene Luc2P controlled by 5 HOX-PBX binding sites defining the EPHA2 gene r4 enhancer (40). (E) The ability of HOXA1 to activate the HOXA1 reporter was assessed in MCF10A cells. As controls, transcriptionally inactive HOXA1WM-AA and HOXA1QN-AA mutant proteins were tested. Expression plasmids encoding HOXA1 (wild-type, HOXA1WM-AA or HOXA1QN-AA) were transfected with or without expression plasmids for the TALE cofactors PREP1 and PBX1. (F) Reporter assays performed in MCF10A cells using the NF-κB reporter reveal that transcriptionally inactive HOXA1 variants (HOXA1WM-AA, HOXA1QN-AA) are able to stimulate NF-κB activity. (G) Similar experiments as in (F) were performed in MCF10A cells with TNFα addition (25 ng/ml for 24 h). Results are presented as a luciferase/β-galactosidase ratio (relative luciferase activity) and correspond to the means of three biologically independent duplicates ± SEM. Statistical analysis was performed (B and C) with reference to the condition involving the NF-κB reporter alone (NF-κB reporter) as control or (E-G) with comparisons between groups (*P < 0.0001; ns = not significant).
Figure 3.
Figure 3.
Effect of HOXA1 on the NF-κB pathway. (A) The effect of a super repressor version of IκB (IκB-SR) on the HOXA1-mediated activation of the NF-κB reporter was assayed in MCF10A cells. Results are presented as a luciferase/β-galactosidase ratio (relative luciferase activity) and correspond to the means of three biologically independent duplicates ± SEM. Statistical analysis was performed with reference to the condition involving the NF-κB reporter alone (NF-κB reporter). (B) Western blot showing TAB2, TAB3, p-TAB2 (Ser372), IKKα, IKKβ, p-IKKα/β (Ser176/180), IκBα, p-IκBα (Ser32), p65 and p-p65 (Ser536) proteins from MCF10A cells transfected with a FLAG-HOXA1 expression plasmid or with a negative control, and treated with TNFα (25 ng/ml) for 0, 10, 15, 20, 30 or 45 min. A total of 25 ng/ml was chosen from a range of 0, 6.25, 12.5, 25, 50, 75 or 100 ng/ml as the lowest TNFα concentration to give full reporter activation. At this TNFα concentration, reporter activation is comparable between 30 min and 24 h (not shown). A total of 250 ng HOXA1 plasmid was chosen as the optimal transfection dose from a range of 0, 50, 100, 250, 500 or 750 ng as the lowest HOXA1 dose to give full reporter activation (not shown). Detection of β-actin was used as loading control. Bands corresponding to detected proteins were cropped for the sake of presentation but all samples were processed in parallel, being run together on single protein gels. The provided blots are representative of three biologically independent experiments. (C) p65 nuclear translocation was analyzed in MCF10A cells by confocal microscopy. The images represent the cellular localization of endogenous p65 (red channel) and FLAG-HOXA1 (green channel) from representative confocal Z-section at 120 times magnification. Cell nuclei were stained with DAPI (blue channel). (D) ELISA quantification of IL-8 secretion upon HOXA1, IκB-SR, and HOXA1 and IκB-SR expression, or after TNFα or IL-1β addition to MCF10A cells. IL-8 secretion was normalized to the protein content of the cell-culture well and data were calculated using the mean absorbance of two wells. The negative control was set to 100% and statistical analysis was carried out using the negative control as control level (*P < 0.0001). This is a representative experiment of three biologically independent duplicates ± SEM. (E) The involvement of HOXA1 in triggering IL-8 secretion was assayed as in (D) using sh-HOXA1 vectors in MCF7 cells. The positive control was set to 100% and statistical analysis was carried out using the positive control as control level (*P < 0.0001). This is a representative experiment of three biologically independent duplicates ± SEM.
Figure 4.
Figure 4.
Effect of RBCK1 and TRAF2 on the HOXA1-mediated activation of the NF-κB reporter. (A) Activity tests were performed using the NF-κB reporter where each interactor was transfected alone or in combination with HOXA1. Results are presented as a luciferase/β-galactosidase ratio (relative luciferase activity) and correspond to the means of three biologically independent duplicates ± SEM. (B) The same experiment was performed after stimulation of the pathway with TNFα. The experiments were performed with 30 min or 24 h TNFα stimulation, with similar results (not shown, see also legend to Figure 3B). (C) The same experiment was performed after stimulation of the pathway with IL-1β. (D) Effect of a dominant negative version of TRAF2 (TRAF2-DN) on the HOXA1-mediated activation of the NF-κB reporter. (E) Activity tests were performed using the NF-κB reporter where HOXA1 was transfected alone or in combination with sh-TRAF2 expression vectors. (F) ELISA quantification of IL-8 secretion upon RBCK1, TRAF2 and HOXA1 expression. IL-8 secretion was normalized to the protein content of the cell-culture well and data were calculated using the mean absorbance of two wells. The negative control was set to 100% and statistical analysis was carried out using the negative control as control level (*P < 0.0001). This is a representative experiment of three biologically independent duplicates ± SEM. The experiments for (A and D) were not performed at the same time, so variations in cell culture (e.g. passage number, confluence) and/or transfection could be different. All the experiments were performed in MCF10A cells. Data were obtained, processed and represented as in Figure 2. Statistical analysis was carried out (E) with the condition involving the NF-κB reporter alone (NF-κB reporter) as control level, or (A–D; F) using comparisons between groups. (*P < 0.0001; ns = not significant).
Figure 5.
Figure 5.
Effect of RBCK1, TRAF2 and TNFα on the HOXA1 intracellular localization. Immunofluorecence was performed after transfection of MCF10A cells with FLAG-HOXA1 alone or in combination with GST-RBCK1 or GST-TRAF2, or upon TNFα treatment (25 ng/ml, 15 min). Scale bars correspond to 0.02 mm.
Figure 6.
Figure 6.
Impact of HOXA1 deletions on NF-κB activation. (A) Schematic representation of HOXA1 deletion derivatives. The wild-type (WT) protein contains two functional domains: the homeodomain (HD) and the hexapeptide (HP). It also contains two His rich regions: an 11-Histidine repeat (11-His) at the N-terminal side and a 5-His repeat (5-His) between the 11-His repeat and the hexapeptide. HOXA1ΔNter lacks the first 40 amino acids; HOXA1Δ11His lacks the complete 11-His repeat; HOXA1ΔHD lacks the homeodomain; HOXA1Δ77-205 lacks the amino acids between the 11-His repeat and the hexapeptide; HOXA1ΔCter is devoid of the C-terminal 48 amino acids. (B) HOXA1 deletion mutant expression was analyzed by western blot. Samples were centrifuged before use and only the soluble fraction was analyzed on gel. We did not find HOXA1 protein in the insoluble fraction (C and D) Activity of the HOXA1 deletion mutants on the NF-κB and HOXA1 reporters, respectively. Results are presented as a luciferase/β-galactosidase ratio (relative luciferase activity) and correspond to the means of three biologically independent duplicates ± SEM. (E) ELISA quantification of IL-8 secretion upon expression of HOXA1 deletion mutants. Results were obtained as presented in the legend to Figure 3D. All the experiments were performed in MCF10A cells.
Figure 7.
Figure 7.
Interaction assays. (A) Co-purification of proteins on glutathione-agarose beads. Expression plasmids for FLAG-tagged WT and mutant HOXA1 were co-transfected with GST-tagged RBCK1 and GST-tagged TRAF2 in HEK293T cells. Western blot analysis was used to detect FLAG-tagged HOXA1, RBCK1-GST, TRAF2-GST and β-actin proteins from cell extracts before purification (‘Input’). After purification, we retrieved comparable levels of RBCK1-GST and TRAF2-GST from the beads (not shown). Samples were centrifuged before use and only the soluble fraction was analyzed on gel. We did not find HOXA1 protein in the insoluble fraction. Data presented are representative examples; the experiments were performed three times reaching similar results. (B) Quantification of the FLAG-tagged Hoxa1 protein bands retrieved from the three co-purification experiments. Results are presented as ratios between the mutant and WT HOXA1 co-precipitation, after subtraction of the signal corresponding to the background co-precipitation obtained with native GST and correspond to means ± SEM (n = 3). Values were statistically analyzed using an Unilateral one sample test for the mean (*P < 0.0001). (C) Bimolecular Fluorescence Complementation assay. COS7 cells were transfected with combinations of expression plasmids for VN173, VC155, VC155-HOXA1, VC155-HOXA1Δ11His, VC155-HOXA1ΔHD, VN173-RBCK1 or VN173-TRAF2. Upon co-expression of VN173-HOXA1 and VC155-HOXA1, the Venus protein is reconstituted and becomes fluorescent as HOXA1 can dimerize (65). Fluorescence complementation does not occur when unfused VN173 and VC155 are co-expressed. Co-expression of VC155-HOXA1 or VC155-HOXA1 deletion derivatives with unfused VN173 serve as controls for background signal. Co-expression of VC155-HOXA1 or VC155-HOXA1 mutants with VN173-RBCK1 or VN173-TRAF2 reveals that both HOXA1Δ11His and HOXA1ΔHD interact less efficiently with RBCK1 or TRAF2. This is a representative example of three biologically independent experiments. Although the relative expression levels of the three VC155-HOXA1 fusion proteins were not determined in this experiment, we propose that the comparable expression levels of the three native HOXA1 proteins (Figure 6B) suggest that also the VC155-HOXA1 fusions are expressed at similar levels. Scale bars correspond to 0.02 mm. (D) BiFC quantification. The integrated density corresponds to the measurement of fluorescence intensity according to the ImageJ software. The integrated density of VC155-HOXA1-VN173-RBCK1 or VC155-HOXA1-VN173-TRAF2 was set to 100% and was used as control level for the statistical analysis (*P < 0.0001). Results of three biologically independent repetitions of the experiment were used for quantification.
Figure 8.
Figure 8.
Oncogenicity tests. (A) Foci formation assay was performed by transfecting MCF7 cells with empty vector (negative control), IκB-SR or sh-HOXA1 #3. After 2 weeks in culture, foci formation was observed for the negative control (white arrowheads) whereas cells transfected with IκB-SR or sh-HOXA1 did not form foci. Pictures presented were taken from three biologically independent experiments. Scale bar corresponds to 0.02 mm. (B) MTT assay was performed by transfection MCF10A cells with HOXA1 alone or in combination with IκB-SR. Global cell growth was determined by MTT assay. Results are presented as a proliferative index obtained by calculating the mean absorbance of each condition and corresponds to the mean of three biologically independent triplicates ± SEM. Statistical analysis was carried out using the ‘HOXA1’ condition as control level (*P < 0.0001).
Figure 9.
Figure 9.
Model for the HOXA1-mediated modulation of the NF-κB pathway. Upon TNF stimulation, TNFα binding to TNFR initiates the recruitment of TRADD that further recruits cIAP1/2, RIPK1, TRAF2 and TRAF5 to form the TRADD-dependent complex. This leads to the docking of TAK1 in complex with TAB2 and TAB3, allowing formation of the IKK complex. The IKK complex phosphorylates IκB, promoting its proteasomal degradation, allowing NF-κB release and finally its nuclear translocation to engage transcriptional programs. On the one hand, HOXA1 enhances TRAF2 activity or stabilizes the TRADD-dependent complex to activate the TNF/NF-κB pathway. On the other hand, RBCK1 inhibits HOXA1 as well as TAB2/3 to repress NF-κB activation. In addition, RBCK1 and TRAF2 can compete with each other to bind either the 11-His repeat or the homeodomain of HOXA1 (not represented).

References

    1. Rezsohazy R., Saurin A.J., Maurel-Zaffran C., Graba Y. Cellular and molecular insights into Hox protein action. Development. 2015;142:1212–1227. - PubMed
    1. Alexander T., Nolte C., Krumlauf R. Hox genes and segmentation of the hindbrain and axial skeleton. Annu. Rev. Cell Dev. Biol. 2009;25:431–456. - PubMed
    1. Makki N., Capecchi M.R. Hoxa1 lineage tracing indicates a direct role for Hoxa1 in the development of the inner ear, the heart, and the third rhombomere. Dev. Biol. 2010;341:499–509. - PMC - PubMed
    1. Chisaka O., Musci T.S., Capecchi M.R. Developmental defects of the ear, cranial nerves and hindbrain resulting from targeted disruption of the mouse homeobox gene Hox-1.6. Nature. 1992;355:516–520. - PubMed
    1. Mark M., Lufkin T., Vonesch J.L., Ruberte E., Olivo J.C., Dolle P., Gorry P., Lumsden A., Chambon P. Two rhombomeres are altered in Hoxa-1 mutant mice. Development. 1993;119:319–338. - PubMed

Publication types

MeSH terms

LinkOut - more resources