

Localised Effects of a Mega-Disturbance: Spatiotemporal Responses of Intertidal Sandy Shore Communities to the 2010 Chilean Earthquake
- PMID: 27383744
- PMCID: PMC4934883
- DOI: 10.1371/journal.pone.0157910
Localised Effects of a Mega-Disturbance: Spatiotemporal Responses of Intertidal Sandy Shore Communities to the 2010 Chilean Earthquake
Abstract
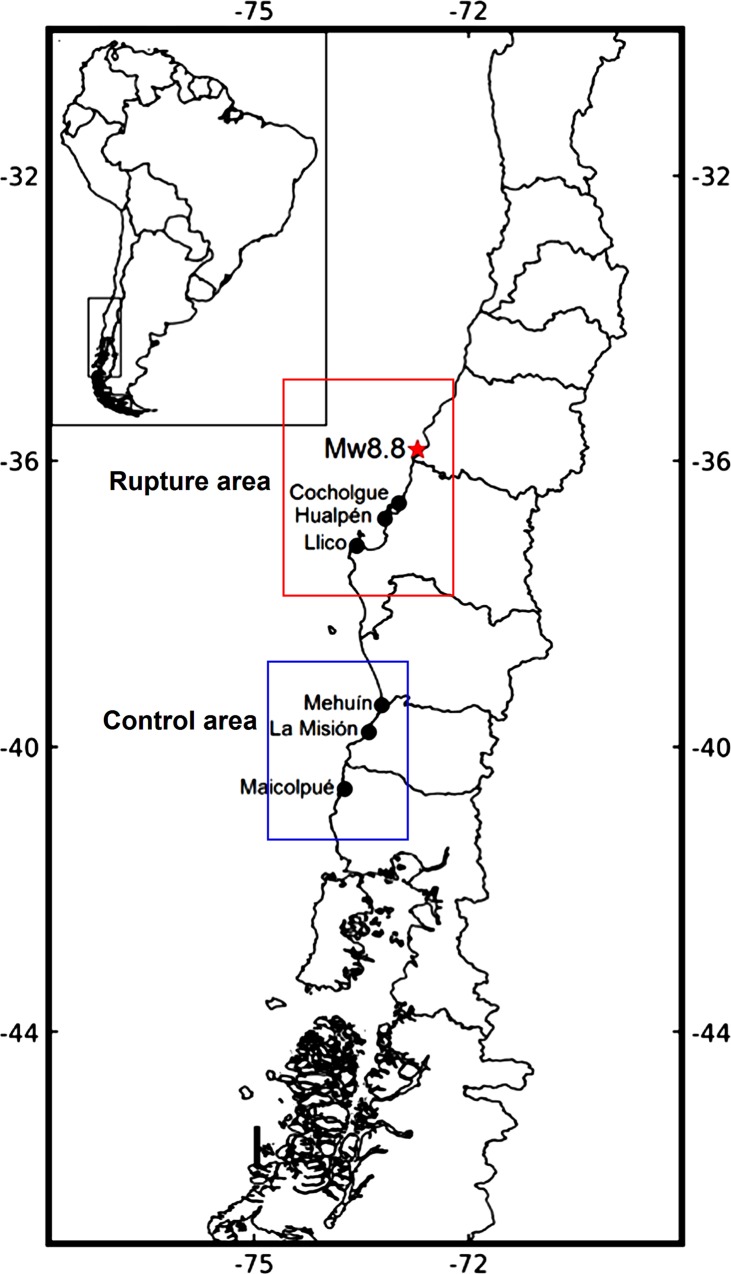
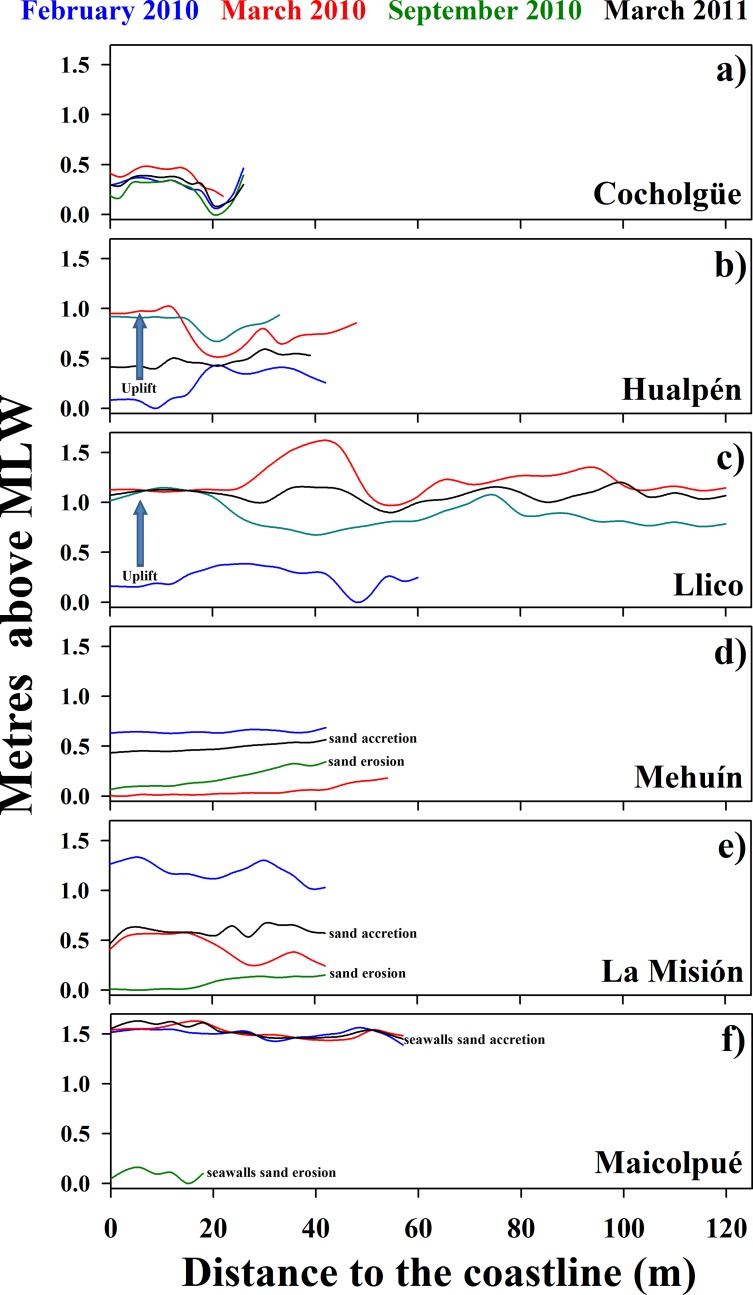
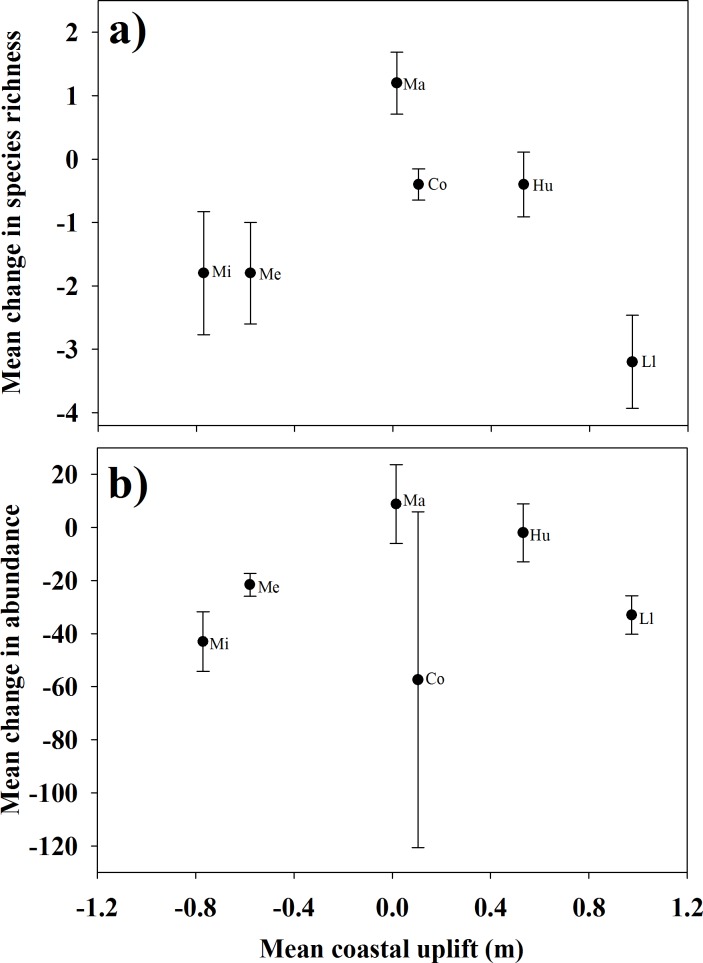
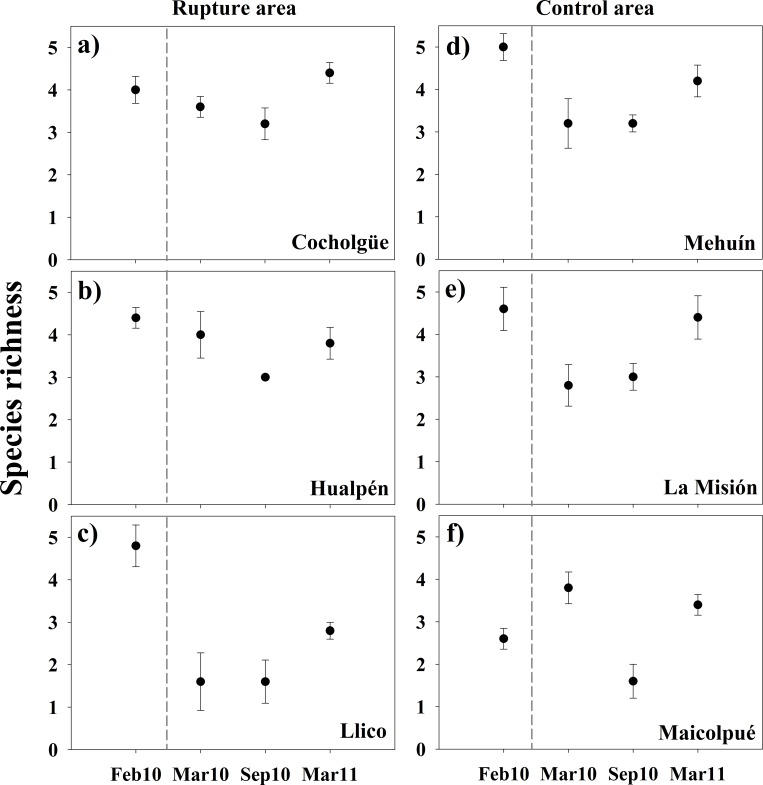
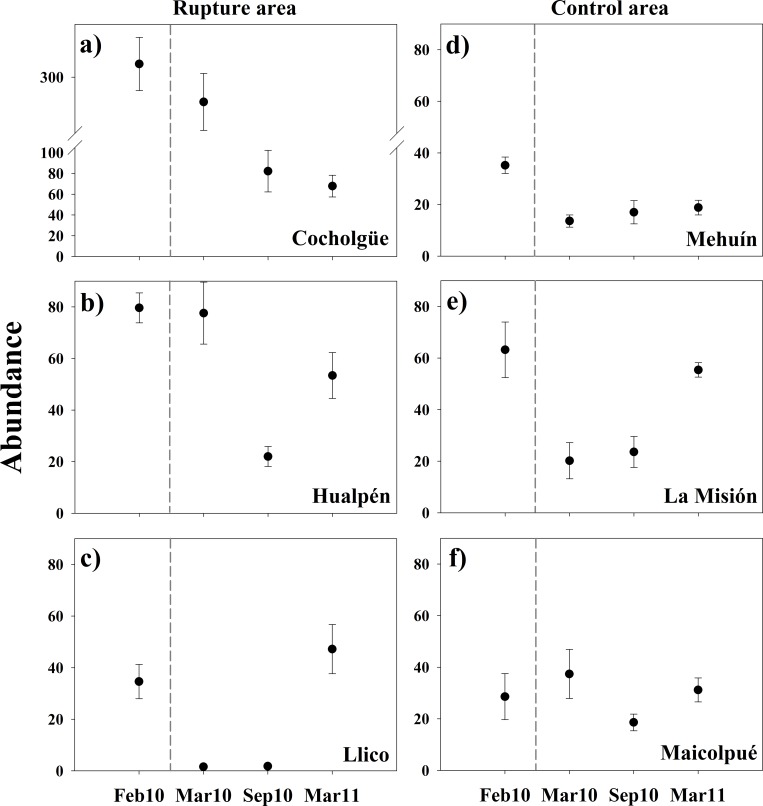
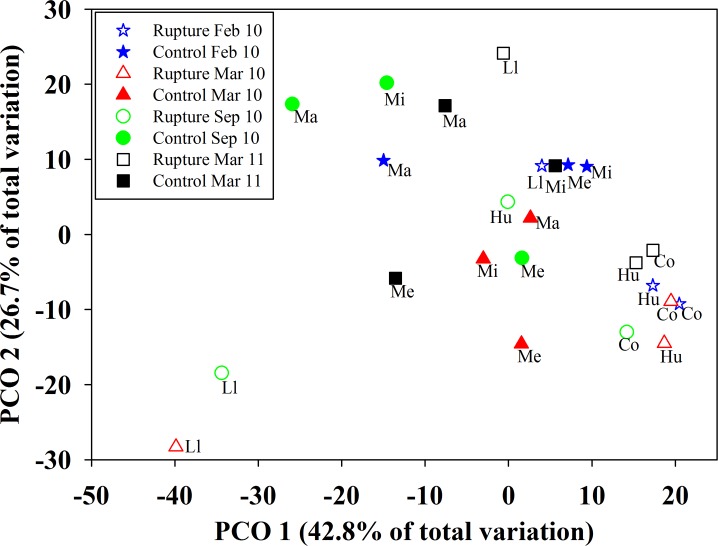
Determining the effects of unpredictable disturbances on dynamic ecological systems is challenged by the paucity of appropriate temporal and spatial coverage of data. On 27 February 2010, an 8.8 Mw mega-earthquake and tsunami struck central Chile and caused coastal land-level changes, massive damage to coastal infrastructure, and widespread mortality of coastal organisms. Wave-exposed sandy beaches showed significant changes of species abundances from before to after the earthquake, but the highly dynamic biotic and abiotic conditions of these habitats make difficult to draw clear-cut conclusions from these patterns. Here, we analysed a beyond-BACI (Before-After Control-Impact) sampling design to test whether the effects of the Maule earthquake on sandy-shore species diversity, abundance, and structure were heterogeneous along the shore. Invertebrate species abundances were quantified before (i.e. February 2010) and after (i.e. March 2010, September 2010, and March 2011) the earthquake at three sandy shores randomly located within the earthquake rupture area and three sites within a "control" area located >400 km southward from epicentre. Immediately after the earthquake took place, the three sites located in the rupture area showed anomalous beach-profile uplifts that did not comply with the erosion (i.e. "negative" uplifts) that regularly occurs during late summer in the region. Species richness, abundance, and community structure significantly varied from before to after the strike, but these patterns of change varied among sites within both areas. Only the site with the strongest and persistent beach-profile uplift within the rupture area showed significant concomitant changes in species richness and community structure; after 13 months, this community showed a similar multivariate structure to the before-disturbance state. This site, in particular, was located in the section of the rupture area that received most of the impact of the after-earthquake tsunami. Therefore, our results suggest that the effects of the Maule mega-earthquake on the ecological communities were spatially heterogeneous and highly localised. We suggest that high mobility and other species' adaptations to the dynamic environmental conditions of sandy beaches might explain the comparatively high resilience of these assemblages. With this work we hope to motivate further experimental research on the role of individual- and population-level properties in the response of sandy-beach communities to interacting sources of disturbances.
Conflict of interest statement
Figures
Similar articles
-
Ecological implications of extreme events: footprints of the 2010 earthquake along the Chilean coast.PLoS One. 2012;7(5):e35348. doi: 10.1371/journal.pone.0035348. Epub 2012 May 2. PLoS One. 2012. PMID: 22567101 Free PMC article.
-
Macrofaunal community structure in Bahía Concepción (Chile) before and after the 8.8 Mw Maule mega-earthquake and tsunami.Mar Environ Res. 2017 Sep;130:233-247. doi: 10.1016/j.marenvres.2017.07.022. Epub 2017 Jul 25. Mar Environ Res. 2017. PMID: 28807410
-
Responses of dune plant communities to continental uplift from a major earthquake: sudden releases from coastal squeeze.PLoS One. 2015 May 6;10(5):e0124334. doi: 10.1371/journal.pone.0124334. eCollection 2015. PLoS One. 2015. PMID: 25946057 Free PMC article.
-
Impacts of earthquakes and tsunamis on marine benthic communities: A review.Mar Environ Res. 2021 Oct;171:105481. doi: 10.1016/j.marenvres.2021.105481. Epub 2021 Sep 16. Mar Environ Res. 2021. PMID: 34555617 Review.
-
An overview of respiratory medicine during the Tsunami Disaster at Tohoku, Japan, on March 11, 2011.Respir Investig. 2012 Dec;50(4):124-8. doi: 10.1016/j.resinv.2012.08.004. Epub 2012 Oct 4. Respir Investig. 2012. PMID: 23199975 Review.
Cited by
-
Post-Disturbance Genetic Changes: The Impact of the 2010 Mega-Earthquake and Tsunami on Chilean Sandy Beach Fauna.Sci Rep. 2019 Oct 2;9(1):14239. doi: 10.1038/s41598-019-50525-1. Sci Rep. 2019. PMID: 31578357 Free PMC article.
-
Earthquake impacts on microcrustacean communities inhabiting groundwater-fed springs alter species-abundance distribution patterns.Sci Rep. 2018 Jan 24;8(1):1501. doi: 10.1038/s41598-018-20011-1. Sci Rep. 2018. PMID: 29367660 Free PMC article.
-
Impact of the 2011 Tohoku Earthquake on the species diversity of rocky intertidal sessile assemblages.Ecol Evol. 2024 Sep 16;14(9):e70293. doi: 10.1002/ece3.70293. eCollection 2024 Sep. Ecol Evol. 2024. PMID: 39290667 Free PMC article.
-
Coral geochemical response to uplift in the aftermath of the 2005 Nias-Simeulue earthquake.Sci Rep. 2024 Apr 15;14(1):8686. doi: 10.1038/s41598-024-57833-1. Sci Rep. 2024. PMID: 38622214 Free PMC article.
References
-
- Underwood AJ (1992) Beyond Baci—the Detection of Environmental Impacts on Populations in the Real, but Variable, World. J Exp Mar Biol Ecol 161: 145–178.
-
- Menge BA, Gouhier TC, Hacker SD, Chan F, Nielsen KJ (2014) Are meta-ecosystems organized hierarchically? A model and test in rocky intertidal habitats. Ecol Monogr 85: 213–233.
-
- Wiens JA (1989) Spatial scaling in ecology. Funct Ecol 3: 385–397.
-
- Terlizzi A, Anderson MJ, Fraschetti S, Benedetti-Cecchi L (2007) Scales of spatial variation in Mediterranean subtidal sessile assemblages at different depths. Mar Ecol Prog Ser 332: 25–39.
-
- Castilla JC, Manriquez PH, Camano A (2010) Effects of rocky shore coseismic uplift and the 2010 Chilean mega-earthquake on intertidal biomarker species. Marine Ecology Progress Series 418: 17–23.
MeSH terms
LinkOut - more resources
Full Text Sources
Other Literature Sources
Medical
