

MRI-based computational hemodynamics in patients with aortic coarctation using the lattice Boltzmann methods: Clinical validation study
- PMID: 27384018
- PMCID: PMC5213689
- DOI: 10.1002/jmri.25366
MRI-based computational hemodynamics in patients with aortic coarctation using the lattice Boltzmann methods: Clinical validation study
Abstract
Purpose: To introduce a scheme based on a recent technique in computational hemodynamics, known as the lattice Boltzmann methods (LBM), to noninvasively measure pressure gradients in patients with a coarctation of the aorta (CoA). To provide evidence on the accuracy of the proposed scheme, the computed pressure drop values are compared against those obtained using the reference standard method of catheterization.
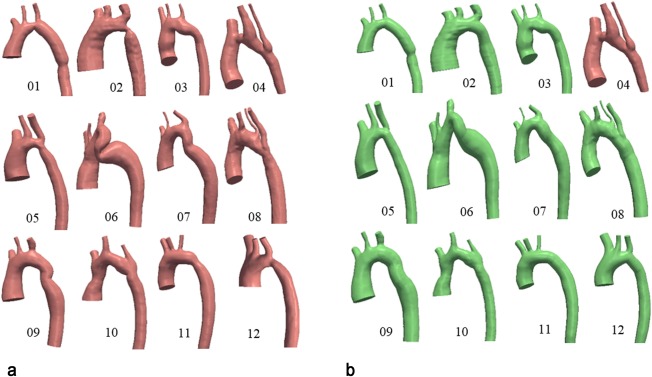
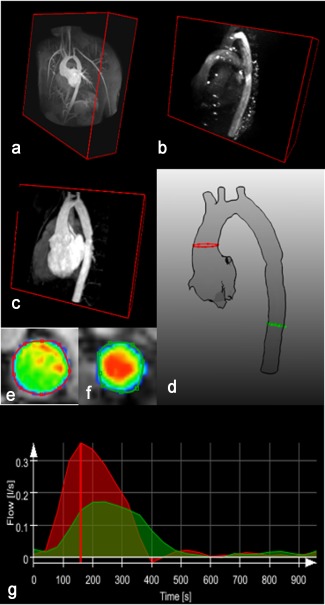
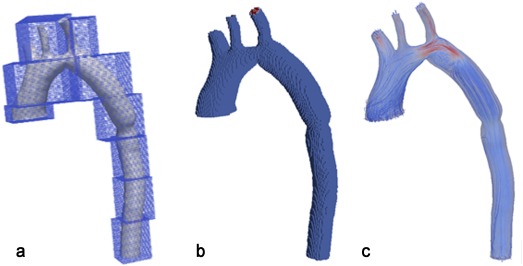
Materials and methods: Pre- and posttreatment LBM-based pressure gradients for 12 patients with CoA were simulated for the time point of peak systole using the open source library OpenLB. Four-dimensional (4D) flow-sensitive phase-contrast MRI at 1.5 Tesla was used to acquire flow and to setup the simulation. The vascular geometry was reconstructed using 3D whole-heart MRI. Patients underwent pre- and postinterventional pressure catheterization as a reference standard.
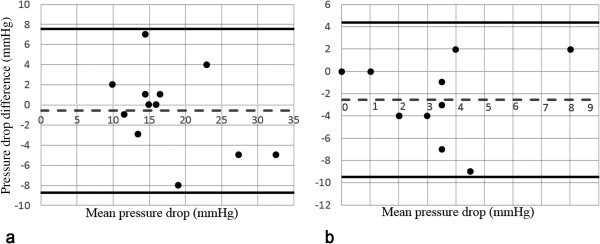
Results: There is a significant linear correlation between the pretreatment catheter pressure drops and those computed based on the LBM simulation, r=.85, P<.001. The bias was -0.58 ± 4.1 mmHg and was not significant ( P=0.64) with a 95% confidence interval (CI) of -3.22 to 2.06. For the posttreatment results, the bias was larger and at -2.54 ± 3.53 mmHg with a 95% CI of -0.17 to -4.91 mmHg.
Conclusion: The results indicate a reasonable agreement between the simulation results and the catheter measurements. LBM-based computational hemodynamics can be considered as an alternative to more traditional computational fluid dynamics schemes for noninvasive pressure calculations and can assist in diagnosis and therapy planning.
Level of evidence: 3 J. Magn. Reson. Imaging 2017;45:139-146.
Keywords: aortic coarctation; catheterization; computational fluid dynamics; lattice Boltzmann method; magnetic resonance imaging; pressure gradient.
© 2016 The Authors Journal of Magnetic Resonance Imaging published by Wiley Periodicals, Inc. on behalf of International Society for Magnetic Resonance in Medicine.
Figures
Similar articles
-
MRI-based computational fluid dynamics for diagnosis and treatment prediction: clinical validation study in patients with coarctation of aorta.J Magn Reson Imaging. 2015 Apr;41(4):909-16. doi: 10.1002/jmri.24639. Epub 2014 Apr 11. J Magn Reson Imaging. 2015. PMID: 24723299
-
Uncertainty Quantification for Non-invasive Assessment of Pressure Drop Across a Coarctation of the Aorta Using CFD.Cardiovasc Eng Technol. 2018 Dec;9(4):582-596. doi: 10.1007/s13239-018-00381-3. Epub 2018 Oct 3. Cardiovasc Eng Technol. 2018. PMID: 30284186
-
Realistic aortic phantom to study hemodynamics using MRI and cardiac catheterization in normal and aortic coarctation conditions.J Magn Reson Imaging. 2016 Sep;44(3):683-97. doi: 10.1002/jmri.25208. Epub 2016 Mar 10. J Magn Reson Imaging. 2016. PMID: 26969867
-
Velocity-encoded cine MR imaging in aortic coarctation: functional assessment of hemodynamic events.Radiographics. 2008 Mar-Apr;28(2):407-16. doi: 10.1148/rg.282075705. Radiographics. 2008. PMID: 18349448 Review.
-
Computational Fluid Dynamics Modeling of Hemodynamic Parameters in the Human Diseased Aorta: A Systematic Review.Ann Vasc Surg. 2020 Feb;63:336-381. doi: 10.1016/j.avsg.2019.04.032. Epub 2019 Jul 22. Ann Vasc Surg. 2020. PMID: 31344467
Cited by
-
Non-Invasive Assessment of Intravascular Pressure Gradients: A Review of Current and Proposed Novel Methods.Diagnostics (Basel). 2018 Dec 29;9(1):5. doi: 10.3390/diagnostics9010005. Diagnostics (Basel). 2018. PMID: 30597993 Free PMC article. Review.
-
Impact of predictive medicine on therapeutic decision making: a randomized controlled trial in congenital heart disease.NPJ Digit Med. 2019 Mar 19;2:17. doi: 10.1038/s41746-019-0085-1. eCollection 2019. NPJ Digit Med. 2019. PMID: 31304365 Free PMC article.
-
Transcriptome analysis of the aortic coarctation area.J Mol Cell Cardiol Plus. 2024 Sep 17;10:100094. doi: 10.1016/j.jmccpl.2024.100094. eCollection 2024 Dec. J Mol Cell Cardiol Plus. 2024. PMID: 39801805 Free PMC article.
-
Four-dimensional Flow Magnetic Resonance Imaging Quantification of Blood Flow in Bicuspid Aortic Valve.J Thorac Imaging. 2020 Nov 1;35(6):383-388. doi: 10.1097/RTI.0000000000000535. J Thorac Imaging. 2020. PMID: 32453278 Free PMC article.
-
Impact of extra-anatomical bypass on coarctation fluid dynamics using patient-specific lumped parameter and Lattice Boltzmann modeling.Sci Rep. 2022 Jun 11;12(1):9718. doi: 10.1038/s41598-022-12894-y. Sci Rep. 2022. PMID: 35690596 Free PMC article.
References
-
- Lindinger A, Schwedler G, Henze HW. Prevalence of congenital heart defects in newborns in Germany: results of the first registration year of the PAN study. Klin Padiatr 2010;222:321–326. - PubMed
-
- Cohen M, Fuster V, Steele PM, Driscoll D, McGoon DC. Coarctation of the aorta. Long‐term follow‐up and prediction of outcome after surgical correction. Circulation 1989;80:840–845. - PubMed
-
- Krueger JJ, Ewert P, Yilmaz S, et al. Magnetic resonance imaging‐guided balloon angioplasty of coarctation of the aorta. Circulation 2006;113:1093–1100. - PubMed
-
- Ralovich K, Itu L, Mihalef V, et al. Hemodynamic assessment of pre‐ and post‐operative aortic coarctation from MRI. Med Image Comput Assist Interv 2012;15:486–493. - PubMed
Publication types
MeSH terms
LinkOut - more resources
Full Text Sources
Other Literature Sources
Research Materials
