. 2016 Jul 7:7:11966.
doi: 10.1038/ncomms11966.

The mechanical response of talin

Affiliations

The mechanical response of talin

Mingxi Yao et al. Nat Commun. .

Abstract

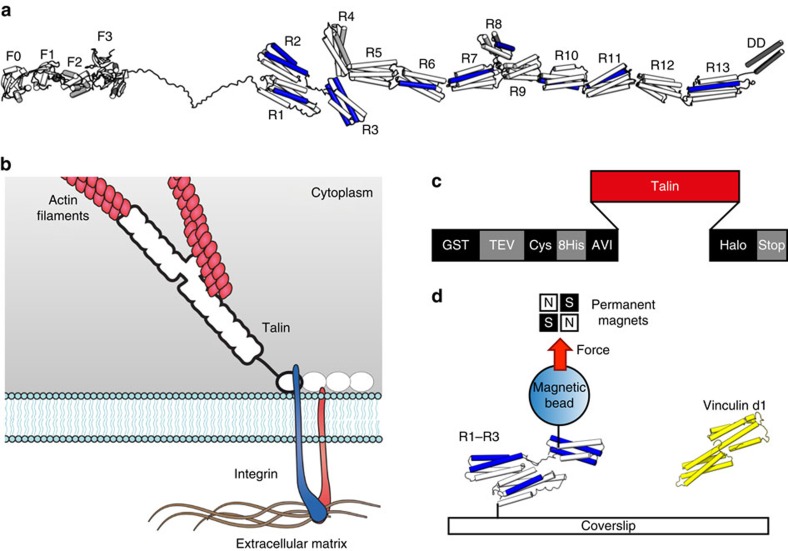
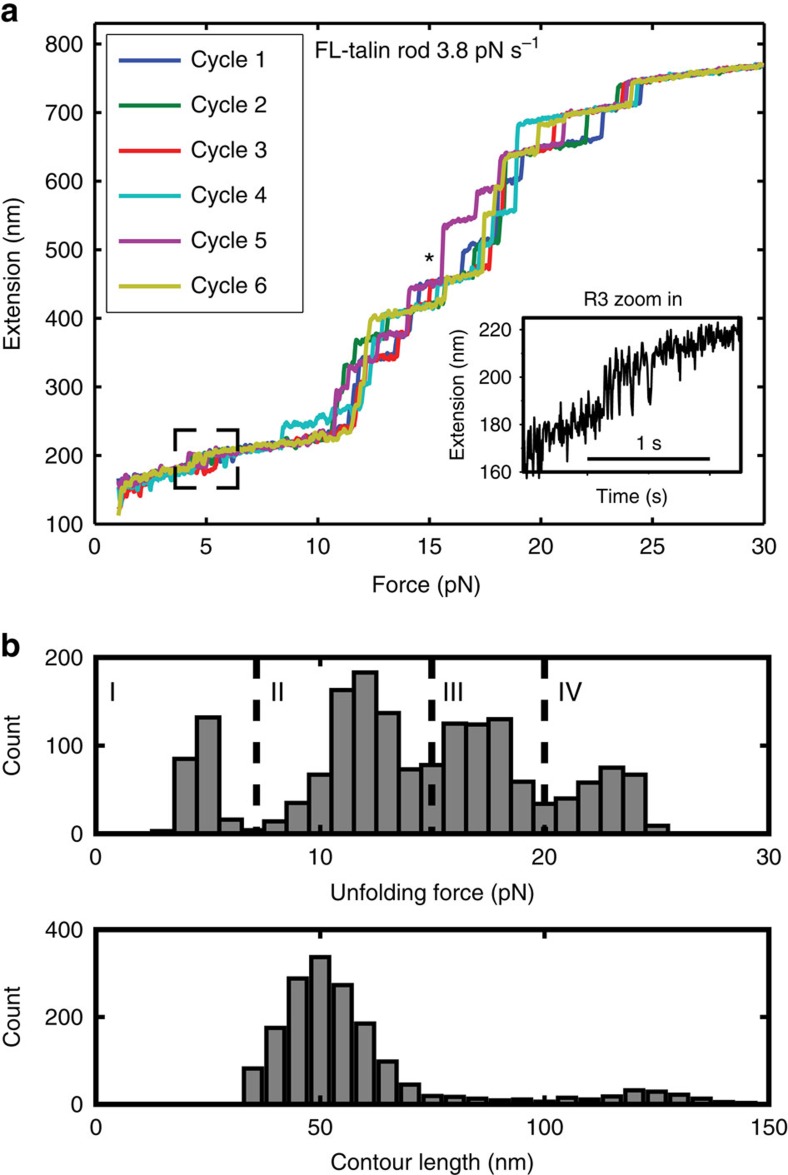
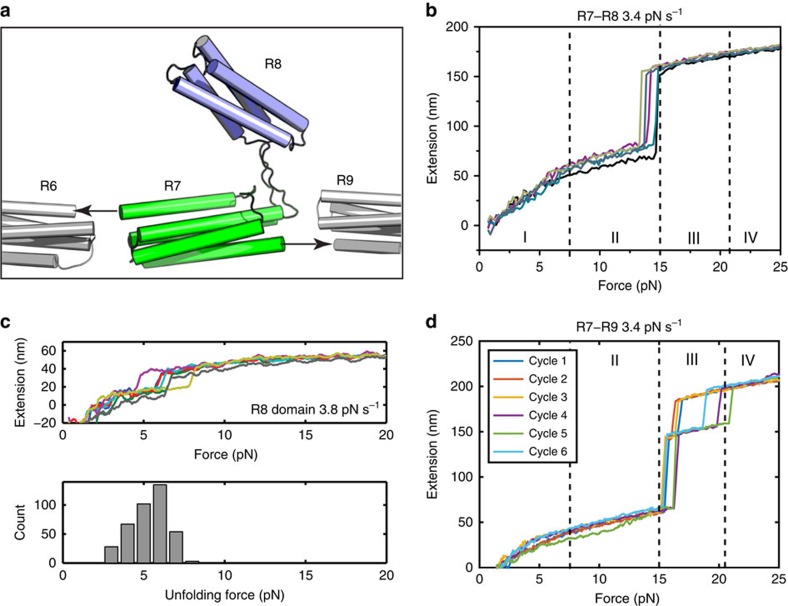
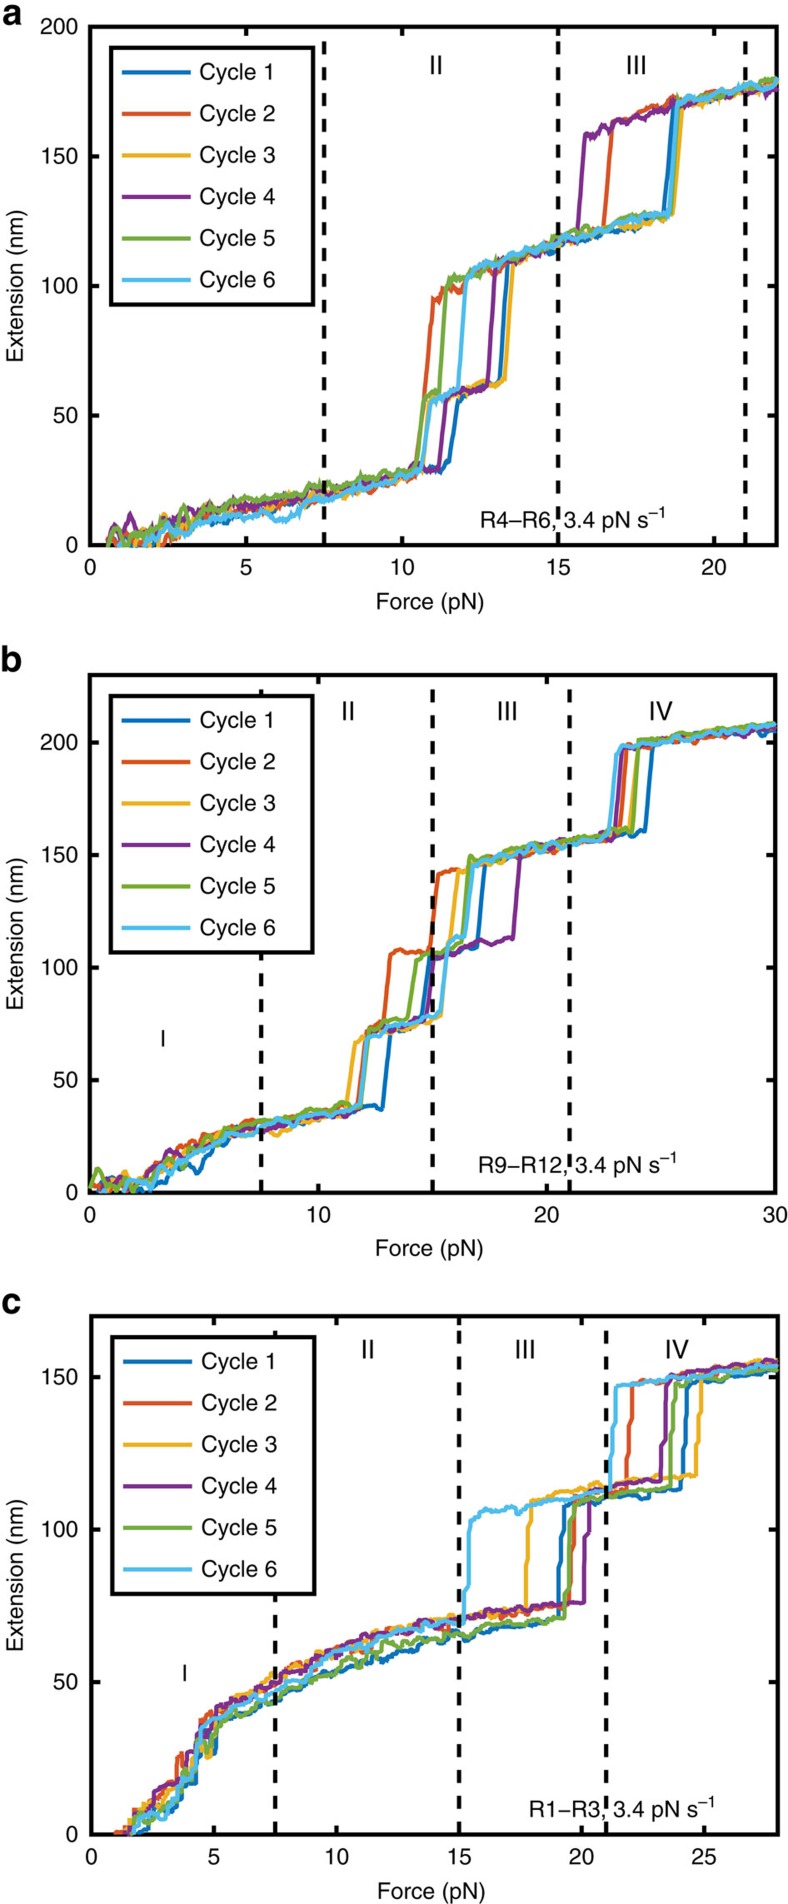
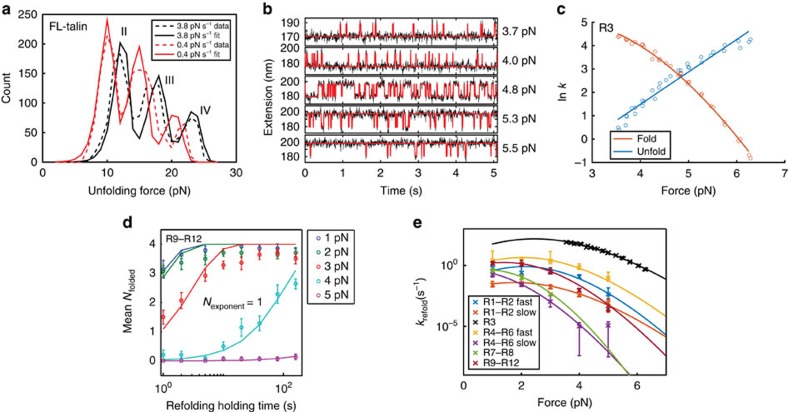
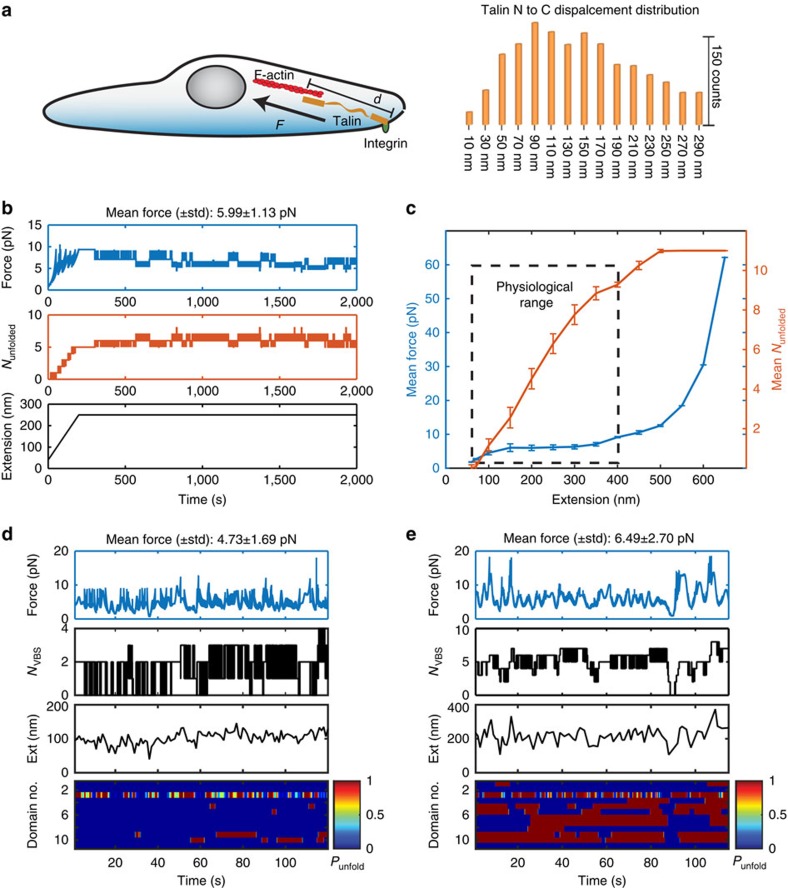
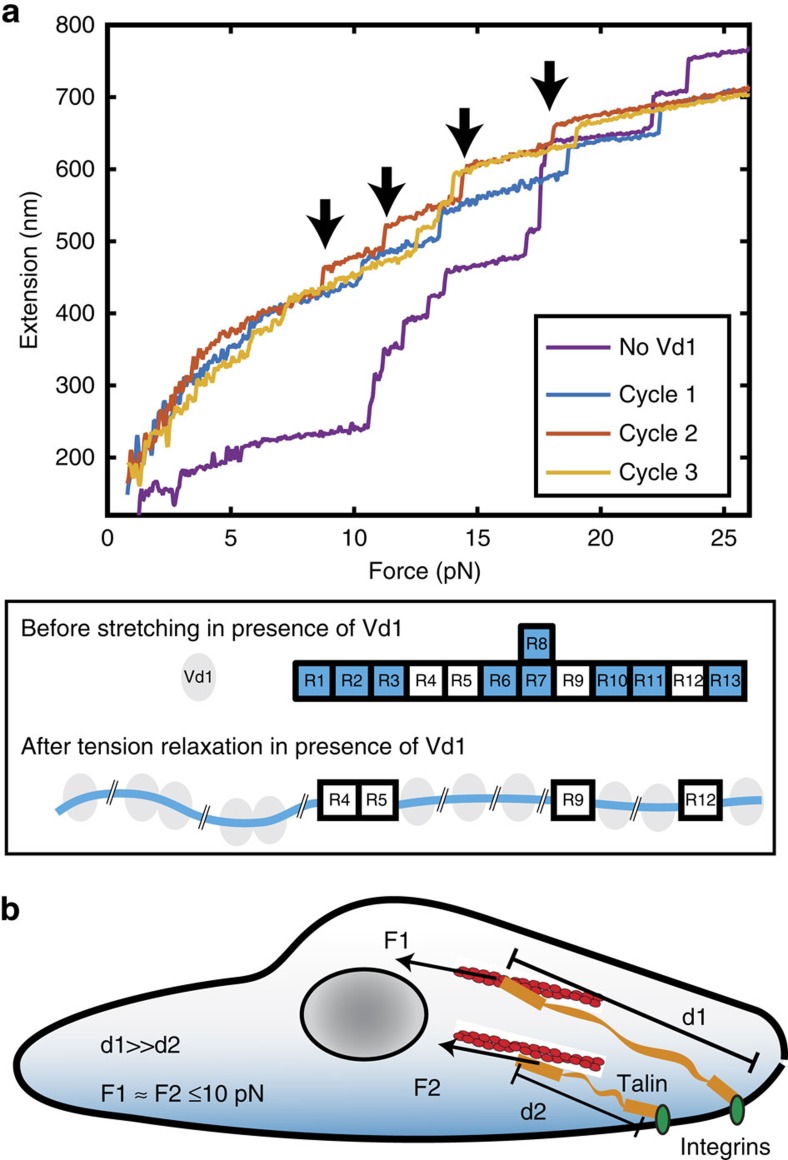
Talin, a force-bearing cytoplasmic adapter essential for integrin-mediated cell adhesion, links the actin cytoskeleton to integrin-based cell-extracellular matrix adhesions at the plasma membrane. Its C-terminal rod domain, which contains 13 helical bundles, plays important roles in mechanosensing during cell adhesion and spreading. However, how the structural stability and transition kinetics of the 13 helical bundles of talin are utilized in the diverse talin-dependent mechanosensing processes remains poorly understood. Here we report the force-dependent unfolding and refolding kinetics of all talin rod domains. Using experimentally determined kinetics parameters, we determined the dynamics of force fluctuation during stretching of talin under physiologically relevant pulling speeds and experimentally measured extension fluctuation trajectories. Our results reveal that force-dependent stochastic unfolding and refolding of talin rod domains make talin a very effective force buffer that sets a physiological force range of only a few pNs in the talin-mediated force transmission pathway.


Figures

Figure 1
Figure 1. Stretching talin.
(a) Structural model of FL-talin. The head domain comprising F0–F3 is separated from the 13 rod domains (R1–R13) via an unstructured 80 residue linker. The last helix is a dimerization domain (DD). The 11 VBS are shown in blue. (b) The classical view of talin's function, linking the ECM:integrin complex to the actin cytoskeleton. In this scenario force is exerted across the talin domains outlined in bold. (c,d) Experimental set-up. (c) The custom ‘stretch vector' used in these experiments. Talin fragments (red) were subcloned into a multiple-cloning site and expressed to produce a protein with a glutathione S-Transferase-tobacco etch virus (GST-TEV) site for rapid purification leaving an N-terminal Avi-tag and C-terminal Halo-tag for stretching. (d) The fragment of interest (R1–R3, for example) was specifically tethered between a glass coverslip and a 2.8-μm diameter paramagnetic bead using Halo-tag and Avi-tag/streptavidin chemistry. Binding partner of interest (vinculin d1, for example) can be added in solution to investigate its force-dependent interaction with talin.
Figure 2
Figure 2. Mechanical properties of talin.
(a) Unfolding force-extension curves of FL-talin rod at the loading rate of 3.8 pN s−1. The different curves represent repeated force cycles from a single protein tether (inset: the R3 unfolding step occurs at 5 pN; scale bar, 1 s). The data were smoothed by 0.05 s time window for clearer presentation. (b) The unfolding force histogram and corresponding unfolded contour length of FL-talin rod constructs (data from three independent tethers) under constant loading rates of 3.8 pN. The unfolding signals are grouped into four groups I–IV based on the distinctive unfolding forces.
Figure 3
Figure 3. Mechanical properties of the talin R8 domain.
(a) Structure of R7–R8 showing the unique domain organization with R8 (blue) inserted into a loop in R7 (green). The arrows show the direction of the neighbouring domains R6 and R9 and the applied force. (b) Unfolding force-extension curves of R7–R8 at 3.4 pN s−1. (c) Unfolding force-extension curve and unfolding force histogram of R8 alone at 3.8 pN s−1. (d) Unfolding force-extension curves of R7–R9 construct at 3.4 pN s−1 loading rate. The data were smoothed by 0.05 s time window for clearer presentation. In b and d, the unfolding force ranges corresponding to respective groups defined in Fig. 2b are indicated.
Figure 4
Figure 4. Mechanical properties of talin sub-segments.
(a,b) Unfolding force-extension curves of (a) R4–R6, (b) R9–R12 and (c) R1–R3 constructs at 3.4 pN s−1 loading rate. The data were smoothed by 0.05 s time window for clarity of presentation. The unfolding force ranges corresponding to respective groups defined in Fig. 2b are indicated.
Figure 5
Figure 5. Quantification of force-dependent talin unfolding/refolding kinetics.
(a) Fitting the unfolding force histograms of group II–IV FL-talin rod domains using the Bell's model at two different loading rates of 3.8 (black) and 0.4 pN s−1 (red). The dashed lines represent experimental data and solid lines represent the least squared sum fitting of the experiment data using Bell's model. (b) The equilibrium unfolding/refolding fluctuation of talin R3 domain at constant forces. The black curve denotes the raw data and the red curve denotes the digitized two-state fluctuations determined by hidden Markov model. (c) The force-dependent unfolding and refolding rates of talin R3 domain determined by analysis of the lifetime distributions of unfolded/folded states under constant forces. The dots represent rates determined from experiments. The red solid line denotes the fitting curve of the refolding rates based on Arrhenius law. The blue solid line denotes the fitting curve of the unfolding rates based on Bell's model. (d) The mean number of refolded domains in R9–R12 after an initially completely unfolded R9–R12 by high force was held at low forces (1–5 pN) for varying time intervals. The refolding rate at each force can be determined by exponential fitting to the data obtained at corresponding force (solid lines). The error bar denotes standard error of the mean. (e) The force-dependent folding rates of talin sub-segment constructs. The error bars denote 95% confidence interval of folding rate estimation. The solid lines denote fitting based on Arrhenius law. For talin R4–R6 and R1–R2, two exponents were required to account for the different refolding kinetics of the individual domains (denoted by ‘fast' and ‘slow') (Supplementary Fig. 3). For talin R9–R12, the refolding kinetics can be described by a single exponent. The refolding rate of R3 (black crosses) and its fitting with Arrhenius law (black solid curve) was determined from constant force measurements (the same data in c, plotted for comparison).
Figure 6
Figure 6. Simulation of force in talin-mediated force transmission pathway.
(a) Illustration of the in vivo talin extension (left panel) and the measured distribution of talin extension in fibroblast cells. (b) Simulation of the force (top panel) and the number of unfolded domains (middle panel) during changing the FL-talin extension as indicated in bottom panel. (c) Average force (data in blue) and number of unfolded domains (data in red) in FL-talin rod as a function of extension. Solid connecting lines are provided for visual guiding. The error bars denote s.d.'s. The black box denotes the physiological range of extension measured in fibroblast cells as shown in a. (d,e) Simulated force fluctuations (top panels) in FL-talin based on two different levels of FL-talin extension fluctuations around (d) 100 and (e) 200 nm recorded from living cells. Talin end-to-end fluctuations measured experimentally from in vivo single-molecule localization studies in fibroblasts are shown in the third panels. First panels: the estimated force fluctuation on the talin rod. Second panels: NVBS denotes the number of exposed VBS. Bottom panels: heat maps showing the unfolding probability of each individual talin rod domain during the time evolution. The talin was significantly more extended in e than in d.
Figure 7
Figure 7. The effect of Vd1 on the FL-talin rod.
(a) The purple curve denotes the force-extension curve of FL-talin rod in the absence of Vd1. The other curves (cycles 1–3) depict three representative unfolding force extension curves in the presence of 100 nM Vd1. The four unfolding steps in cycle 2 are marked by arrows. The data were smoothed by 0.05 s time window for clearer presentation. Bottom: cartoon showing the changes in conformation of talin rod in the presence of Vd1. (b) Talin as a force buffer in the cellular force transmission pathway. Stochastic unfolding/refolding of talin rod domains in response to changes in force ensures that force across the whole talin-mediated, force-transmission pathway can be maintained at a low state (<10 pN) even across very different talin end-to-end extension fluctuations.

References

    1. Paszek M. J. et al.. The cancer glycocalyx mechanically primes integrin-mediated growth and survival. Nature 511, 319–325 (2014). - PMC - PubMed
    1. Lee S. E., Kamm R. D. & Mofrad M. R. K. Force-induced activation of talin and its possible role in focal adhesion mechanotransduction. J. Biomech. 40, 2096–2106 (2007). - PubMed
    1. Hytönen V. P. & Vogel V. How force might activate talin's vinculin binding sites: SMD reveals a structural mechanism. PLoS Comput. Biol. 4, e24 (2008). - PMC - PubMed
    1. del Rio A. et al.. Stretching single talin rod molecules activates vinculin binding. Science 323, 638–641 (2009). - PMC - PubMed
    1. Ciobanasu C., Faivre B. & Le Clainche C. Actomyosin-dependent formation of the mechanosensitive talin-vinculin complex reinforces actin anchoring. Nat. Commun. 5, 3095 (2014). - PMC - PubMed

Publication types

MeSH terms