. 2016 Sep;283(Pt A):330-40.
doi: 10.1016/j.expneurol.2016.06.033. Epub 2016 Jul 3.

A mouse model for testing remyelinating therapies

Affiliations

A mouse model for testing remyelinating therapies

C Brian Bai et al. Exp Neurol. 2016 Sep.

Abstract

Used in combination with immunomodulatory therapies, remyelinating therapies are a viable therapeutic approach for treating individuals with multiple sclerosis. Studies of postmortem MS brains identified greater remyelination in demyelinated cerebral cortex than in demyelinated brain white matter and implicated reactive astrocytes as an inhibitor of white matter remyelination. An animal model that recapitulates these phenotypes would benefit the development of remyelination therapeutics. We have used a modified cuprizone protocol that causes a consistent and robust demyelination of mouse white matter and cerebral cortex. Spontaneous remyelination occurred significantly faster in the cerebral cortex than in white matter and reactive astrocytes were more abundant in white matter lesions. Remyelination of white matter and cerebral cortex was therapeutically enhanced by daily injections of thyroid hormone triiodothyronine (T3). In summary, we describe an in vivo demyelination/remyelination paradigm that can be powered to determine efficacy of therapies that enhance white matter and cortical remyelination.

Keywords: Differential remyelination; Internodal length; Mice; Myelin; Therapeutic; Ultrastructure.


Figures

Figure 1
Figure 1
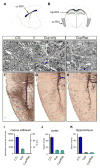
Rapamycin increases cuprizone-induced demyelination. (A) Schematic of a sagittal brain section showing the region of interest (ROI) in corpus callosum (cc). Corpus callosum is in black and fornix in gray. (B) Schematic of a coronal brain section showing the ROIs for hippocampus (hip) and cortex (cx). (C–E) PPD staining of 1 μm sections detects myelinated axons in corpus callosum. (F–H) PLP immunostaining of 30 μm sections detects myelin in cerebral cortex. The ROI is indicated with red dotted lines. (I–K) Quantification of myelinated axons in corpus callosum, and PLP staining in cerebral cortex and hippocampus. Mice were injected with Rap-only (CTL), fed 0.3% cuprizone only (Cup only) or cuprizone plus daily rapamycin injection (Cup/Rap) for 12 weeks. Error bar: standard deviation. Error bar: standard deviation. Scale: 5 μm (C–E), 100 μm (F–H).
Figure 2
Figure 2
GFAP, Iba1, hyaluronan and CD44 expression is increased in corpus callosum following 12 weeks of cup/rap treatment. (A, B) Increased density of GFAP staining in corpus callosum of cup/rap-treated brains compared with CTL. (C, D) High magnification images of GFAP staining in corpus callosum. (E) Quantification of area occupied by GFAP staining in corpus callosum, hippocampus and cortex. **, P<0.01, Student’s t-test. (F, G) Increased Iba1 staining in corpus callosum of cup/rap-treated brains compared with CTL. (H, I) High magnification images of Iba1 staining in corpus callosum. (J) Quantification of area occupied by Iba1 staining. (K–N) Increased immunoreactivity of hyaluronan in corpus callosum, but not in cerebral cortex or hippocampus following cup/rap treatment. (O) Quantification of hyaluronan in different tissues. (P–T) Significant increase in CD44 expression in corpus callosum following cup/rap treatment. Error bar, standard deviation. Scale: 500 μm (A, B, F, G, K, L, P, Q); 200 μm (C, D, H, I, M, N, R, S).
Figure 3
Figure 3
Different rates of remyelination in white and gray matter following cup/rap treatment. (A–E) Changes in the number of myelinated axons in corpus callosum following 12 weeks of demyelination (12W), plus 1 week (12+1W), 3 weeks (12+3W), and 6 weeks (12+6W) of remyelination. (F–J) Changes of PLP staining in hippocampus following demyelination and remyelination. (K) Quantification of remyelinated axons in corpus callosum, and myelin density in cerebral cortex and hippocampus. Note that by 6 weeks of remyelination (12+6W), myelin density in cerebral cortex and hippocampus reached 70 – 80% of CTL while the number of myelinated axons in corpus callosum reached only ~22% of CTL. (L) The rate of remyelination in corpus callosum is significantly slower than that in cortex and hippocampus. For each tissue type (cortex, hippo and corpus callosum), a regression line was generated based on remyelination data of 12W, 12+1W, 12+3W and 12+6W. The slopes of regression line were compared to determine whether one line is significantly different from the other lines using parallel line analysis. (M) Increases in the density of remyelinated axons correlate well with increases in percentage of remyelinated axons in electron micrographs.. The same tissue blocks were used to count myelinated axons in PPD-stained 1 μm-thick sections and in electron micrographs. Note the similar increases (~2 fold) in the density of myelinated axons in μm-thick sections and percentage of myelinated axons in electron microscope from 12+3W to 12+6W. Error bar: standard deviation (K, L); standard error of the mean (M). Scale: 5 μm (A–E); 100 μm (F–J).
Figure 4
Figure 4
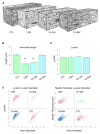
Internodal length is a sensitive ultra-structural readout of early remyelination in corpus callosum. (A) Changes in myelinated axons following demyelination and remyelination in reconstructed 3D-EM image stacks. (B) Quantification of internodal length during early remyelination. Note the significantly shorter internodal length at 12W and 12+3W, but not at 12+6W. (C) Quantification of g-ratios during remyelination. There were no significant differences in g-ratios in the four groups. G-ratios from the same group were averaged. The total numbers of axons included in g-ratio measurement were: 273 for CTL; 280 for12W; 154 for 12+3W and 890 for 12+6W. **, P<0.01. (D) Scatter plots of myelin thickness, g-ratio and axon diameter. Each dot represents one myelinated axon. Error bar: standard deviation of the mean (B, C).
Figure 5
Figure 5
Therapeutic enhancement of remyelination by thyroid hormone T3. (A) Three weeks of daily T3 injection increased remyelination in cortex and hippocampus, but not in corpus callosum. (B) Six weeks of daily T3 injections increased remyelination in cortex, hippocampus and corpus callosum. (C–F) PLP immunostaining of hippocampus and cortex of mice injected for 6 weeks with vehicle (CTL) or T3. (G–H) PPD staining of corpus callosum myelinated axons following 6 weeks of T3 injection. CC, corpus callosum. **, P<0.01; ns, not statistically significant. Error bar: standard deviation. Scale, 100 μm (C–F), 5 μm (G–H).

References

    1. Armstrong RC, Le TQ, Frost EE, Borke RC, Vana AC. Absence of fibroblast growth factor 2 promotes oligodendroglial repopulation of demyelinated white matter. J Neurosci. 2002;22:8574–8585. - PMC - PubMed
    1. Baas D, Bourbeau D, Sarliève LL, Ittel ME, Dussault JH, Puymirat J. Oligodendrocyte maturation and progenitor cell proliferation are independently regulated by thyroid hormone. Glia. 1997;19:324–332. - PubMed
    1. Back SA, Tuohy TMF, Chen H, Wallingford N, Craig A, Struve J, Luo NL, Banine F, Liu Y, Chang A, Trapp BD. Hyaluronan accumulates in demyelinated lesions and inhibits oligodendrocyte progenitor maturation. Nat Med. 2005;11:966–972. - PubMed
    1. Blakemore WF. Remyelination of the superior cerebellar peduncle in old mice following demyelination induced by cuprizone. J Neurol Sci. 1974;22:121–126. - PubMed
    1. Blakemore WF, Franklin RJM. Remyelination in experimental models of toxin-induced demyelination. Curr Top Microbiol Immunol. 2008;318:193–212. - PubMed

Publication types

MeSH terms