

CD25+ FoxP3+ Memory CD4 T Cells Are Frequent Targets of HIV Infection In Vivo
- PMID: 27384654
- PMCID: PMC5044822
- DOI: 10.1128/JVI.00612-16
CD25+ FoxP3+ Memory CD4 T Cells Are Frequent Targets of HIV Infection In Vivo
Abstract
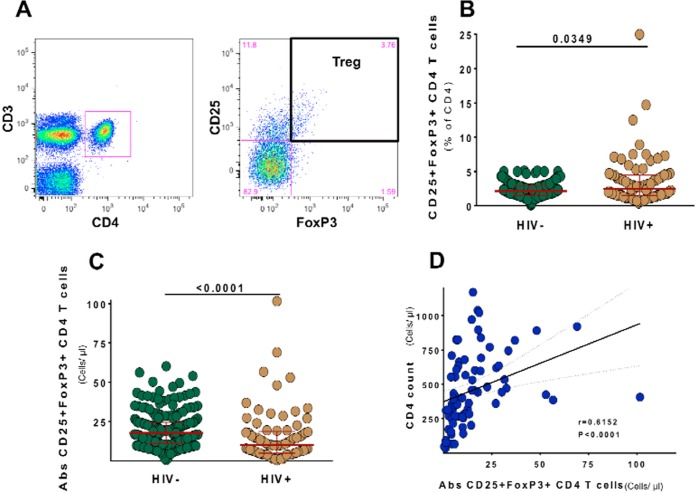
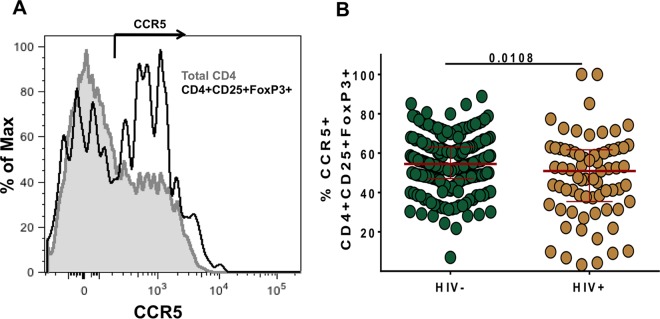
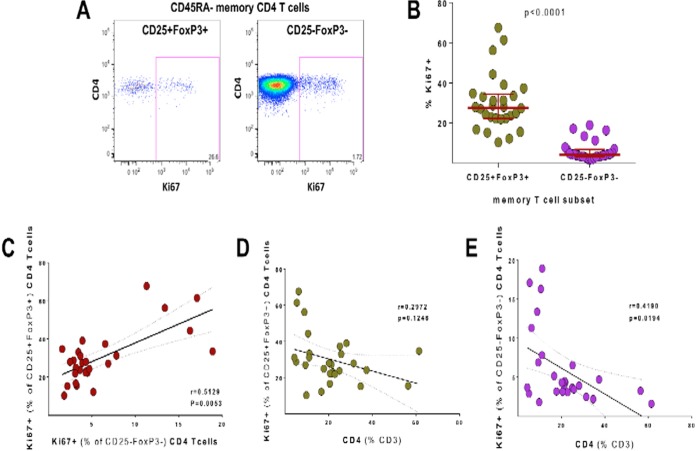
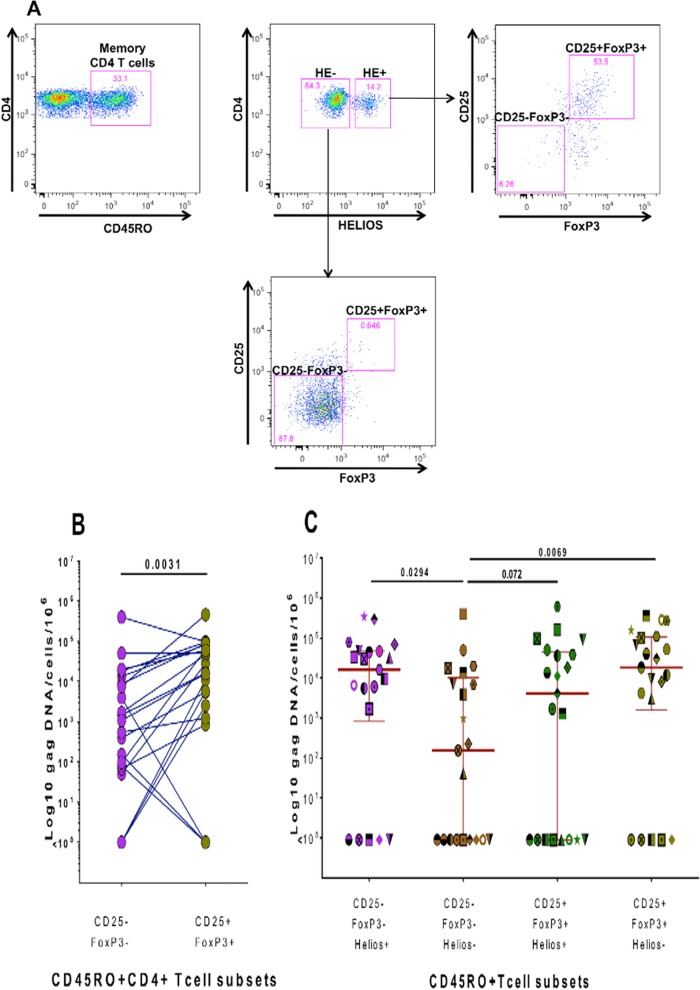
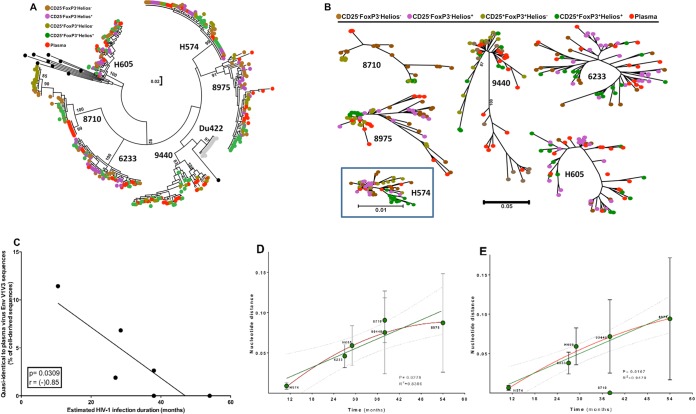
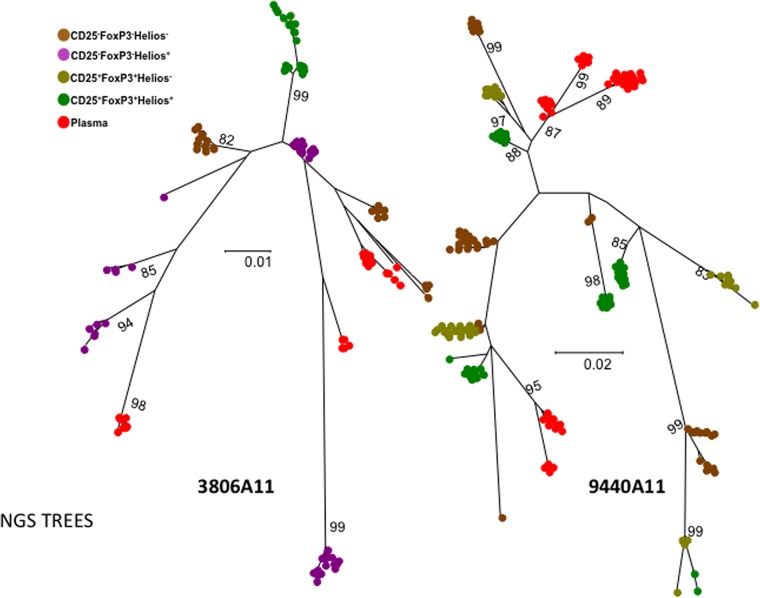
Interleukin 2 (IL-2) signaling through the IL-2 receptor alpha chain (CD25) facilitates HIV replication in vitro and facilitates homeostatic proliferation of CD25(+) FoxP3(+) CD4(+) T cells. CD25(+) FoxP3(+) CD4(+) T cells may therefore constitute a suitable subset for HIV infection and plasma virion production. CD25(+) FoxP3(+) CD4(+) T cell frequencies, absolute numbers, and the expression of CCR5 and cell cycle marker Ki67 were studied in peripheral blood from HIV(+) and HIV(-) study volunteers. Different memory CD4(+) T cell subsets were then sorted for quantification of cell-associated HIV DNA and phylogenetic analyses of the highly variable EnvV1V3 region in comparison to plasma-derived virus sequences. In HIV(+) subjects, 51% (median) of CD25(+) FoxP3(+) CD4(+) T cells expressed the HIV coreceptor CCR5. Very high frequencies of Ki67(+) cells were detected in CD25(+) FoxP3(+) memory CD4(+) T cells (median, 27.6%) in comparison to CD25(-) FoxP3(-) memory CD4(+) T cells (median, 4.1%; P < 0.0001). HIV DNA content was 15-fold higher in CD25(+) FoxP3(+) memory CD4(+) T cells than in CD25(-) FoxP3(-) T cells (P = 0.003). EnvV1V3 sequences derived from CD25(+) FoxP3(+) memory CD4(+) T cells did not preferentially cluster with plasma-derived sequences. Quasi-identical cell-plasma sequence pairs were rare, and their proportion decreased with the estimated HIV infection duration. These data suggest that specific cellular characteristics of CD25(+) FoxP3(+) memory CD4(+) T cells might facilitate efficient HIV infection in vivo and passage of HIV DNA to cell progeny in the absence of active viral replication. The contribution of this cell population to plasma virion production remains unclear.
Importance: Despite recent advances in the understanding of AIDS virus pathogenesis, which cell subsets support HIV infection and replication in vivo is incompletely understood. In vitro, the IL-2 signaling pathway and IL-2-dependent cell cycle induction are essential for HIV infection of stimulated T cells. CD25(+) FoxP3(+) memory CD4 T cells, often referred to as regulatory CD4 T cells, depend on IL-2 signaling for homeostatic proliferation in vivo Our results show that CD25(+) FoxP3(+) memory CD4(+) T cells often express the HIV coreceptor CCR5, are significantly more proliferative, and contain more HIV DNA than CD25(-) FoxP3(-) memory CD4 T cell subsets. The specific cellular characteristics of CD25(+) FoxP3(+) memory CD4(+) T cells probably facilitate efficient HIV infection in vivo and passage of HIV DNA to cell progeny in the absence of active viral replication. However, the contribution of this cell subset to plasma viremia remains unclear.
Copyright © 2016, American Society for Microbiology. All Rights Reserved.
Figures
Similar articles
-
Infection of CD127+ (interleukin-7 receptor+) CD4+ cells and overexpression of CTLA-4 are linked to loss of antigen-specific CD4 T cells during primary human immunodeficiency virus type 1 infection.J Virol. 2006 Oct;80(20):10162-72. doi: 10.1128/JVI.00249-06. J Virol. 2006. PMID: 17005693 Free PMC article.
-
Longitudinal analysis of subtype C envelope tropism for memory CD4+ T cell subsets over the first 3 years of untreated HIV-1 infection.Retrovirology. 2020 Aug 6;17(1):24. doi: 10.1186/s12977-020-00532-2. Retrovirology. 2020. PMID: 32762760 Free PMC article.
-
FoxP3+ CD25+ CD8+ T-cell induction during primary simian immunodeficiency virus infection in cynomolgus macaques correlates with low CD4+ T-cell activation and high viral load.J Virol. 2007 Dec;81(24):13444-55. doi: 10.1128/JVI.01466-07. Epub 2007 Sep 26. J Virol. 2007. PMID: 17898053 Free PMC article.
-
CD127 and CD25 expression defines CD4+ T cell subsets that are differentially depleted during HIV infection.J Immunol. 2008 Apr 15;180(8):5582-92. doi: 10.4049/jimmunol.180.8.5582. J Immunol. 2008. PMID: 18390743 Free PMC article.
-
CD4+CD25+CD127- assessment as a surrogate phenotype for FOXP3+ regulatory T cells in HIV-1 infected viremic and aviremic subjects.Cytometry B Clin Cytom. 2013 Jan-Feb;84(1):50-4. doi: 10.1002/cyto.b.21047. Epub 2012 Sep 27. Cytometry B Clin Cytom. 2013. PMID: 23019018
Cited by
-
HIV Persistence in Adipose Tissue Reservoirs.Curr HIV/AIDS Rep. 2018 Feb;15(1):60-71. doi: 10.1007/s11904-018-0378-z. Curr HIV/AIDS Rep. 2018. PMID: 29423731 Free PMC article. Review.
-
Helios + Regulatory T cell frequencies are correlated with control of viral replication and recovery of absolute CD4 T cells counts in early HIV-1 infection.BMC Immunol. 2017 Dec 16;18(1):50. doi: 10.1186/s12865-017-0235-7. BMC Immunol. 2017. PMID: 29246111 Free PMC article.
-
Single-cell analysis identifies cellular markers of the HIV permissive cell.PLoS Pathog. 2017 Oct 26;13(10):e1006678. doi: 10.1371/journal.ppat.1006678. eCollection 2017 Oct. PLoS Pathog. 2017. PMID: 29073251 Free PMC article.
-
CCL2: a Chemokine Potentially Promoting Early Seeding of the Latent HIV Reservoir.mBio. 2022 Oct 26;13(5):e0189122. doi: 10.1128/mbio.01891-22. Epub 2022 Sep 8. mBio. 2022. PMID: 36073812 Free PMC article.
-
Phenotypic characterization of regulatory T cells from antiretroviral-naive HIV-1-infected people.Immunology. 2017 Aug;151(4):405-416. doi: 10.1111/imm.12738. Epub 2017 May 18. Immunology. 2017. PMID: 28375551 Free PMC article.
References
-
- Verhofstede C, Reniers S, Van Wanzeele F, Plum J. 1994. Evaluation of proviral copy number and plasma RNA level as early indicators of progression in HIV-1 infection: correlation with virological and immunological markers of disease. AIDS 8:1421–1427. doi: 10.1097/00002030-199410000-00008. - DOI - PubMed
-
- Brenchley JM, Schacker TW, Ruff LE, Price DA, Taylor JH, Beilman GJ, Nguyen PL, Khoruts A, Larson M, Haase AT, Douek DC. 2004. CD4+ T cell depletion during all stages of HIV disease occurs predominantly in the gastrointestinal tract. J Exp Med 200:749–759. doi: 10.1084/jem.20040874. - DOI - PMC - PubMed
Publication types
MeSH terms
Substances
Grants and funding
LinkOut - more resources
Full Text Sources
Other Literature Sources
Medical
Molecular Biology Databases
Research Materials
