. 2016 Aug 26;90(18):8251-65.
doi: 10.1128/JVI.00969-16. Print 2016 Sep 15.

Genetic Lineage and Reassortment of Influenza C Viruses Circulating between 1947 and 2014

Affiliations

Genetic Lineage and Reassortment of Influenza C Viruses Circulating between 1947 and 2014

Yoko Matsuzaki et al. J Virol. .

Abstract

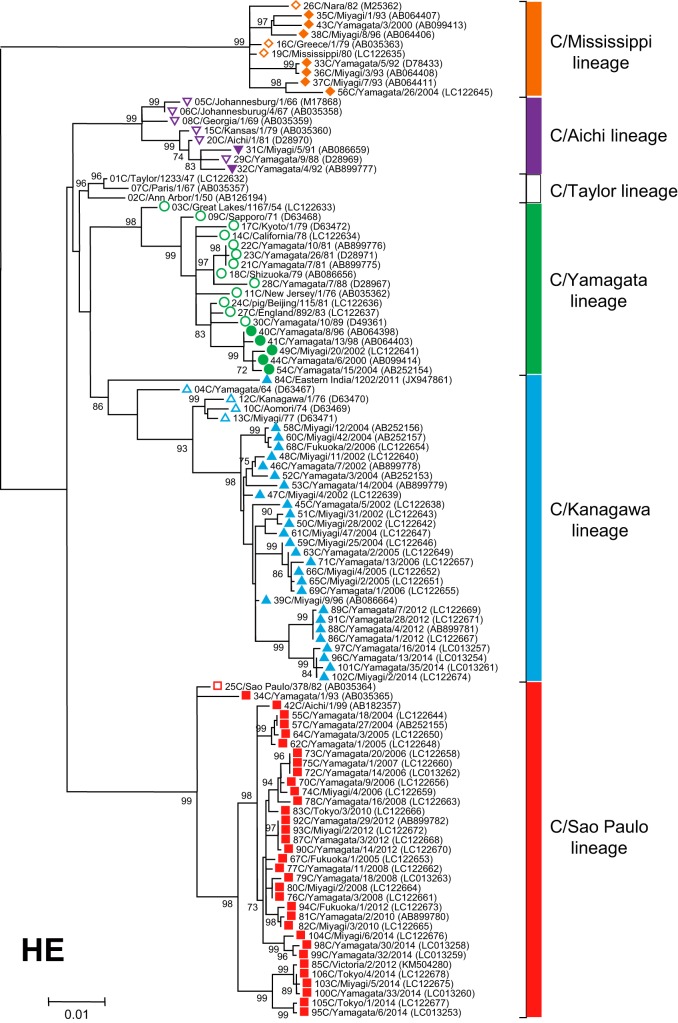
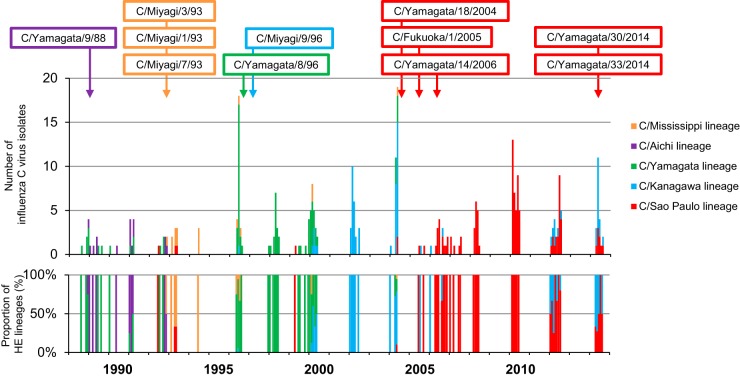
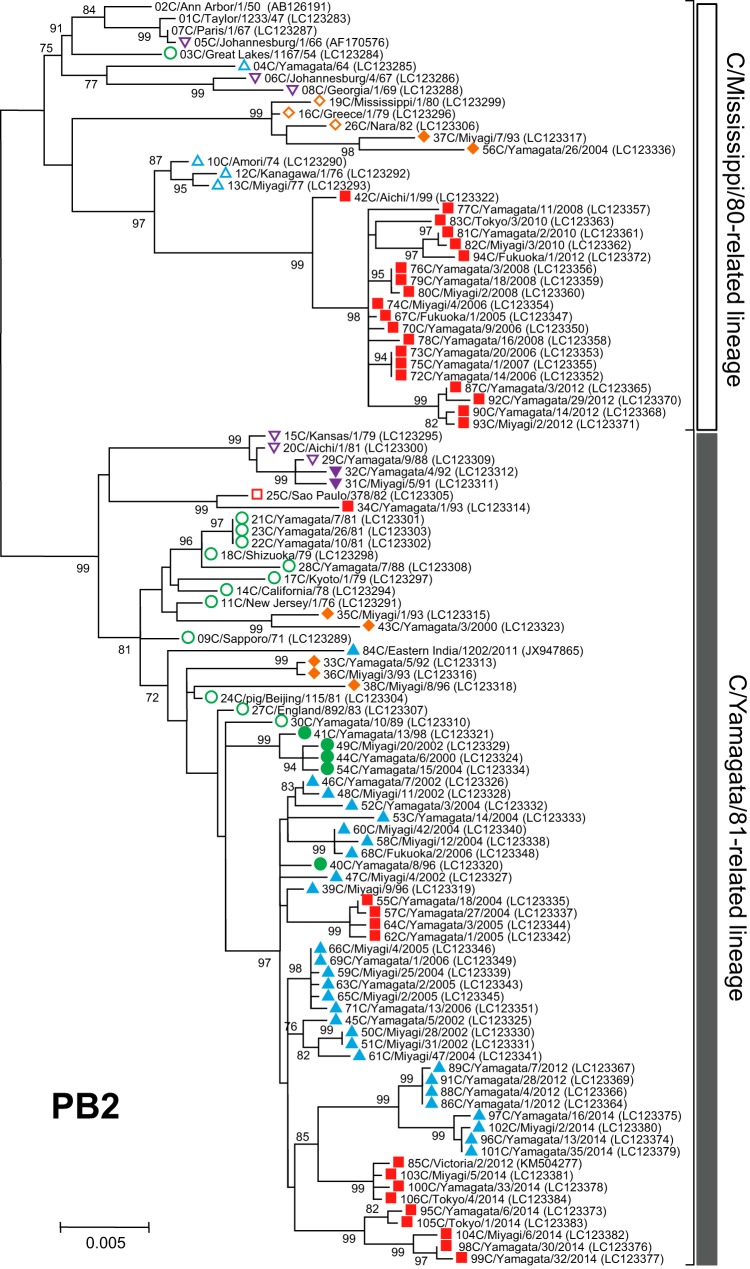
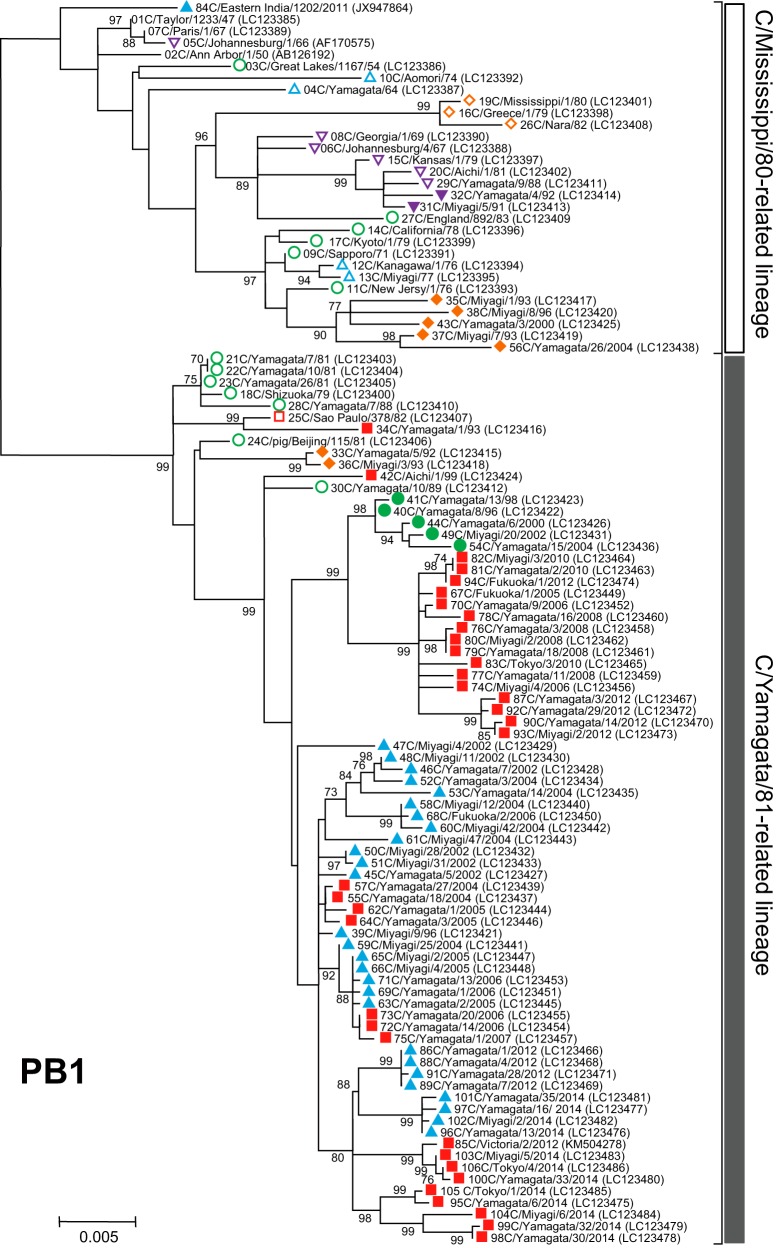
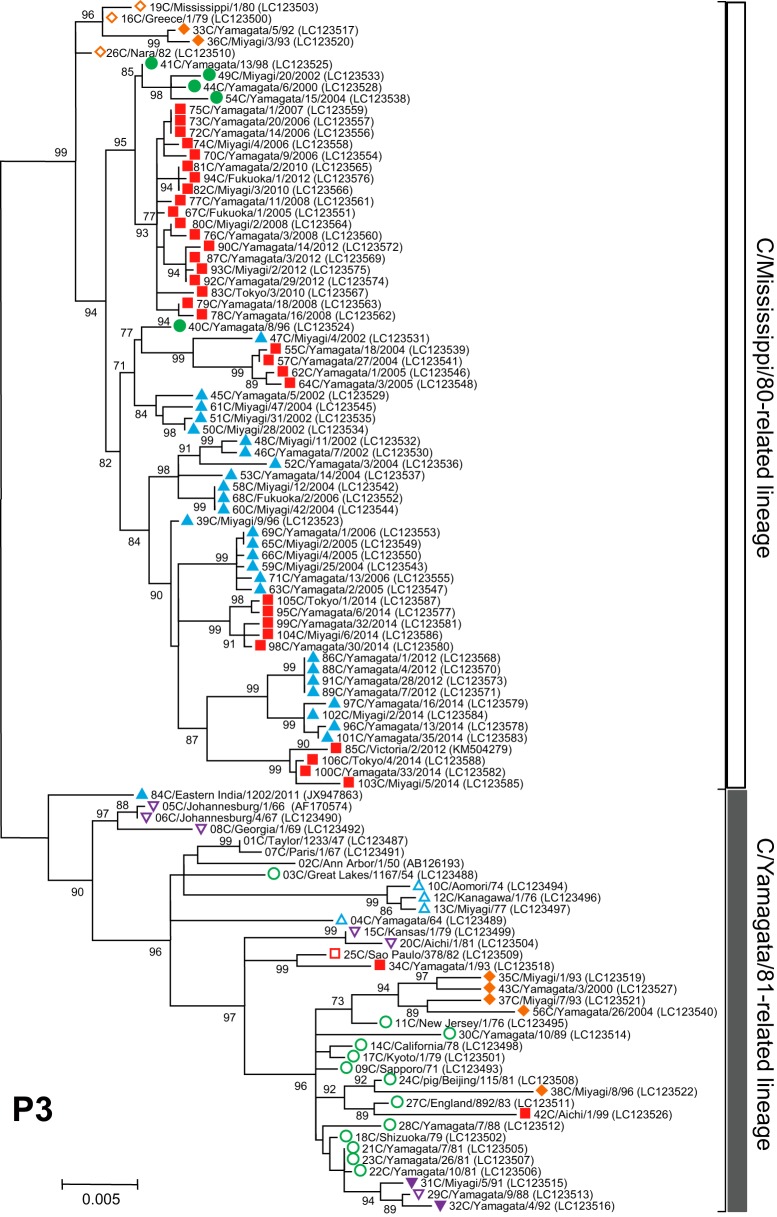
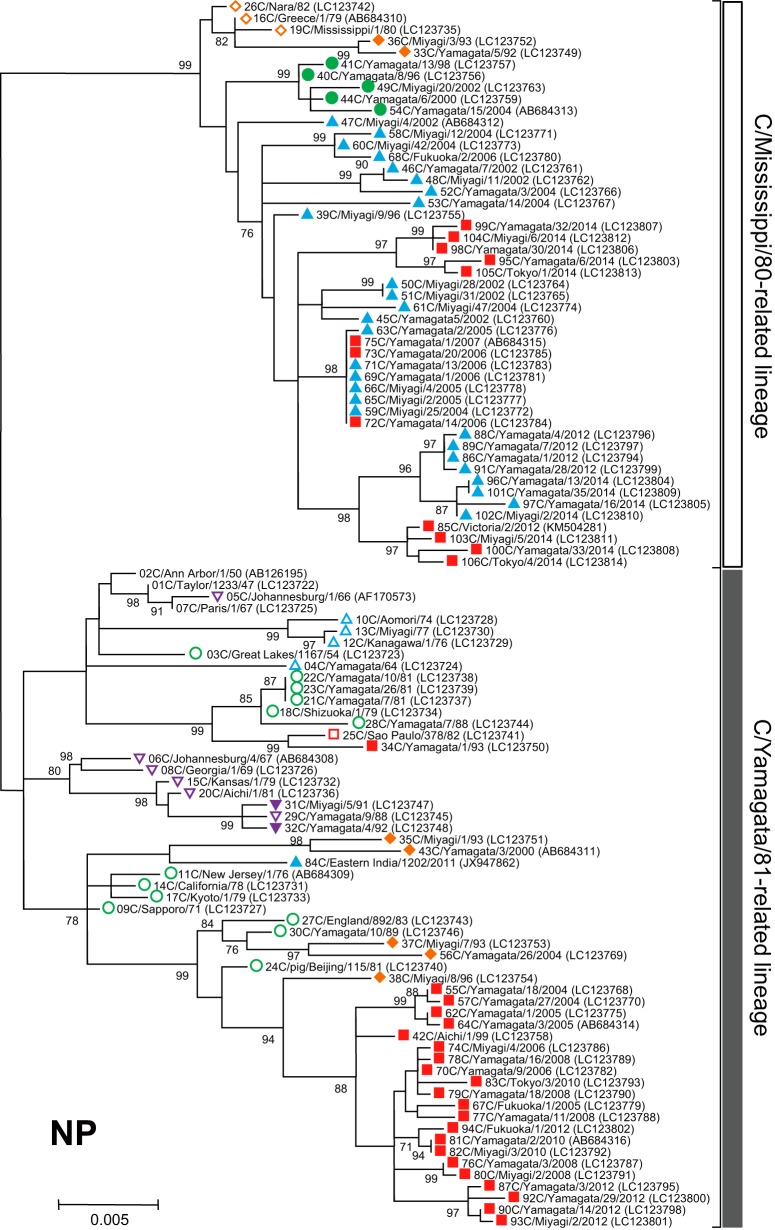
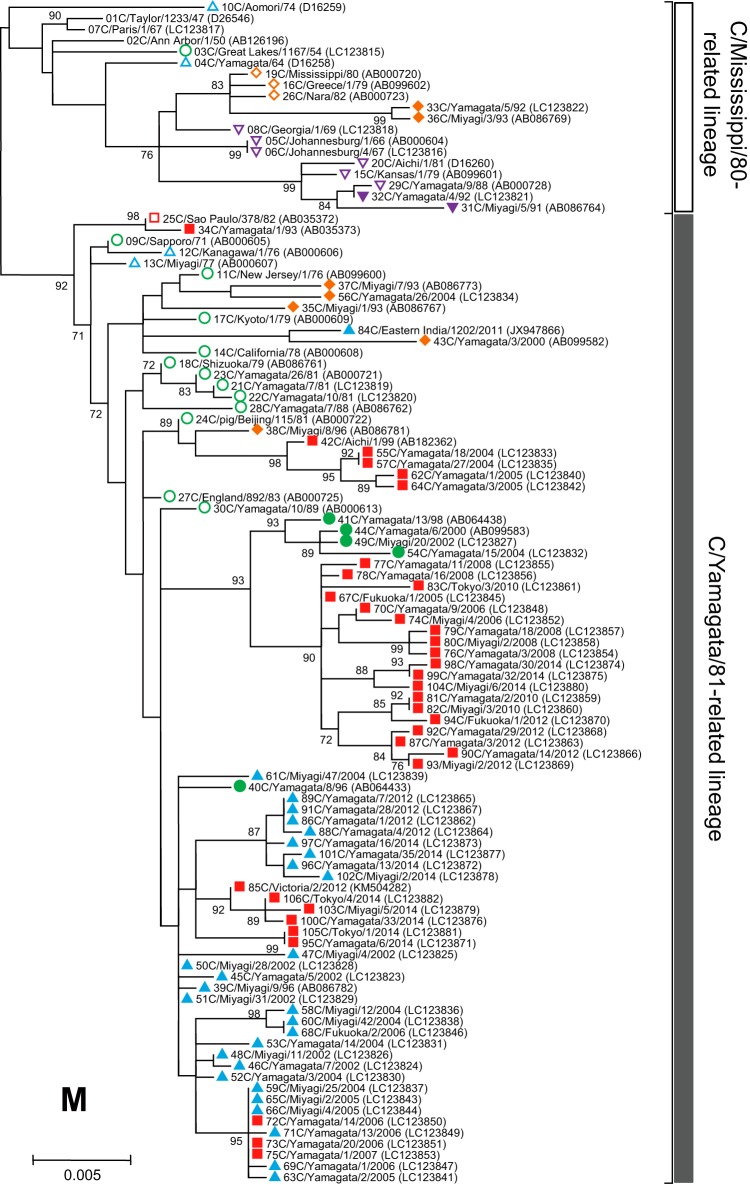
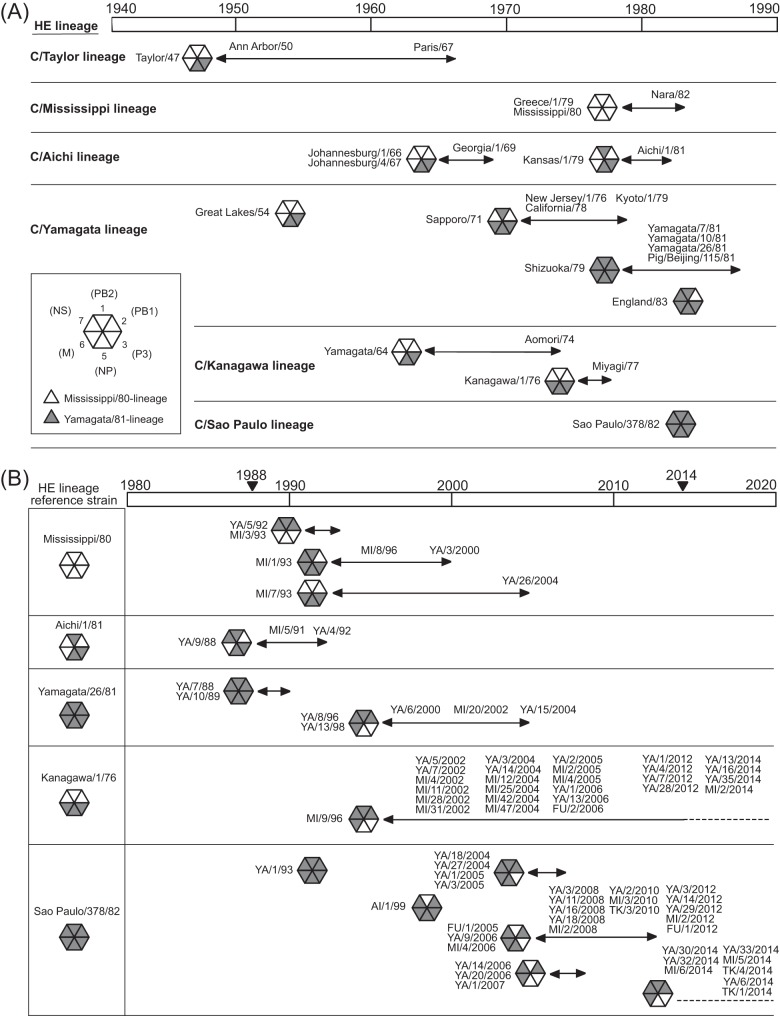
Since influenza C virus was first isolated in 1947, the virus has been only occasionally isolated by cell culture; there are only four strains for which complete genome sequences are registered. Here, we analyzed a total of 106 complete genomes, ranging from the first isolate from 1947 to recent isolates from 2014, to determine the genetic lineages of influenza C virus, the reassortment events, and the rates of nucleotide substitution. The results showed that there are six lineages, named C/Taylor, C/Mississippi, C/Aichi, C/Yamagata, C/Kanagawa, and C/Sao Paulo. They contain both antigenic and genetic lineages of the hemagglutinin-esterase (HE) gene, and the internal genes PB2, PB1, P3, NP, M, and NS are divided into two major lineages, a C/Mississippi/80-related lineage and a C/Yamagata/81-related lineage. Reassortment events were found over the entire period of 68 years. Several outbreaks of influenza C virus between 1990 and 2014 in Japan consisted of reassortant viruses, suggesting that the genomic constellation is related to influenza C virus epidemics. The nucleotide sequences were highly homologous to each other. The minimum percent identity between viruses ranged from 91.1% for the HE gene to 96.1% for the M gene, and the rate of nucleotide substitution for the HE gene was the highest, at 5.20 × 10(-4) substitutions/site/year. These results indicate that reassortment is an important factor that increases the genetic diversity of influenza C virus, resulting in its ability to prevail in humans. IMPORTANCE Influenza C virus is a pathogen that causes acute respiratory illness in children and results in hospitalization of infants. We previously demonstrated (Y. Matsuzaki et al., J Clin Virol 61:87-93, 2014, http://dx.doi.org/10.1016/j.jcv.2014.06.017) that periodic epidemics of this virus occurred in Japan between 1996 and 2014 and that replacement of the dominant antigenic group occurred every several years as a result of selection by herd immunity. However, the antigenicity of the HE glycoprotein is highly stable, and antigenic drift has not occurred for at least 30 years. Here, we analyzed a total of 106 complete genomes spanning 68 years for the first time, and we found that influenza C viruses are circulating worldwide while undergoing reassortment as well as selection by herd immunity, resulting in an increased ability to prevail in humans. The results presented in this study contribute to the understanding of the evolution, including reassortment events, underlying influenza C virus epidemics.


Figures

FIG 1
FIG 1
Phylogenetic tree of the influenza C virus hemagglutinin-esterase (HE) gene. The coding region without a signal peptide in RNA segment 4 was used for the analysis (corresponding to nucleotide positions 64 to 1989 of the HE gene). Numbers below or above the branches indicate the confidence level of the bootstrap analysis with 1,000 replicates as a percentage, and values greater than 70% are shown. Strains belonging to each lineage are marked with the corresponding symbol on the head of the strain name: the C/Mississippi lineage is represented as an orange diamond, the C/Aichi lineage is represented as a purple inverse triangle, the C/Yamagata lineage is represented as a green circle, the C/Kanagawa lineage is represented as a blue triangle, and the C/Sao Paulo lineage is represented as a red square. Strains isolated before 1990 are indicated by open symbols, and strains isolated after 1990 are marked with filled symbols. Numerals prior to the strain name indicate the order of the isolation year. GenBank/DDBJ accession numbers are presented in parentheses.
FIG 2
FIG 2
Monthly distribution of influenza C viruses in Japan between 1988 and 2014. The number of influenza C virus isolates was obtained from our previous reports: Matsuzaki et al. (17, 19, 20, 21, 22, 24, 32), Kimura et al. (18), and Tanaka et al. (25). The colored open squares indicate the representative reassortant viruses that emerged during influenza C virus epidemics.
FIG 3
FIG 3
Phylogenetic trees of internal genes of influenza C viruses. The nucleotide sequence of the whole coding region was used for the analysis: nucleotide positions 22 to 2343 for the PB2 gene, 18 to 2279 for the PB1 gene, 22 to 2148 for the P3 gene, 30 to 1724 for the NP gene, 26 to 1147 for the M gene, and 28 to 886 for the NS gene. Numbers below or above the branches indicate the confidence levels of bootstrap analysis with 1,000 replicates as a percentage, and values greater than 70% are shown. Each lineage of the HE gene is shown with the corresponding symbol on the head of the strain name. The C/Mississippi lineage is represented as an orange diamond, the C/Aichi lineage is represented as a purple inverse triangle, the C/Yamagata lineage is represented as a green circle, the C/Kanagawa lineage is represented as a blue triangle, and the C/Sao Paulo lineage is represented as a red square. Strains isolated before 1990 are indicated by open symbols, and strains isolated after 1990 are marked with filled symbols. Numerals prior to the strain name indicate the order of the isolation year. GenBank/DDBJ accession numbers are presented in parentheses.
FIG 3
FIG 3
Phylogenetic trees of internal genes of influenza C viruses. The nucleotide sequence of the whole coding region was used for the analysis: nucleotide positions 22 to 2343 for the PB2 gene, 18 to 2279 for the PB1 gene, 22 to 2148 for the P3 gene, 30 to 1724 for the NP gene, 26 to 1147 for the M gene, and 28 to 886 for the NS gene. Numbers below or above the branches indicate the confidence levels of bootstrap analysis with 1,000 replicates as a percentage, and values greater than 70% are shown. Each lineage of the HE gene is shown with the corresponding symbol on the head of the strain name. The C/Mississippi lineage is represented as an orange diamond, the C/Aichi lineage is represented as a purple inverse triangle, the C/Yamagata lineage is represented as a green circle, the C/Kanagawa lineage is represented as a blue triangle, and the C/Sao Paulo lineage is represented as a red square. Strains isolated before 1990 are indicated by open symbols, and strains isolated after 1990 are marked with filled symbols. Numerals prior to the strain name indicate the order of the isolation year. GenBank/DDBJ accession numbers are presented in parentheses.
FIG 4
FIG 4
Internal genome constellations of the influenza C viruses for which the full genome was analyzed in this study. (A) Influenza C viruses circulating between 1947 and 1983 around the world are shown. (B) Influenza C viruses isolated in Japan from 1988 to 2014 are shown. Virus particles are indicated by hexagons containing triangles for the six internal gene segments (clockwise: PB2, PB1, P3, NP, M, and NS) and colored according to their lineage: white, Mississippi/80-related lineage; black, Yamagata/81-related lineage. Abbreviations in panel B: YA, Yamagata; MI, Miyagi; AI, Aichi; FU, Fukuoka; TK, Tokyo.

References

    1. Taylor RM. 1949. Studies on survival of influenza virus between epidemics and antigenic variants of the virus. Am J Public Health Nations Health 39:171–178. doi:10.2105/AJPH.39.2.171. - DOI - PMC - PubMed
    1. Guo YJ, Jin FG, Wang P, Wang M, Zhu JM. 1983. Isolation of influenza C virus from pigs and experimental infection of pigs with influenza C virus. J Gen Virol 64:177–182. doi:10.1099/0022-1317-64-1-177. - DOI - PubMed
    1. Katagiri S, Ohizumi A, Homma M. 1983. An outbreak of type C influenza in a children's home. J Infect Dis 148:51–56. doi:10.1093/infdis/148.1.51. - DOI - PubMed
    1. Moriuchi H, Katsushima N, Nishimura H, Nakamura K, Numazaki Y. 1991. Community-acquired influenza C virus infection in children. J Pediatr 118:235–238. doi:10.1016/S0022-3476(05)80489-5. - DOI - PubMed
    1. Matsuzaki Y, Katsushima N, Nagai Y, Shoji M, Itagaki T, Sakamoto M, Kitaoka S, Mizuta K, Nishimura H. 2006. Clinical features of influenza C virus infection in children. J Infect Dis 193:1229–1235. doi:10.1086/502973. - DOI - PubMed

Publication types

MeSH terms

LinkOut - more resources