. 2016 Sep 1;27(17):2662-74.
doi: 10.1091/mbc.E16-05-0286. Epub 2016 Jul 6.

AMPK activity regulates trafficking of mitochondria to the leading edge during cell migration and matrix invasion

Affiliations

AMPK activity regulates trafficking of mitochondria to the leading edge during cell migration and matrix invasion

Brian Cunniff et al. Mol Biol Cell. .

Abstract

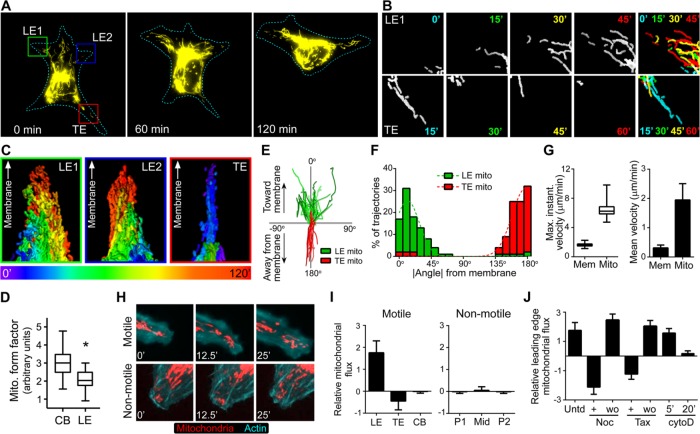
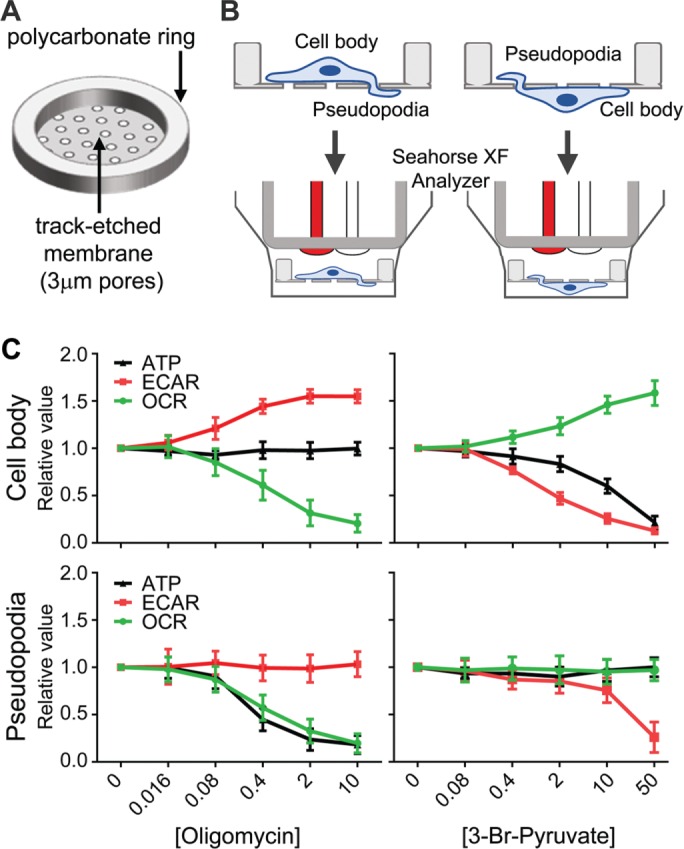
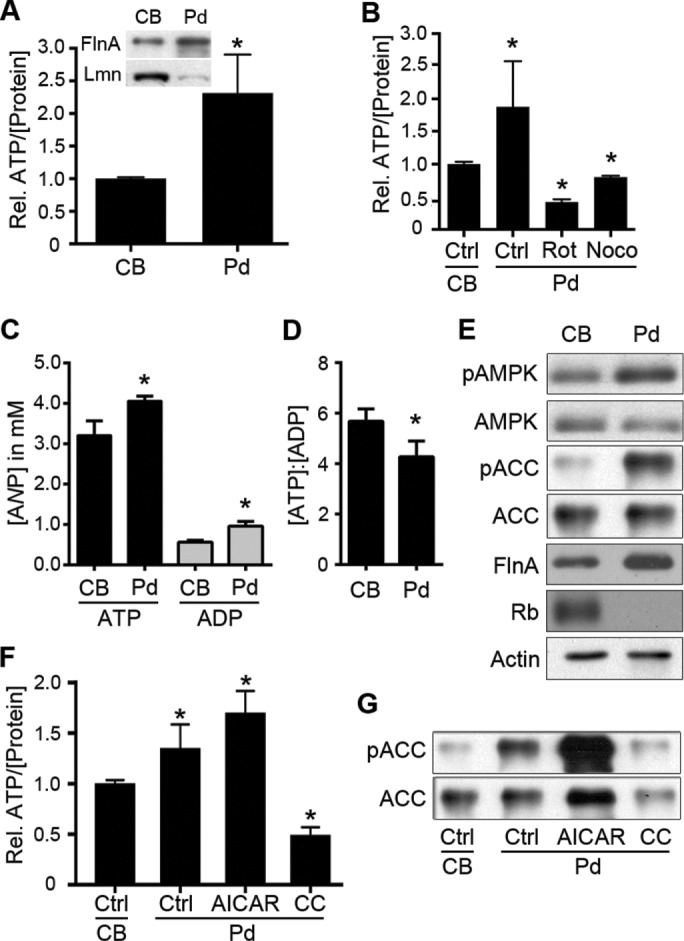
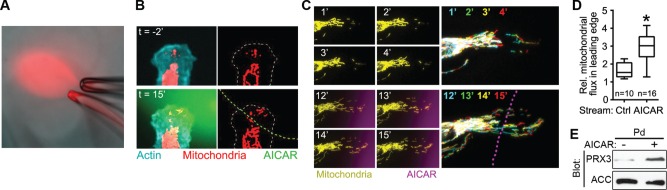
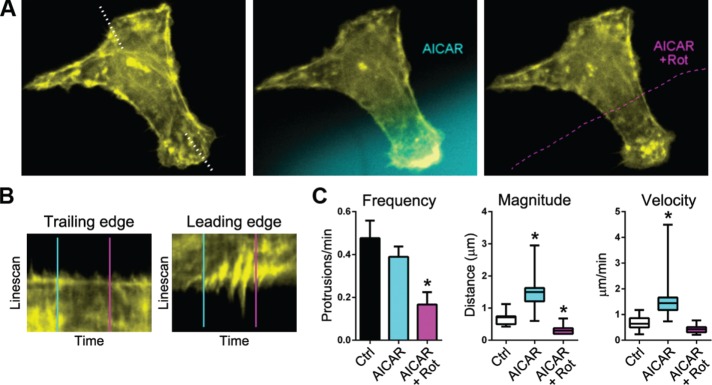
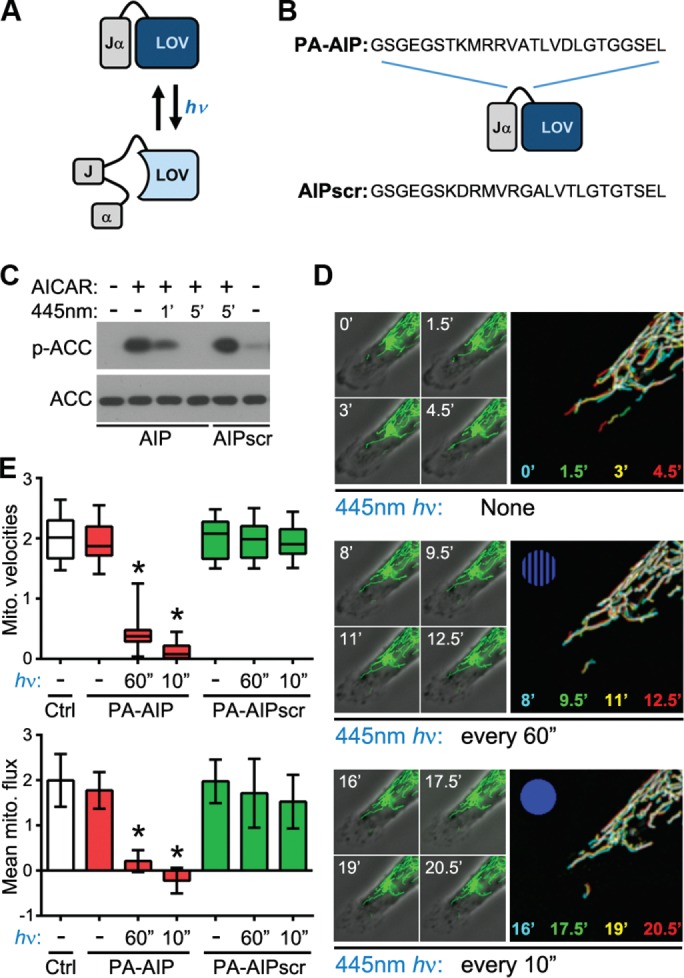
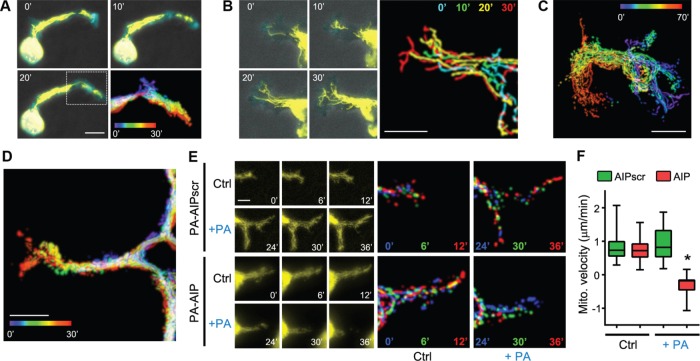
Cell migration is a complex behavior involving many energy-expensive biochemical events that iteratively alter cell shape and location. Mitochondria, the principal producers of cellular ATP, are dynamic organelles that fuse, divide, and relocate to respond to cellular metabolic demands. Using ovarian cancer cells as a model, we show that mitochondria actively infiltrate leading edge lamellipodia, thereby increasing local mitochondrial mass and relative ATP concentration and supporting a localized reversal of the Warburg shift toward aerobic glycolysis. This correlates with increased pseudopodial activity of the AMP-activated protein kinase (AMPK), a critically important cellular energy sensor and metabolic regulator. Furthermore, localized pharmacological activation of AMPK increases leading edge mitochondrial flux, ATP content, and cytoskeletal dynamics, whereas optogenetic inhibition of AMPK halts mitochondrial trafficking during both migration and the invasion of three-dimensional extracellular matrix. These observations indicate that AMPK couples local energy demands to subcellular targeting of mitochondria during cell migration and invasion.


Figures

FIGURE 1:
FIGURE 1:
Mitochondria traffic to the leading edge of migrating cells. (A) SKOV-3 cells expressing mito-dsRed were imaged over time. Representative images from the indicated times (mitochondria are shown in yellow; cell outline is depicted as a dotted line). (B) Individual frames of mitochondria in insets from the leading edge (LE1) and trailing edge (TE) from A at the indicated time points. Far right, temporal color-coded overlays in which the mitochondria from each time point are colored as indicated, overlaid, and displayed as a maximum-intensity projection to better visualize movement over time. (C) Maximum intensity projections of temporal color-coded stacks showing the cumulative flux of mitochondria over 120 min in the two leading edges (green and blue boxes) and the trailing edge (red box) depicted in A. All three images are oriented such that the peripheral cell membrane is at the top, to better demonstrate mitochondrial movement toward the membrane in the leading edge and away from the membrane in the trailing edge. (D) The form factor (a function of both mitochondrial length and branching, equal to perimeter2/4π × area) was calculated for mitochondria within cell body (CB) and leading edge (LE) regions (∼50 measurements from ∼20 cells; box, 25th–75th quartiles; whiskers, minimum and maximum; p < 0.001). (E) Tracks of individual mitochondria from leading and trailing edges plotted with respect to the leading edge and trailing edge membranes, respectively. (F) Absolute values of trajectory angles of leading and trailing edge mitochondria relative to the cell membrane (as shown in D). Each bin = 10o; dotted line represents Gaussian-fit curve. (G) The maximum instantaneous velocity (the fastest observed velocity over the period of observation, regardless of the duration of movement), as well as the mean velocity of the leading edge membrane (Mem) and leading edge mitochondria (Mito). For the maximum instantaneous velocities, boxes are 25th−75th quartiles, whiskers represent minimum and maximum, and p < 0.0001. Mean velocities ± SD (p < 0.005). (H) Motile and nonmotile SKOV-3 cells expressing mito-dsRed and mTurquoise-LifeAct were imaged at the indicated times. (I) The average relative flux (± SD) of mitochondria was measured in leading edges (LE), trailing edges (TE), and cell bodies (CB) from motile cells and peripheral (P1, P2) and midbody (Mid) regions of nonmotile cells (p < 0.001). (J) The average relative mitochondrial flux (± SD) was measured in leading edges of untreated (Untd) cells and cells treated with (+) or after washout of (wo) nocodazole (Noc), Taxol (Tax), or cytochalasin D (cytoD).
FIGURE 2:
FIGURE 2:
Mitochondria drive pseudopodial metabolism and ATP production—subcellular reversal of the Warburg effect. (A, B) Schematic of custom culture insert and its use for distinct metabolic analysis of cell bodies and pseudopodia. A thin membrane with track-etched 3-μm pores was cut to size and bonded to polycarbonate support rings using a laser cutter (see Materials and Methods for details), forming mini–Transwell-like culture inserts compatible with the Seahorse XF24 metabolic analyzer. Cells can be cultured on the obverse or converse of the inserts and induced to form pseudopodia through to the opposite side, allowing metabolic analysis of cell bodies or pseudopodia. (C) Metabolic analyses of glycolysis (measured by ECAR), mitochondrial oxidative phosphorylation (measured by OCR), and ATP in cell bodies and pseudopodia as a function of increasing concentration of oligomycin to inhibit mitochondrial function or 3-bromopyruvate to inhibit glycolysis (n = 6; average values [relative to untreated conditions] ± SD).
FIGURE 3:
FIGURE 3:
Pseudopodia harbor altered nucleotide levels, ATP/ADP ratio, and AMPK activity compared with cell bodies. (A) Relative levels of ATP (per microgram of protein) were assayed from equal amounts of extracts from purified cell bodies (CBs) and pseudopodia (Pd; n = 4, *p < 0.001). Inset, enrichment of CB and Pd fractions was confirmed by immunoblotting for the leading edge marker filamin A (FlnA) and the nuclear marker lamin A/C (Lmn) in purified Pd and CBs, respectively. (B) Relative ATP levels in Pd relative to respective cell bodies were determined in control conditions (Ctrl; p < 0.05) or after treatment of Pd with rotenone (Rot, 2.5 μM; p < 0.001) or nocodazole (Noco, 0.1 nM; p < 0.01) for 20 min (n = 3 for all samples). (C) Actual ATP and ADP concentrations in Pd relative to respective cell bodies. ATP and ADP concentrations in CB and Pd extracts were determined and used, along with averaged measurements of CB and Pd volumes, to determine true subcellular nucleotide concentrations (average ± SD from three experiments, nCB = 6 and nPd = 15; p = 0.017 and 0.0052 for ATP and ADP, respectively). (D) Average ATP-to-ADP ratio (± SD) in CB and Pd determined from the data in C (p = 0.0365). (E) CB and Pd extracts were immunoblotted to assess levels of active, phospho-T172 AMPK (pAMPK) and AMPK-phosphorylated ACC (pACC), as well as total AMPK and ACC, as indicated. Filamin A (FlnA), retinoblastoma protein (Rb), and actin were immunoblotted to show pseudopod enrichment, cell body enrichment, and equal protein loading, respectively. (F) Relative levels of ATP in Pd relative to cell bodies determined in control conditions (Ctrl; p < 0.005) or after treatment of Pd with AICAR (0.5 mM; p < 0.001) or compound C (CC; 10 μM; p < 0.001; n = 4 for all samples). (G) Extracts from control-treated CBs, control-treated Pd (Ctrl) or Pd treated with AICAR or compound C (CC) as in F were immunoblotted to assess levels of AMPK-phosphorylated or total ACC, as indicated.
FIGURE 4:
FIGURE 4:
Localized activation of AMPK induces mitochondrial recruitment. (A) Snapshot of localized drug delivery technique, showing a rhodamine-dextran solution flowing from a delivery micropipette (bottom) into a withdrawal micropipette (top) positioned ∼10 μm away. (B) Distribution of mitochondria in the leading edge of an SKOV-3 cell expressing mito-dsRed and mTurquoise-LifeAct before and after localized application of 1 mM AICAR (green fluorescence [left] and green dashed line [right]). To better visualize mitochondrial recruitment, images on the right show thresholded mitochondrial fluorescence from the raw data on the left (cell outline is depicted by the dashed line). (C) Time course of mitochondrial flux into the leading edge before (top) and after (bottom) localized application of AICAR (magenta fluorescence). Multicolor images on the right depict temporal color-coded stack projections of mitochondria from the indicated time points, with the localized AICAR stream depicted by the dotted magenta line. (D) Quantification of mitochondrial flux into the leading edge of cells treated with control medium (Ctrl) or medium + AICAR (box, 25th–75th quartiles; whiskers, minimum and maximum; p < 0.001). (E) Extracts from purified, untreated Pd or Pd treated with 1 mM AICAR for 10 min were blotted with antibodies against the mitochondria-specific protein peroxiredoxin-3 (PRX3) or the cytoplasmic protein ACC.
FIGURE 5:
FIGURE 5:
Localized activation of AMPK increases membrane ruffling in a manner dependent on mitochondrial ATP synthesis. (A) Actin cytoskeletal dynamics before and after local application of AICAR (blue fluorescence) and then AICAR + rotenone (Rot; dashed magenta outline). (B) Kymographic analysis of drug-treated leading edge and contralateral, untreated edge (demarcated by the dotted line in A) before and after application of AICAR (blue line) and AICAR + rotenone (magenta line). (C) Quantification of membrane protrusion frequency, amplitude, and velocity in leading edges treated with control medium (Ctrl), medium containing AICAR, and medium containing AICAR + rotenone. Frequencies are depicted as average values ± SD. Magnitude and velocities are depicted in box-and-whisker plots (boxes, 25th–75th quartiles; whiskers, minimum and maximum; 20 measurements from five cells; *p < 0.005).
FIGURE 6:
FIGURE 6:
Optogenetic inhibition of AMPK arrests mitochondrial trafficking. (A, B) Schematic of basis and design of PA constructs comprising the AIP or AIPscr, which can be regulated by exposure to blue light (). See the text for details. (C) Immunoblot of total and AMPK-phosphorylated ACC in cells expressing PA-AIP or PA-AIPscr treated with 0.5 mM AICAR then exposed to blue light as indicated. (D) Time course of mitochondrial dynamics in cells expressing PA-AIP before (top) and after exposure to 445-nm blue light every 60 s (middle) followed by every 10 s (bottom). Large panels images are temporal color-coded stack projections of mitochondria at the indicated time points (with increasing frequency of blue light exposure symbolized by the blue dot). (E) Quantification of mitochondrial velocity (top) and flux (bottom) in the leading edges of control cells (Ctrl) or cells expressing PA-AIP or PA-AIPscr and exposed to 445-nm light as indicated (boxes, 25th–75th quartiles; whiskers, minimum and maximum; bars, mean ± SD; 12 cells from four experiments; *p < 0.0005).
FIGURE 7:
FIGURE 7:
Mitochondria traffic into the distal tips of 3D invadopodia in an AMPK-dependent manner. (A) SKOV-3, (B, C), SKOV-3ip, and (D) B16F10 cells expressing mTurquoise-LifeAct and mito-DsRed (yellow) were embedded in 3D collagen I gels overnight and then imaged over the indicated times. Scale bars, 10 μm (A, B, D), 20 μm (C). (E) Time course of mitochondrial dynamics in 3D collagen-embedded SKOV-3 cells expressing PA-AIP or PA-AIPscr before (Ctrl) and after photoactivation (+PA) by exposure to 445-nm blue light, as described for Figure 6 (bar, 5 μm). Multicolored images are temporal color-coded stack projections of mitochondrial movement over the indicated time points. (F) Quantification of mitochondrial velocities in the invading leading edges of SKOV-3 cells expressing PA-AIP or PA-AIPscr, embedded in 3D collagen gels, before and after photoactivation by 445-nm light (boxes, 25th–75th quartiles; whiskers, minimum and maximum; bars, mean ± SD; 30 measurements from three experiments; *p < 0.001).

References

    1. Akhshi TK, Wernike D, Piekny A. Microtubules and actin crosstalk in cell migration and division. Cytoskeleton (Hoboken) 2014;71:1–23. - PubMed
    1. Anesti V, Scorrano L. The relationship between mitochondrial shape and function and the cytoskeleton. Biochim Biophys Acta. 2006;1757:692–699. - PubMed
    1. Arismendi-Morillo G, Hoa NT, Ge L, Jadus MR. Mitochondrial network in glioma’s invadopodia displays an activated state both in situ and in vitro: potential functional implications. Ultrastruct Pathol. 2012;36:409–414. - PubMed
    1. Attanasio F, Caldieri G, Giacchetti G, van Horssen R, Wieringa B, Buccione R. Novel invadopodia components revealed by differential proteomic analysis. Eur J Cell Biol. 2011;90:115–127. - PubMed
    1. Bain J, Plater L, Elliott M, Shpiro N, Hastie CJ, McLauchlan H, Klevernic I, Arthur JS, Alessi DR, Cohen P. The selectivity of protein kinase inhibitors: a further update. Biochem J. 2007;408:297–315. - PMC - PubMed

Publication types

Substances