. 2016 Sep 1;27(17):2726-34.
doi: 10.1091/mbc.E15-11-0772. Epub 2016 Jul 6.

MSK1 triggers the expression of the INK4AB/ARF locus in oncogene-induced senescence

Affiliations

MSK1 triggers the expression of the INK4AB/ARF locus in oncogene-induced senescence

Raphaël Culerrier et al. Mol Biol Cell. .

Abstract

The tumor suppressor proteins p15(INK4B), p16(INK4A), and p14(ARF), encoded by the INK4AB/ARF locus, are crucial regulators of cellular senescence. The locus is epigenetically silenced by the repressive Polycomb complexes in growing cells but is activated in response to oncogenic stress. Here we show that the mitogen- and stress-activated kinase (MSK1) is up-regulated after RAF1 oncogenic stress and that the phosphorylated (activated) form of MSK1 is significantly increased in the nucleus and recruited to the INK4AB/ARF locus. We show that MSK1 mediates histone H3S28 phosphorylation at the INK4AB/ARF locus and contributes to the rapid transcriptional activation of p15(INK4B) and p16(INK4A) in human cells despite the presence of the repressive H3K27me3 mark. Furthermore, we show that upon MSK1 depletion in oncogenic RAF1-expressing cells, H3S28ph presence at the INK4 locus and p15(INK4B) and p16(INK4A) expression are reduced. Finally, we show that H3S28-MSK-dependent phosphorylation functions in response to RAF1 signaling and that ERK and p38α contribute to MSK1 activation in oncogene-induced senescence.


Figures

FIGURE 1:
FIGURE 1:
Oncogene-induced senescence of WI-38h TERT RAF1-ER cells. (A) Expression levels of p14, p15 INK4B, and p16INK4A in WI38 hTERT RAF1-ER cells in proliferation (Pro) and at different time points (1, 3, 6, 10, 24, 48 h) after treatment with 20 nM 4-HT and determined by qRT-PCR. Mean and SD calculated from three independent biological experiments. Student’s t test was used to determine statistical significance (*p < 0.05, **p < 0.001, ***p < 0.0001; ns, non significant). (B) SA-β-gal activity of proliferating WI-38hTERT/GFP-RAF1-ER cells (top) and WI-38hTERT/GFP-RAF1-ER cells induced into senescence by incubation with 4-HT for 2 d (bottom). Quantification of SA-β-gal–positive cells of WI38 hTERT RAF1-ER cells 48 h after 4-HT induction (right). Cells were plated at 2 × 10⁴ /cm2, induced for 48 h with 4-HT, stained for β-gal activity, and counted to calculate the average percentage β-Gal–positive cells. (C) Senescence-associated heterochromatin foci (SAHF). DAPI staining of WI-38hTERT RAF1-ER cells induced to senescence (4-HT, 48 h) and in proliferation (Pro). Quantification of SAHF-positive cells at 48 h after 4-HT treatment (***p < 0.0001). (D) Western blot analysis of PRC2 members (EZH2, SUZ12, EED) and PRC1 Bmi1 after 4-HT treatment (in hours); GAPDH served as a loading control. (E) Chromatin-associated EZH2 after 4-HT treatment; H3 served as a loading control. Quantification of these blots is given in Supplemental Figure S2B. (F) Top, immunofluorescence images for proliferating (Pro) and 4-HT induced (4-HT, 24 and 48 h) WI-38h TERT/GFP-RAF1-ER cells with EZH2 antibody (scale bars, 10 μm). Representative results from at least 20 fields observed in each of three independent experiments. Bottom, statistical analysis of EZH2 accumulation in cell nuclei in proliferation (Pro) and 24, 48, and 72 h after senescence induction. **p < 0.001 and *** p < 0.0001 by the Wilcoxon–Mann–Whitney test.
FIGURE 2:
FIGURE 2:
MSK1 is overexpressed and activated in OIS. (A) Expression levels determined by qRT-PCR of MSK1 in WI-38h TERT RAF1-ER cells in proliferation (Pro) and at different time points (1, 3, 6, 10, 24, 48 h) after 4-HT treatment. Mean and SD are from three independent experiments. Student’s t test was used to determine statistical significance (**p < 0.001, ***p < 0.0001). (B) Immunoblot analysis of levels of MSK1 and p-MSK1 (Ser-376) in whole-cell extracts prepared from WI-38h TERT/GFP-RAF1-ER cells treated with 4-HT for the indicated number of hours. GAPDH was used as a loading control. (C) Immunofluorescence images of proliferating (Pro) and 4-HT–induced (4-HT 24 and 48 h) WI-38h TERT/GFP-RAF1-ER cells with MSK1 antibody (scale bar, 10 μm). The results are representative of those from at least 20 fields observed in each of three independent experiments. (D) Left, immunofluorescence images of proliferating (Pro) and 4-HT–induced (4-HT 24 and 48 h) WI-38h TERT/GFP-RAF1-ER cells with p-MSK1 and H3S28ph antibodies (scale bar, 10 μm). The results are representative of those from at least 20 fields observed in each of three independent experiments. Right, statistical analysis of MSK1, p-MSK1, and H3S28ph accumulation in cell nuclei in proliferation (Pro) and 24 and 48 h after senescence induction (**p < 0.001 and ***p < 0.0001 by the Wilcoxon–Mann–Whitney test). (E) Western blot analysis of MSK1 and p16 levels in WI-38h wild-type cells passaged until replicative senescence (p50).
FIGURE 3:
FIGURE 3:
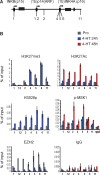
MSK1-dependent H3S28 phosphorylation affects PRC2-EZH2 chromatin displacement from the INK4 locus. (A) Schematic representation of the INK4AB/p14ARF locus, showing the localization of the primer pairs used in the ChIP experiments performed in WI-38h TERT RAF1-ER cells. (B) ChIP at the INK4AB/ARF locus. ChIP analysis was performed on chromatin prepared from WI-38h TERT RAF1-ER proliferating cells (Pro) or induced to senescence for 24 and 48 h. Antibodies are listed above the graphs. The precipitated DNA fragments were subjected to qRT-PCR analysis with selected primers amplifying regions of the INK4AB/p14ARF locus. General IgG was used as a negative control. The RPLP0 (gene ID: NM_001002) served as a negative control in p-MSK1 ChIP experiments. The values are shown as percentage of input. Data represent the average of three independent biological experiments and are expressed as means ± SD. Statistical analysis of the ChIP experiments is given in Supplemental Table S2.
FIGURE 4:
FIGURE 4:
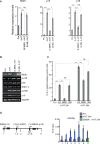
siRNA-mediated depletion of MSK1 inhibits oncogene-induced expression of p16INK4A and p15INK4B. (A) qRT-PCR analysis of p15INK4B and p16INK4A expression of WI-38h TERT-RAF-ER cells in siMSK1- and 4-HT–treated cells. Data represent the average of three independent biological experiments and are expressed as means ± SD. Student’s t test was used to determine statistical significance (**p < 0.001, ***p < 0.0001; ns, nonsignificant). (B) Western blot analysis of MSK1, p-ERK, ERK, p38, p-p38, and p16INK4A in WI-38hTERT-RAF-ER siMSK1- and 4-HT–treated cells. (C) A β-gal assay in siMSK1- and 4-HT–treated cells 24 and 48 h after induction. Student’s t test was used to determine statistical significance (*p < 0.05, ***p < 0.0001; ns, nonsignificant). (D) Left, schematic representation of the INK4AB/p14ARF locus, showing the localization of the primer pairs used in the ChIP experiments. Right, ChIP analysis was performed on chromatin prepared from siMSK1- and 4-HT–treated cells 24 h after 4-HT RAF1 induction using H3S28 phosphorylated (H3S28ph) antibody. General IgG was used as a negative control. The values are shown as percentage of the input. Data represent the average of three independent biological experiments and are expressed as means ± SD. Statistical analysis of the ChIP experiments are given in Supplemental Table S2.
FIGURE 5:
FIGURE 5:
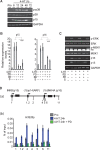
MSK1 is regulated by the ERK and p38α pathways in OIS. (A) Western blot analysis of activated phospho-p38 MAP kinase, total p38 MAP kinase, and p15 during senescence induced by 20 nM 4-HT over a 72-h time course for cells growing in 5% oxygen. (B) qRT-PCR analysis of p15INK4B and p16INK4A expression of WI-38hTERT-RAF-ER cells pretreated with SB203580 (SB) and/or PD98059 (PD) or DMSO (S) as indicated for 6 h and then stimulated with 4-HT for 24 h. Data represent the average of three independent biological experiments and are expressed as means ± SD. Student’s t test was used to determine statistical significance (***p < 0.0001). (C) WI-38h TERT-RAF-ER cells were pretreated with SB and/or PD or DMSO for 6 h and then stimulated with 4-HT for 24 h. Cell total protein extracts were subjected to Western blotting using antibodies specific for p-MSK1 (S376), MSK1, p-ERK, ERK, p-p38α, and p38α (ns, nonspecific band). (D) (a) Schematic representation of the INK4AB/p14ARF locus, showing the localization of the primer pairs used in ChIP experiments performed in WI-38h TERT RAF1-ER cells; (b) H3S28ph ChIP at the INK4AB/ARF locus. ChIP analysis was performed on chromatin prepared from proliferating cells (Pro), induced to senescence for 24 h, or pretreated with PD98059. The precipitated DNA fragments were subjected to qRT-PCR analysis with selected primers amplifying regions of the INK4AB/p14ARF locus. General IgG was used as a negative control. The values are shown as percentage of input. Data represent the average of three independent biological experiments and are expressed as means ± SD. Statistical analysis of the ChIP experiments is given in Supplemental Table S2.
FIGURE 6:
FIGURE 6:
MSK1-dependent H3S28 phosphorylation triggers Polycomb eviction and expression of the INK4AB/ARF locus in OIS. 1) The Polycomb proteins (PRC2, PRC1) repress the INK4 locus in proliferating cells. The locus is marked by the repressive H3K7me3 mark. p15INK4B and p16INK4A are repressed: p-MSK1 kinase is constitutively bound to the INK4 locus. 2) A 24-h RAF1 induction provokes increased recruitment/activation of p-MSK1, and H3S28 becomes phosphorylated through the activation of ERK and p38α kinase, leading to the eviction of PcG proteins and derepression of p15INK4B and p16INK4A despite the presence of the H3K27me3 repressive mark. 3) At 48 h after RAF1 induction, the locus loses the repressive mark H3K27me3, indicating that the histone demethylase JMJD3 is active. On recruitment of a H3K27 HAT (not determined), the H3K27Ac mark is enriched at the locus, and transcription is maintained.

Similar articles

Cited by

References

    1. Agger K, Cloos PA, Rudkjaer L, Williams K, Andersen G, Christensen J, Helin K. The H3K27me3 demethylase JMJD3 contributes to the activation of the INK4A-ARF locus in response to oncogene- and stress-induced senescence. Genes Dev. 2009;23:1171–1176. - PMC - PubMed
    1. Agherbi H, Gaussmann-Wenger A, Verthuy C, Chasson L, Serrano M, Djabali M. Polycomb mediated epigenetic silencing and replication timing at the INK4a/ARF locus during senescence. PLoS One. 2009;4:e5622. - PMC - PubMed
    1. Barradas M, Anderton E, Acosta JC, Li S, Banito A, Rodriguez-Niedenfuhr M, Maertens G, Banck M, Zhou MM, Walsh MJ, et al. Histone demethylase JMJD3 contributes to epigenetic control of INK4a/ARF by oncogenic RAS. Genes Dev. 2009;23:1177–1182. - PMC - PubMed
    1. Bracken AP, Kleine-Kohlbrecher D, Dietrich N, Pasini D, Gargiulo G, Beekman C, Theilgaard-Monch K, Minucci S, Porse BT, Marine JC, et al. The Polycomb group proteins bind throughout the INK4A-ARF locus and are disassociated in senescent cells. Genes Dev. 2007;21:525–530. - PMC - PubMed
    1. Cao R, Wang L, Wang H, Xia L, Erdjument-Bromage H, Tempst P, Jones RS, Zhang Y. Role of histone H3 lysine 27 methylation in Polycomb-group silencing. Science. 2002;298:1039–1043. - PubMed

Publication types

MeSH terms

Substances

LinkOut - more resources