

Systems view of adipogenesis via novel omics-driven and tissue-specific activity scoring of network functional modules
- PMID: 27385551
- PMCID: PMC4935943
- DOI: 10.1038/srep28851
Systems view of adipogenesis via novel omics-driven and tissue-specific activity scoring of network functional modules
Abstract
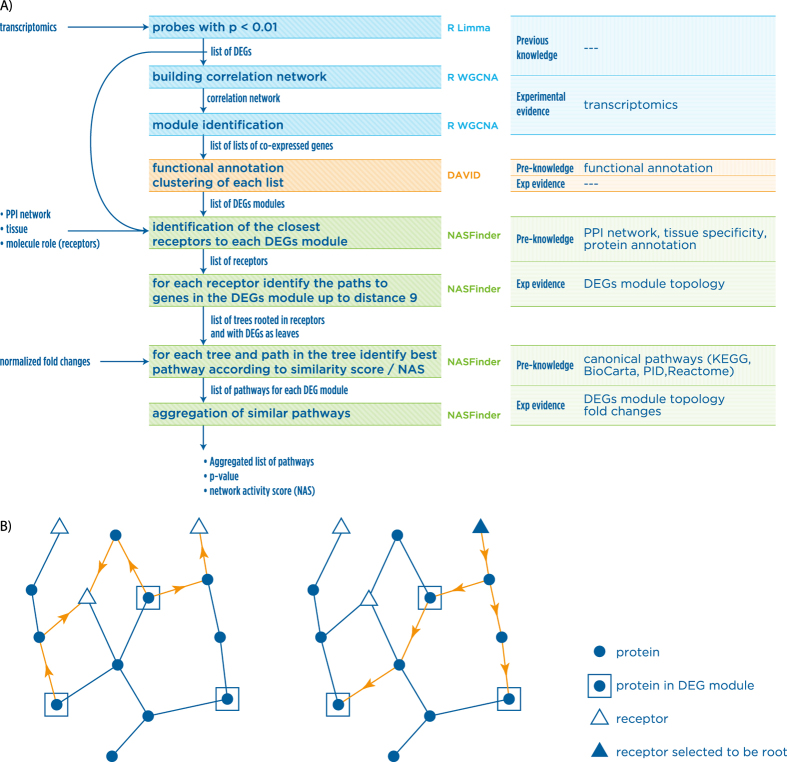
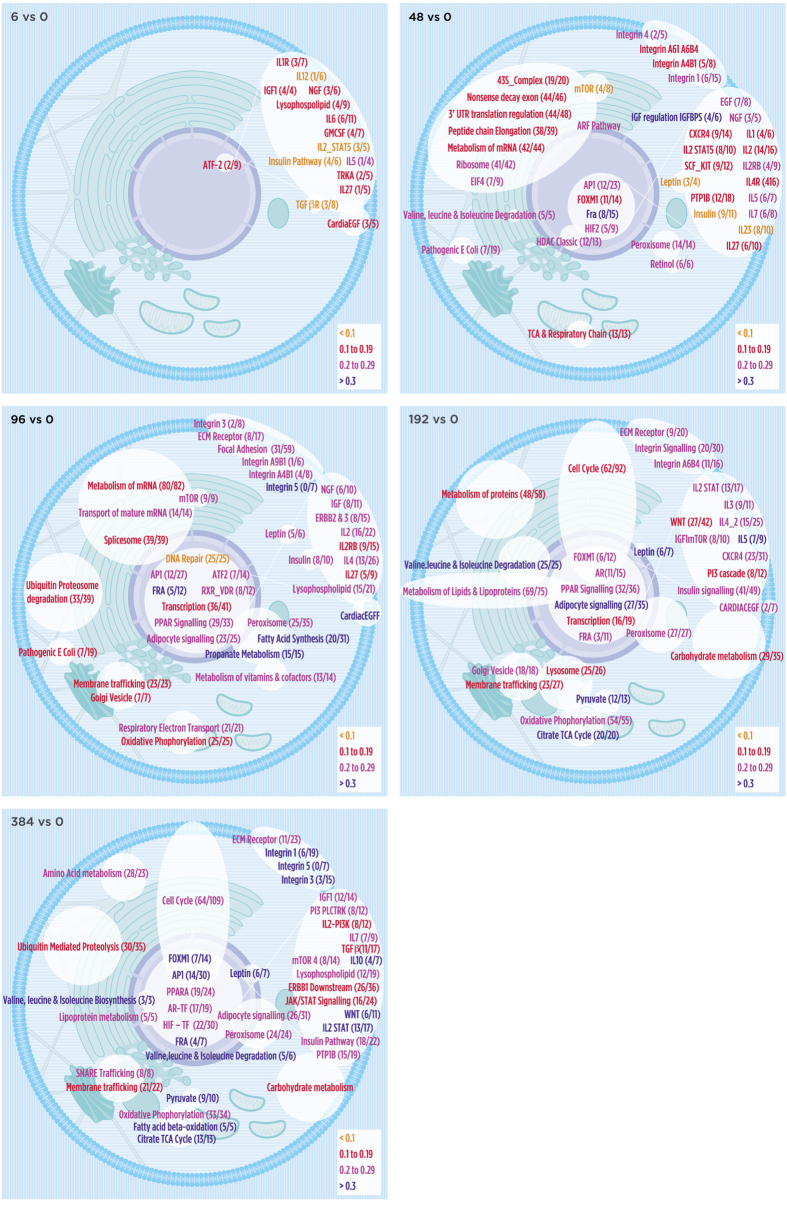
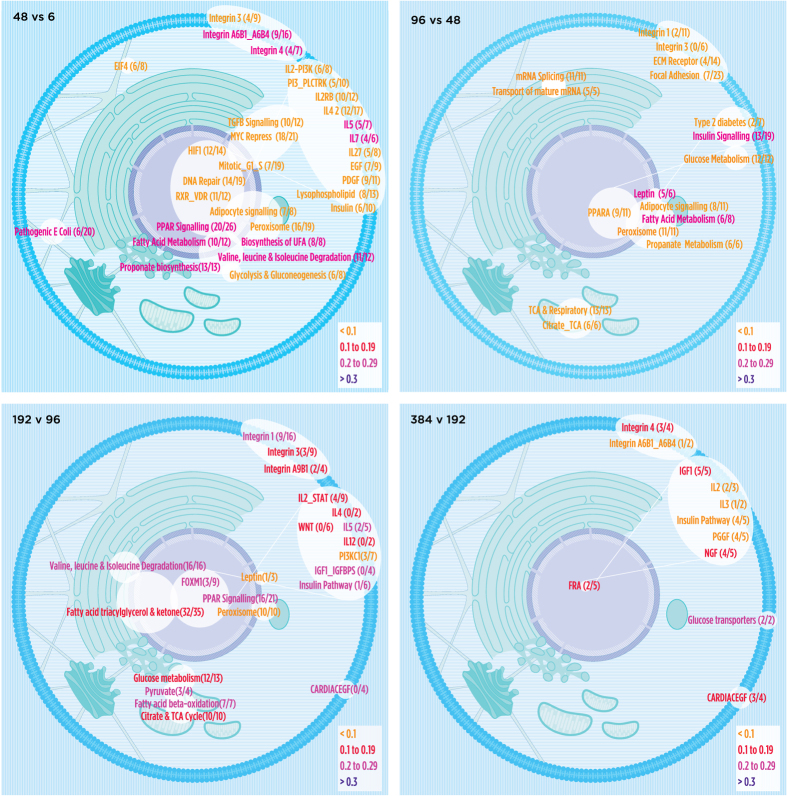
The investigation of the complex processes involved in cellular differentiation must be based on unbiased, high throughput data processing methods to identify relevant biological pathways. A number of bioinformatics tools are available that can generate lists of pathways ranked by statistical significance (i.e. by p-value), while ideally it would be desirable to functionally score the pathways relative to each other or to other interacting parts of the system or process. We describe a new computational method (Network Activity Score Finder - NASFinder) to identify tissue-specific, omics-determined sub-networks and the connections with their upstream regulator receptors to obtain a systems view of the differentiation of human adipocytes. Adipogenesis of human SBGS pre-adipocyte cells in vitro was monitored with a transcriptomic data set comprising six time points (0, 6, 48, 96, 192, 384 hours). To elucidate the mechanisms of adipogenesis, NASFinder was used to perform time-point analysis by comparing each time point against the control (0 h) and time-lapse analysis by comparing each time point with the previous one. NASFinder identified the coordinated activity of seemingly unrelated processes between each comparison, providing the first systems view of adipogenesis in culture. NASFinder has been implemented into a web-based, freely available resource associated with novel, easy to read visualization of omics data sets and network modules.
Conflict of interest statement
Jim Kaput works for Nestlé Institute of Health Sciences, a for-profit company.
Figures

Similar articles
-
Novel insights into adipogenesis from omics data.Curr Med Chem. 2009;16(23):2952-64. doi: 10.2174/092986709788803132. Curr Med Chem. 2009. PMID: 19689276 Free PMC article. Review.
-
Bidirectional manipulation of gene expression in adipocytes using CRISPRa and siRNA.Mol Metab. 2017 Oct;6(10):1313-1320. doi: 10.1016/j.molmet.2017.07.001. Epub 2017 Jul 8. Mol Metab. 2017. PMID: 29031730 Free PMC article.
-
fabp4 is central to eight obesity associated genes: a functional gene network-based polymorphic study.J Theor Biol. 2015 Jan 7;364:344-54. doi: 10.1016/j.jtbi.2014.09.034. Epub 2014 Oct 2. J Theor Biol. 2015. PMID: 25280936
-
Identification of Potential Key Genes Associated with Adipogenesis through Integrated Analysis of Five Mouse Transcriptome Datasets.Int J Mol Sci. 2018 Nov 12;19(11):3557. doi: 10.3390/ijms19113557. Int J Mol Sci. 2018. PMID: 30424473 Free PMC article.
-
microRNAs regulate adipocyte differentiation.Cell Biol Int. 2013 Jun;37(6):533-46. doi: 10.1002/cbin.10063. Epub 2013 Mar 18. Cell Biol Int. 2013. PMID: 23504919 Review.
Cited by
-
Exploring the cellular network of metabolic flexibility in the adipose tissue.Genes Nutr. 2018 Jul 5;13:17. doi: 10.1186/s12263-018-0609-3. eCollection 2018. Genes Nutr. 2018. PMID: 30002738 Free PMC article. Review.
-
Graphical Modeling Meets Systems Pharmacology.Gene Regul Syst Bio. 2017 Mar 10;11:1177625017691937. doi: 10.1177/1177625017691937. eCollection 2017. Gene Regul Syst Bio. 2017. PMID: 28469411 Free PMC article.
-
History and Future Perspectives on the Discipline of Quantitative Systems Pharmacology Modeling and Its Applications.Front Physiol. 2021 Mar 25;12:637999. doi: 10.3389/fphys.2021.637999. eCollection 2021. Front Physiol. 2021. PMID: 33841175 Free PMC article. Review.
-
Combined use of protein biomarkers and network analysis unveils deregulated regulatory circuits in Duchenne muscular dystrophy.PLoS One. 2018 Mar 12;13(3):e0194225. doi: 10.1371/journal.pone.0194225. eCollection 2018. PLoS One. 2018. PMID: 29529088 Free PMC article.
-
The Power of LC-MS Based Multiomics: Exploring Adipogenic Differentiation of Human Mesenchymal Stem/Stromal Cells.Molecules. 2019 Oct 8;24(19):3615. doi: 10.3390/molecules24193615. Molecules. 2019. PMID: 31597247 Free PMC article.
References
-
- Bonetta L. Bioinformatics - from genes to pathways. Nature Methods 1, 169–175 (2004).
-
- Ravasz E., Somera A. L., Mongru D. A., Oltvai Z. N. & Barabasi A. L. Hierarchical organization of modularity in metabolic networks. Science 297, 1551–1555 (2002). - PubMed
-
- Priami C. & Morine M. J. Analysis of biological systems, (Imperial College Press, 2015).
Publication types
MeSH terms
LinkOut - more resources
Full Text Sources
Other Literature Sources
Molecular Biology Databases
