Comparative Study
. 2016 Oct;54(10):2470-84.
doi: 10.1128/JCM.00330-16. Epub 2016 Jul 6.

Comparison of Next-Generation Sequencing Technologies for Comprehensive Assessment of Full-Length Hepatitis C Viral Genomes

Affiliations
Comparative Study

Comparison of Next-Generation Sequencing Technologies for Comprehensive Assessment of Full-Length Hepatitis C Viral Genomes

Emma Thomson et al. J Clin Microbiol. 2016 Oct.

Abstract

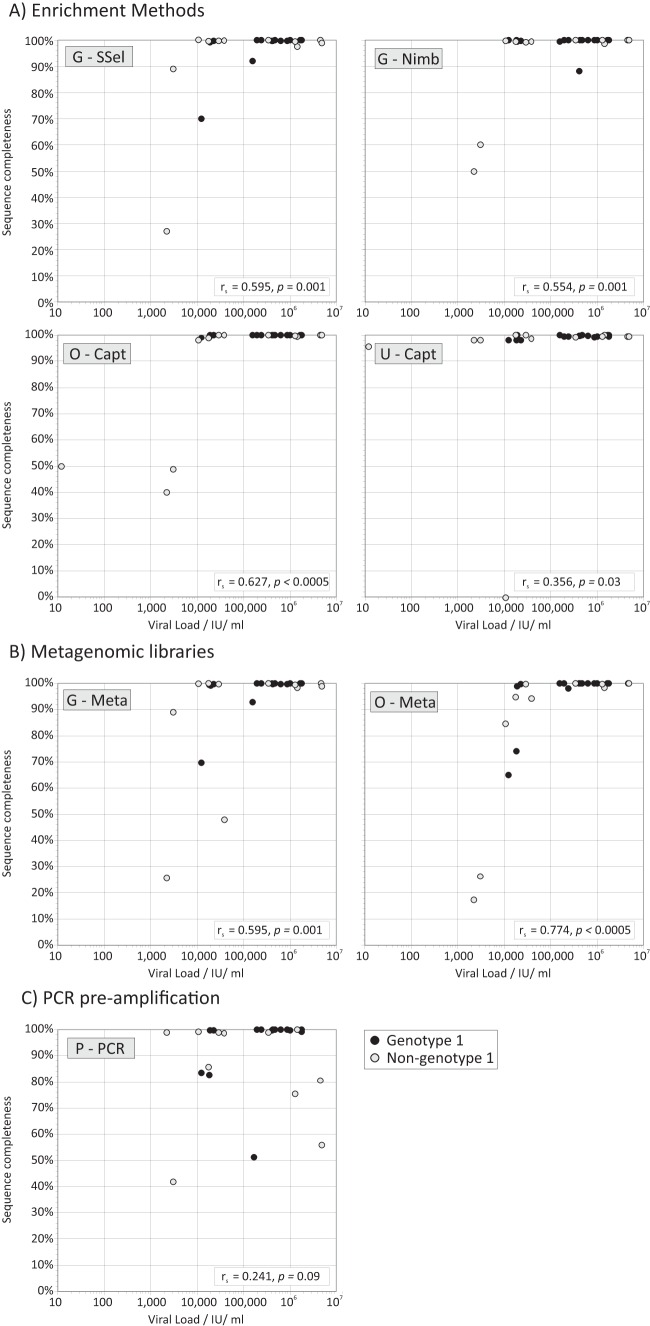
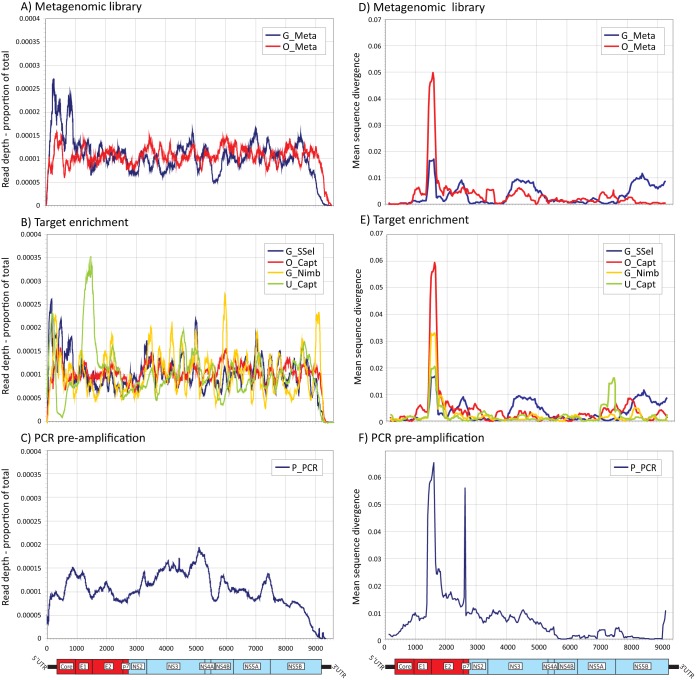
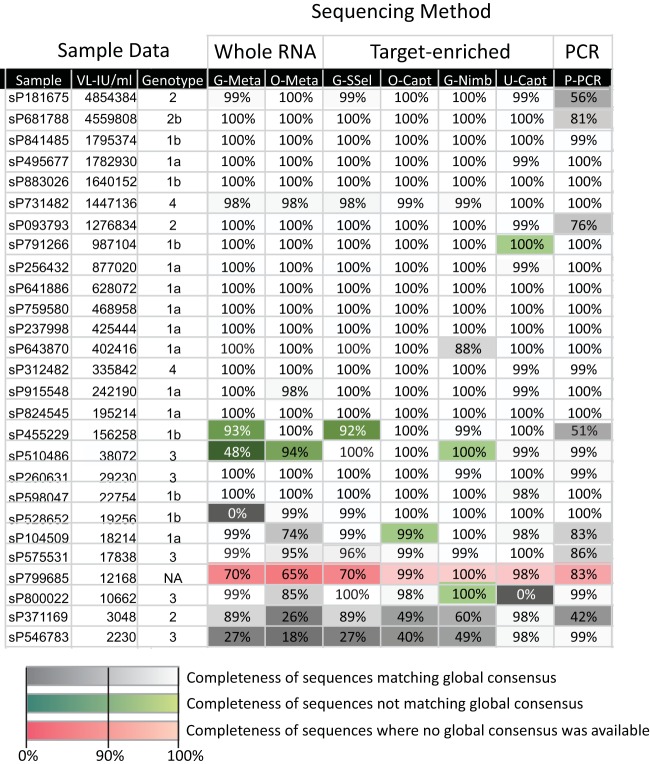
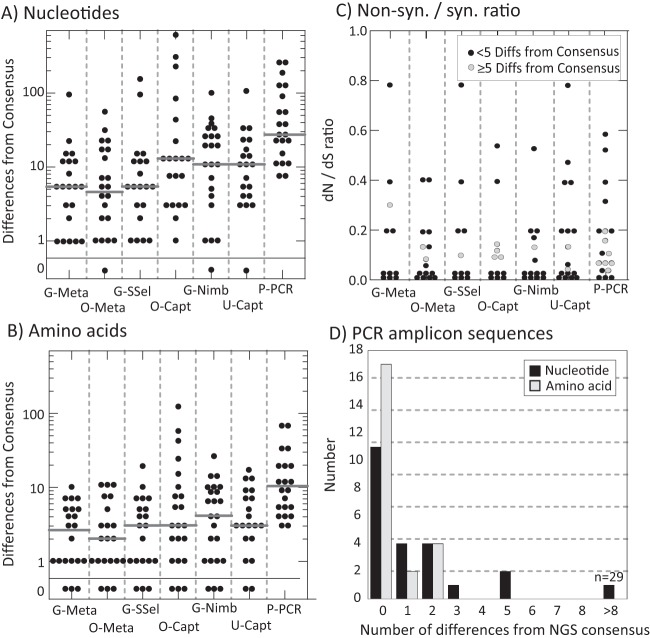
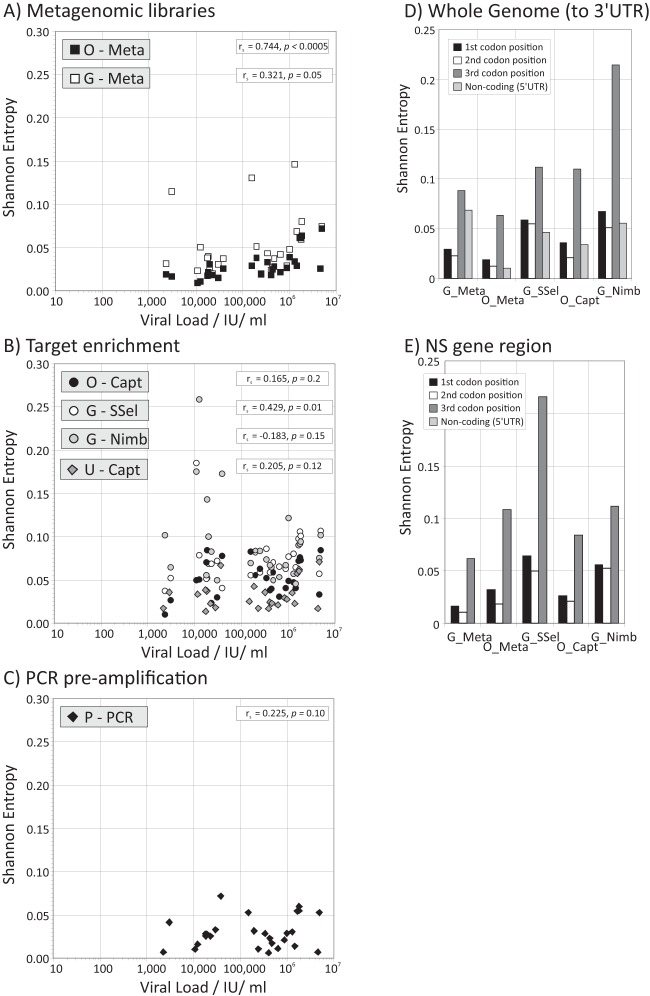
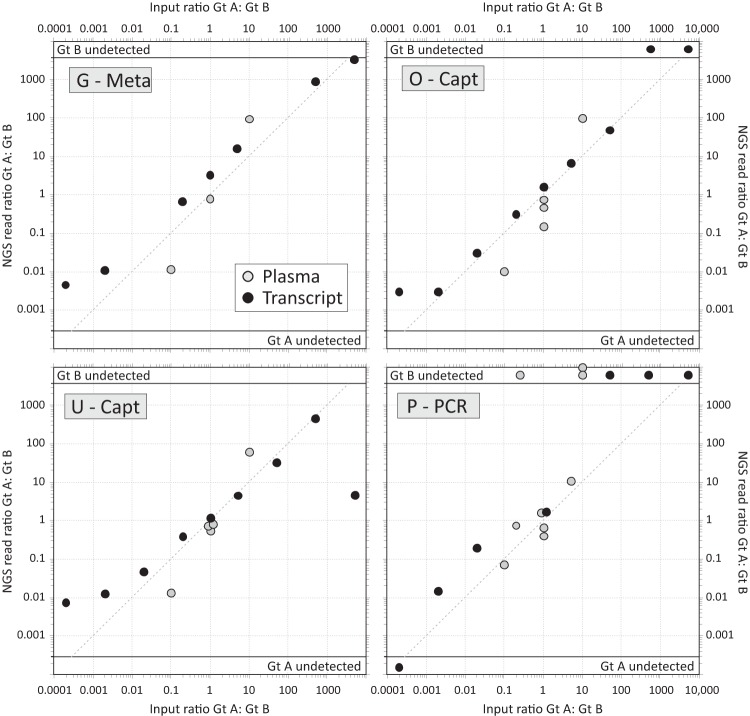
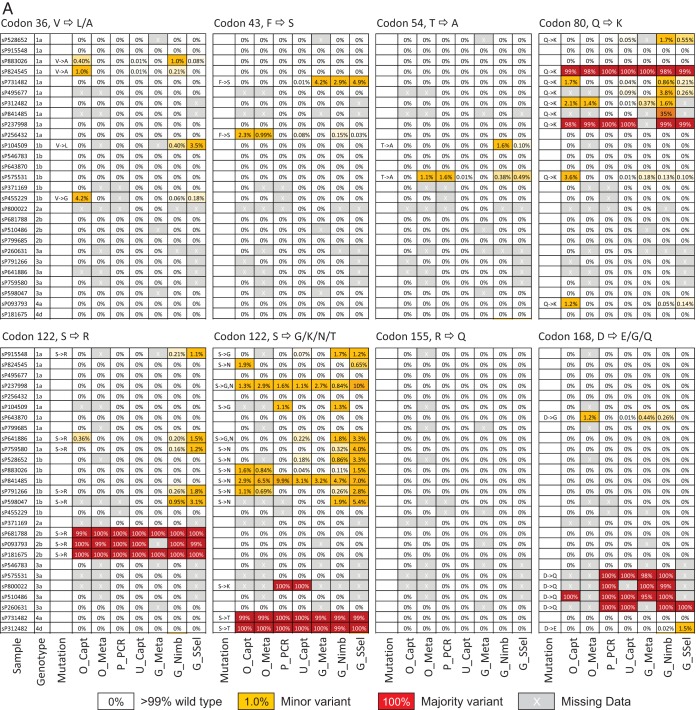
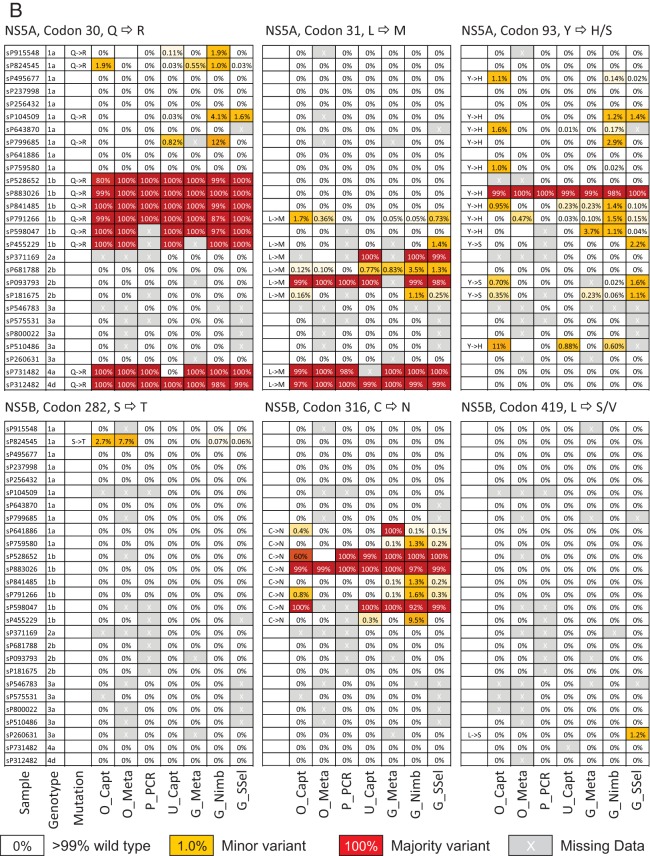
Affordable next-generation sequencing (NGS) technologies for hepatitis C virus (HCV) may potentially identify both viral genotype and resistance genetic motifs in the era of directly acting antiviral (DAA) therapies. This study compared the ability of high-throughput NGS methods to generate full-length, deep, HCV sequence data sets and evaluated their utility for diagnostics and clinical assessment. NGS methods using (i) unselected HCV RNA (metagenomics), (ii) preenrichment of HCV RNA by probe capture, and (iii) HCV preamplification by PCR implemented in four United Kingdom centers were compared. Metrics of sequence coverage and depth, quasispecies diversity, and detection of DAA resistance-associated variants (RAVs), mixed HCV genotypes, and other coinfections were compared using a panel of samples with different viral loads, genotypes, and mixed HCV genotypes/subtypes [geno(sub)types]. Each NGS method generated near-complete genome sequences from more than 90% of samples. Enrichment methods and PCR preamplification generated greater sequence depth and were more effective for samples with low viral loads. All NGS methodologies accurately identified mixed HCV genotype infections. Consensus sequences generated by different NGS methods were generally concordant, and majority RAVs were consistently detected. However, methods differed in their ability to detect minor populations of RAVs. Metagenomic methods identified human pegivirus coinfections. NGS provided a rapid, inexpensive method for generating whole HCV genomes to define infecting genotypes, RAVs, comprehensive viral strain analysis, and quasispecies diversity. Enrichment methods are particularly suited for high-throughput analysis while providing the genotype and information on potential DAA resistance.


Figures

FIG 1
FIG 1
Relationship between viral loads and read counts for each method. (A to C) Total HCV-specific bases read from each sample (y axis, log scale) was compared with viral loads separately for target enrichment (A), metagenomic library (B), and sequence preamplified by PCR (C), on a common x/y scale. Genotype 1 and non-genotype 1 samples are indicated according to the symbol key. The significance of the association between viral loads and read counts was calculated by Spearman's rank order correlation test; Spearman correlation coefficient (rs) values and P values are provided in inset boxes. (D) Distribution of viral loads by method with logarithmic mean values shown below the x axis. The box-and-whisker plots shows the median values and 67 and 95 percentiles.
FIG 2
FIG 2
Relationship between viral load and completeness of the HCV consensus sequence from each method. (A to C) The proportion of the whole genome sequenced was compared with viral loads separately for target enrichment (A), metagenomics (B), and sequence preamplified by PCR (C) (plotted on a common x/y scale). Sequence completeness was expressed as a percentage, assuming a genome length of 9,650 bases. Genotype 1 and non-genotype 1 samples are indicated according to the symbol key. The significance of the association between viral load and genome coverage was calculated by Spearman's rank order correlation test; values of rs and P values are provided in inset boxes.
FIG 3
FIG 3
Variability in read depth across the HCV genome coverage and divergence from a global consensus for each of the sequencing methods. (A to C) Mean read coverage across the HCV genome by different NGS methods. Mean coverage was calculated as the number of bases at each site as a proportion of total reads for the sequence (expected mean value of 0.00014); mean values were calculated from samples with >100,000 total reads. Genome positions were based on the H77 reference sequence. A genome diagram of HCV drawn to the same scale as the x axis is included below panels A to C. A plot of Z-scores is provided in the supplemental material (see Fig. S1 in the supplemental material). (D to F). Divergence between the global consensus and individual consensus sequences generated by different methods were calculated for a sliding window of 250 bases centered on every 30th base. Mean divergence values for each sequencing method at each site (expressed as proportional distance [p-distance]) were plotted for positions homologous to the H77 reference strain. Genomic features of the HCV genome are shown below panels D to F, with structural genes shown in red. A comparable plot of mean values for each genotype is shown in Fig. S3 in the supplemental material.
FIG 4
FIG 4
Comparison of the completeness of consensus sequences and their genetic relatedness to each other. Percentage sequence completeness for coding regions is given for each sample. Consensus sequences were assembled from the panel samples by each NGS method and used to define HCV genotype and compared with the genotype identified by conventional genotyping assay (Genotype column). Samples have been ranked by viral load (VL-IU/ml column) (from highest to lowest). Assembled sequences that correspond to the global consensus are shown on a gray/white scale; those that differed by >5% in nucleotide sequence from each other were considered separate strains and are shown on a green scale. Sample sP799685 generated a diverse range of sequences by different NGS methods, and it was not possible to generate a global consensus sequence by combining sequences (red shading). NA, not available.
FIG 5
FIG 5
Assessment of viral diversity: sequence differences between the global consensus and majority sequences generated by each NGS method, and the association of HCV viral load with diversity. (A and B) Distribution of the numbers of nucleotide and amino acid differences, respectively (y axis, log scale) between the global consensus sequence and the individual majority-rule sequences generated by each NGS method (x axis). Sequences phylogenetically unrelated to the global consensus (shaded green in Fig. 4) or where there was no global consensus (shaded red in Fig. 4) have been excluded from this analysis. Gray bars represent median values for the distribution. (C) Nonsynonymous/synonymous ratio of substitutions between each assembled sequence and the corresponding global consensus sequence. More-divergent sequences showing ≥5 differences (Diffs) from the global consensus are plotted with gray filled circles. (D) Distribution of nucleotide and amino acid differences between directly sequenced amplicons derived from the NS3 (positions 3288 to 5727) and NS5B region (positions 7407 to 9366) of 12 samples from the evaluation panel with corresponding regions from the global consensus obtained by NGS methods.
FIG 6
FIG 6
Mean Shannon entropy values of NGS-generated sequences and relationship with viral load. (A to C) Shannon entropy values for polymorphic sites inferred for NGS sequencing methods based on metagenomic libraries (A), target enrichment (B), and PCR preamplification (C). Viral loads are plotted on log scales. (D and E) Shannon entropy values at each codon position in the consensus sequences inferred by each sequencing method based on the whole genome (D) and the nonstructural regions (E).
FIG 7
FIG 7
Capacity of NGS to detect mixed-genotype/subtype samples. Observed ratios of NGS read counts between component genotypes genotype A (Gt A) and genotype B (Gt B) (y axis) compared to their input ratios (x axis), plotted on a log/log scale. The dotted line represents the expected position of data points if the assays were able to detect both input genotypes (genotypes A and B) with equal efficiency. Samples of mixed genotype of known ratio (the input ratio) were acquired from QCMD or through patient samples or in vitro transcripts of known genotype that were mixed in vitro (listed in Table S1B in the supplemental material).
FIG 8
FIG 8
Frequencies of RAVs in the study samples (untreated subjects). Frequencies of resistance-associated mutations in NS3 genes (A) and NS5A and NS5B genes (B) detected by different sequencing methods, shown on a gray or color background to indicate frequencies. Resistance mutations were present either as minor variants (around 1 to 10% of the population; shown by yellow background) or represented the predominant variant in the population (shown by red background). Frequency information from samples with <10 reads at a site were excluded, as were polymorphisms found within a single sequence. Samples have been grouped by genotype.
FIG 8
FIG 8
Frequencies of RAVs in the study samples (untreated subjects). Frequencies of resistance-associated mutations in NS3 genes (A) and NS5A and NS5B genes (B) detected by different sequencing methods, shown on a gray or color background to indicate frequencies. Resistance mutations were present either as minor variants (around 1 to 10% of the population; shown by yellow background) or represented the predominant variant in the population (shown by red background). Frequency information from samples with <10 reads at a site were excluded, as were polymorphisms found within a single sequence. Samples have been grouped by genotype.

Comment in

References

    1. Messina JP, Humphreys I, Flaxman A, Brown A, Cooke GS, Pybus OG, Barnes E. 2015. Global distribution and prevalence of hepatitis C virus genotypes. Hepatology 61:77–87. doi:10.1002/hep.27259. - DOI - PMC - PubMed
    1. Jacobson IM, Dore GJ, Foster GR, Fried MW, Radu M, Rafalsky VV, Moroz L, Craxi A, Peeters M, Lenz O, Ouwerkerk-Mahadevan S, De La Rosa G, Kalmeijer R, Scott J, Sinha R, Beumont-Mauviel M. 2014. Simeprevir with pegylated interferon alfa 2a plus ribavirin in treatment-naive patients with chronic hepatitis C virus genotype 1 infection (QUEST-1): a phase 3, randomised, double-blind, placebo-controlled trial. Lancet 384:403–413. doi:10.1016/S0140-6736(14)60494-3. - DOI - PubMed
    1. Kowdley KV, Lawitz E, Crespo I, Hassanein T, Davis MN, DeMicco M, Bernstein DE, Afdhal N, Vierling JM, Gordon SC, Anderson JK, Hyland RH, Dvory-Sobol H, An D, Hindes RG, Albanis E, Symonds WT, Berrey MM, Nelson DR, Jacobson IM. 2013. Sofosbuvir with pegylated interferon alfa-2a and ribavirin for treatment-naive patients with hepatitis C genotype-1 infection (ATOMIC): an open-label, randomised, multicentre phase 2 trial. Lancet 381:2100–2107. doi:10.1016/S0140-6736(13)60247-0. - DOI - PubMed
    1. Lawitz E, Poordad FF, Pang PS, Hyland RH, Ding X, Mo H, Symonds WT, McHutchison JG, Membreno FE. 2014. Sofosbuvir and ledipasvir fixed-dose combination with and without ribavirin in treatment-naive and previously treated patients with genotype 1 hepatitis C virus infection (LONESTAR): an open-label, randomised, phase 2 trial. Lancet 383:515–523. doi:10.1016/S0140-6736(13)62121-2. - DOI - PubMed
    1. Smith DB, Bukh J, Kuiken C, Muerhoff AS, Rice CM, Stapleton JT, Simmonds P. 2014. Expanded classification of hepatitis C virus into 7 genotypes and 67 subtypes: updated criteria and assignment web resource. Hepatology 59:318–327. doi:10.1002/hep.26744. - DOI - PMC - PubMed

LinkOut - more resources