. 2016 Oct 1;116(4):1579-1585.
doi: 10.1152/jn.00347.2016. Epub 2016 Jul 6.

The compensatory interaction between motor unit firing behavior and muscle force during fatigue

Affiliations

The compensatory interaction between motor unit firing behavior and muscle force during fatigue

Paola Contessa et al. J Neurophysiol. .

Abstract

Throughout the literature, different observations of motor unit firing behavior during muscle fatigue have been reported and explained with varieties of conjectures. The disagreement amongst previous studies has resulted, in part, from the limited number of available motor units and from the misleading practice of grouping motor unit data across different subjects, contractions, and force levels. To establish a more clear understanding of motor unit control during fatigue, we investigated the firing behavior of motor units from the vastus lateralis muscle of individual subjects during a fatigue protocol of repeated voluntary constant force isometric contractions. Surface electromyographic decomposition technology provided the firings of 1,890 motor unit firing trains. These data revealed that to sustain the contraction force as the muscle fatigued, the following occurred: 1) motor unit firing rates increased; 2) new motor units were recruited; and 3) motor unit recruitment thresholds decreased. Although the degree of these adaptations was subject specific, the behavior was consistent in all subjects. When we compared our empirical observations with those obtained from simulation, we found that the fatigue-induced changes in motor unit firing behavior can be explained by increasing excitation to the motoneuron pool that compensates for the fatigue-induced decrease in muscle force twitch reported in empirical studies. Yet, the fundamental motor unit control scheme remains invariant throughout the development of fatigue. These findings indicate that the central nervous system regulates motor unit firing behavior by adjusting the operating point of the excitation to the motoneuron pool to sustain the contraction force as the muscle fatigues.

Keywords: firing rates; force twitch; motor units; muscle fatigue; recruitment threshold.


Figures

Fig. 1.
Fig. 1.
A–C: three contractions performed by 1 subject at the beginning (A), middle (B), and end (C) of the fatigue protocol. Top: the solid black lines show the muscle force produced. The time-varying mean firing rates of 100 motor units obtained from the 3 contractions are calculated using a 4-s Hanning window and shown in faded colors. For clarity, 6 are emboldened. The same color across different contractions indicates motor units with similar MUAP amplitude. Note the recruitment of additional higher-threshold, lower-firing rate motor units during the increasing (green trace in B) and constant force (red trace in C) segments of subsequent contractions. Colored circles provide the force at which motor units are recruited. The decreasing force value of similarly colored circles in AC indicates a decrease in the recruitment threshold of motor units with similar MUAP amplitude. On the right of each contraction, the dotted black lines indicate the range of firing rates for the detected motor units. The continuous black lines and numerical values indicate the average of all motor unit firing rates in each contraction. Bottom: sEMG signals recorded separately from the vastus lateralis (VL), vastus medialis (VM), and rectus femoris (RF) in the same subject during the fatigue protocol. The root-mean-square signal amplitude during the analysis interval increased from 0.033, 0.027, and 0.031 mV at the beginning to 0.060, 0.059, and 0.050 mV at the end of the fatigue protocol for the VL, VM, and RF muscles, respectively.
Fig. 2.
Fig. 2.
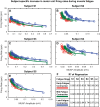
A–E: subject-specific relation between average firing rate and MUAP amplitude for motor units obtained from 3 contractions at the beginning (red), middle (green), and end (blue) of the fatigue protocol. The data were fit with exponential functions of the form y = A + Be(−Cx). F: R2 values and average number of motor units (n) of the regressions.
Fig. 3.
Fig. 3.
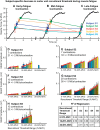
A–C: decrease in the average recruitment threshold of motor units with similar MUAP amplitude in 3 contractions at the beginning (A), middle (B), and end (C) of the fatigue protocol. For clarity, data for each subject are superimposed on a representative subject's force (solid black lines). D–H: average MUAP amplitude for 3 groups of motor units recruited within the 0–10%, 10–20%, and 20–30% MVC force range. Each bar indicates the average MUAP amplitude in 1 contraction repetition, from the first (blue) to the last (yellow) contraction for each subject. The relation between average MUAP amplitude and contraction repetition was fit with linear regressions (red lines). I: R2 values of the regressions.
Fig. 4.
Fig. 4.
A–C: colored traces indicate the time-varying mean firing rates of 3 selected motor units in 3 contractions at the beginning (A), middle (B), and end (C) of the simulated fatigue protocol. The black lines show the simulated force. Colored circles provide the force at which motor units are recruited. D–F: force twitch of a representative motor unit at the beginning and end of the constant force segment of each simulated contraction. G–I: blue and gray curves show the relation between excitation to the motoneuron pool and firing rate for 60 out of 600 simulated motor units of the VL muscle. Solid and dotted red lines indicate the operating point of the excitation to the motoneuron pool at the beginning and end, respectively, of the constant force segment of each simulated contraction. Blue curves indicate active motor units. The intersection of each firing rate curve with the excitation line indicates the firing rate value of motor units at the given excitation value.

References

    1. Adam A, De Luca CJ. Firing rates of motor units in human vastus lateralis muscle during fatiguing isometric contractions. J Appl Physiol 99: 268–280, 2005. - PubMed
    1. Adam A, De Luca CJ. Recruitment order of motor units in human vastus lateralis muscle is maintained during fatiguing contractions. J Neurophysiol 90: 2919–2927, 2003. - PubMed
    1. Contessa P, De Luca CJ. Neural control of muscle force: indications from a simulation model. J Neurophysiol 109: 1548–1570, 2013. - PMC - PubMed
    1. De Luca CJ, Adam A, Wotiz R, Gilmore LD, Nawab SH. Decomposition of surface EMG signals. J Neurophysiol 96: 1646–1657, 2006. - PubMed
    1. De Luca CJ, Contessa P. Hierarchical control of motor units during voluntary contractions. J Neurophysiol 107: 178–195, 2012. - PMC - PubMed

Publication types

LinkOut - more resources