. 2016 Sep 1;116(3):1522-1535.
doi: 10.1152/jn.00883.2015. Epub 2016 Jul 6.

Optimal visuotactile integration for velocity discrimination of self-hand movements

Affiliations

Optimal visuotactile integration for velocity discrimination of self-hand movements

M Chancel et al. J Neurophysiol. .

Abstract

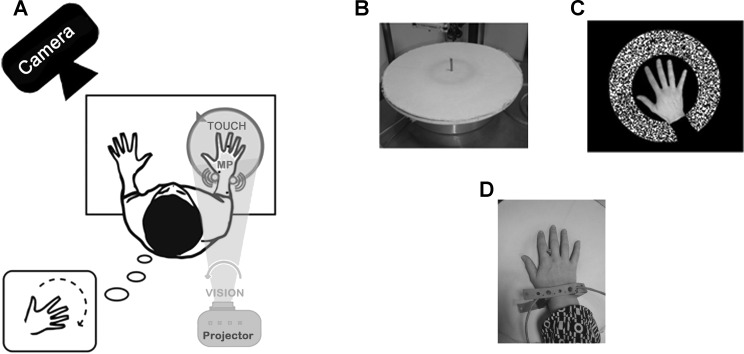
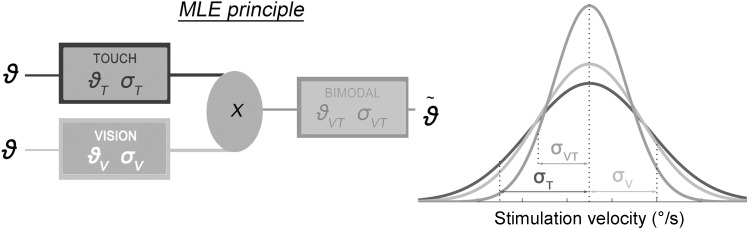
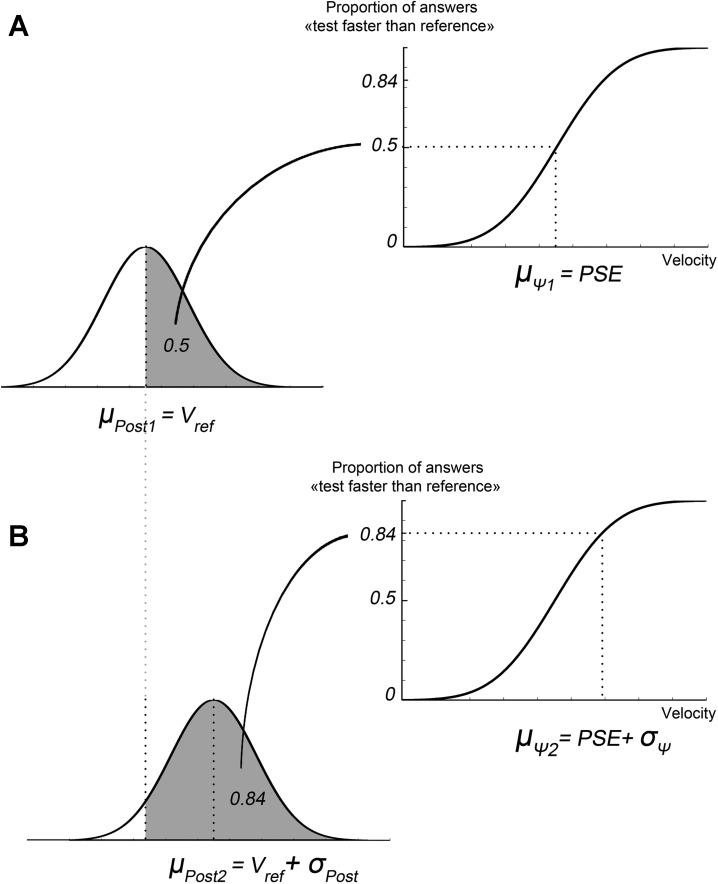
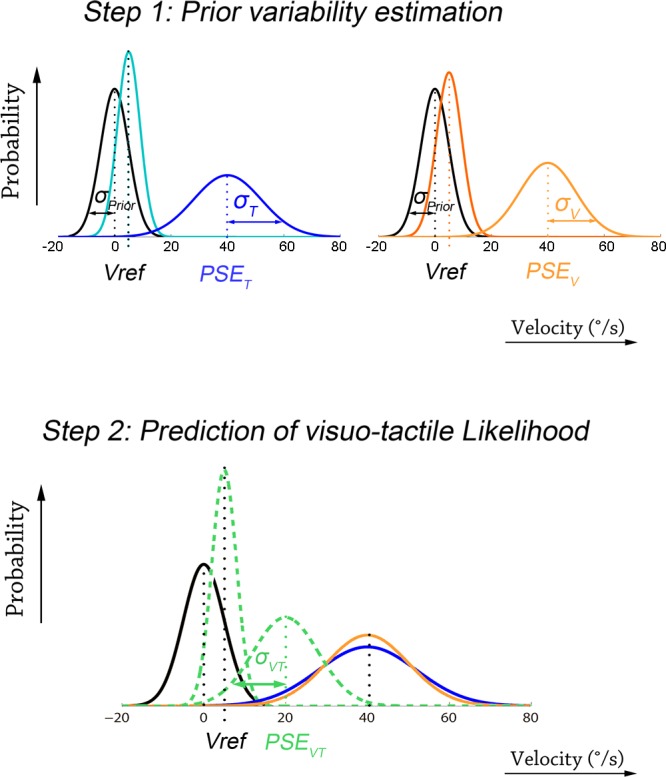
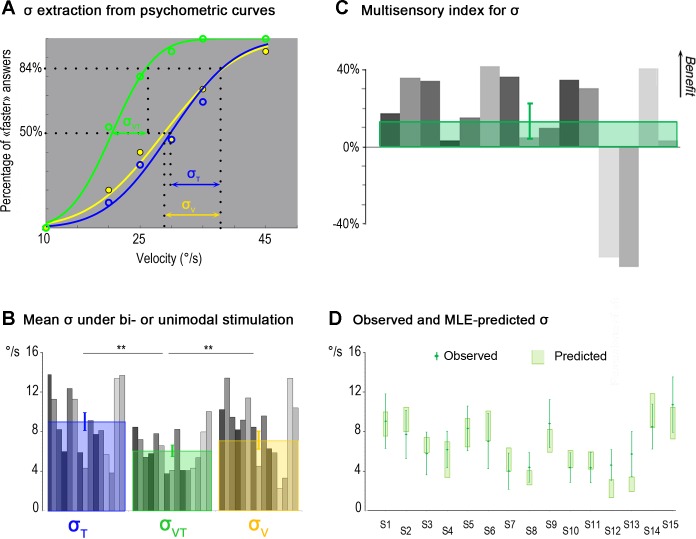
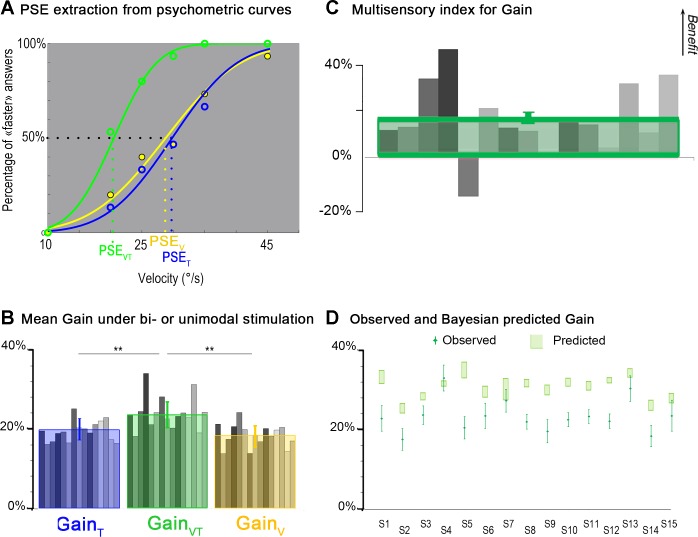
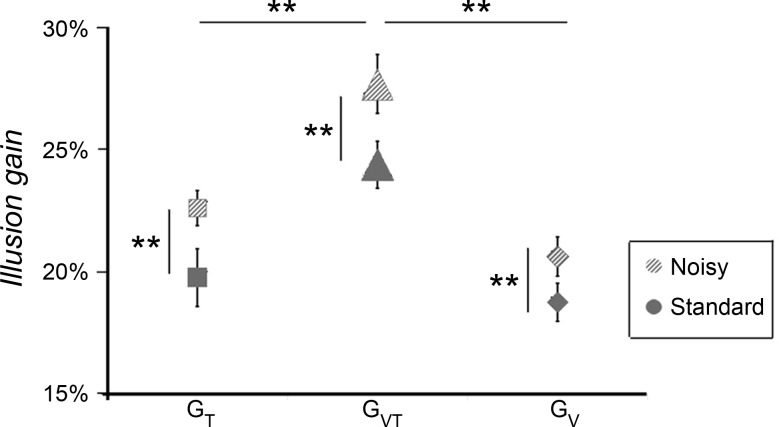
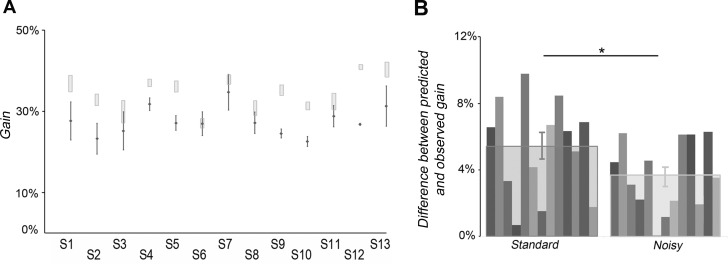
Illusory hand movements can be elicited by a textured disk or a visual pattern rotating under one's hand, while proprioceptive inputs convey immobility information (Blanchard C, Roll R, Roll JP, Kavounoudias A. PLoS One 8: e62475, 2013). Here, we investigated whether visuotactile integration can optimize velocity discrimination of illusory hand movements in line with Bayesian predictions. We induced illusory movements in 15 volunteers by visual and/or tactile stimulation delivered at six angular velocities. Participants had to compare hand illusion velocities with a 5°/s hand reference movement in an alternative forced choice paradigm. Results showed that the discrimination threshold decreased in the visuotactile condition compared with unimodal (visual or tactile) conditions, reflecting better bimodal discrimination. The perceptual strength (gain) of the illusions also increased: the stimulation required to give rise to a 5°/s illusory movement was slower in the visuotactile condition compared with each of the two unimodal conditions. The maximum likelihood estimation model satisfactorily predicted the improved discrimination threshold but not the increase in gain. When we added a zero-centered prior, reflecting immobility information, the Bayesian model did actually predict the gain increase but systematically overestimated it. Interestingly, the predicted gains better fit the visuotactile performances when a proprioceptive noise was generated by covibrating antagonist wrist muscles. These findings show that kinesthetic information of visual and tactile origins is optimally integrated to improve velocity discrimination of self-hand movements. However, a Bayesian model alone could not fully describe the illusory phenomenon pointing to the crucial importance of the omnipresent muscle proprioceptive cues with respect to other sensory cues for kinesthesia.

Keywords: Bayesian modeling; illusions; kinesthesia; multisensory integration; muscle proprioception.


Figures

Fig. 1.
Fig. 1.
Experimental set-up and stimulation devices. A: experimental setup including stimulation devices and motion capture system (CODAmotion) to record actual right hand movements in the reference movement condition. B: the textured disk used as tactile stimulation. C: visual pattern displayed by a video projector (see A). D: mechanical vibrators applied onto two antagonist wrist muscles (pollicis longus and extensor carpi ulnaris) to disturb muscle proprioceptive inputs (MP) in the noisy condition. Participants exposed to a counterclockwise rotation of the tactile and/or visual stimuli had to report whether the induced clockwise illusion of hand rotation they perceived was faster or slower than the velocity of the reference movement they actively executed before or after each stimulation.
Fig. 2.
Fig. 2.
Schematic representation of the maximum likelihood estimation (MLE) principle. To estimate self-hand movement velocity, the central nervous system is supposed to proceed as an inference machine: following MLE rules, unisensory cues (noisy, normally distributed representations of the stimulation velocity ϑT and ϑV on the basis of each sensory modality, touch and vision) are optimally combined to determine the minimum-variance visuotactile perceptual estimate (ϑVT). Right: MLE prediction for the visuotactile (VT) likelihood (with variance σVT2, black curve) resulting from the optimal combination of unimodal [visual (V) and tactile (T)] likelihoods (σT2 and σV2, dark gray and light gray curves, respectively).
Fig. 3.
Fig. 3.
Relationship between Bayesian and psychometric functions. A and B: the two different relevant conditions of stimulations (1 and 2) used to determine the discriminative threshold: the point of subjective equality (PSE; A) and the intensity leading to 84.13% of the “faster than the reference velocity” answer (B). Vref is the velocity of the reference movement (5°/s). σpost, μpost, and μi are parameters of the Bayesian functions: the SD and mean of the posterior distribution and the mean of the likelihood function (assumed equal to the stimulation velocity), respectively. σΨ and PSE are the psychophysical, measured parameters: the variance and mean of the psychometric function, respectively. The PSE is defined as the point of subjective equality, i.e., the stimulation intensity eliciting an illusory movement faster than the reference 50% of the time. These relations allow to estimate all the parameters of the hidden Bayesian functions as a function of the psychometric parameters (see Models).
Fig. 4.
Fig. 4.
Schematic representation of the key steps for predicting visuo-tactile gain on the basis of a prior-equipped Bayesian model. Step 1: prior variability estimation. The SD (σprior) of the prior distribution (black curve, centered on the null velocity) is estimated for each participant using (through Eq. 6) the psychometric parameters estimated in unimodal visual (orange curves) and tactile (blue curves) conditions. Step 2: prediction of the visuo-tactile gain. The expected PSE in the visuotactile stimulation (mean of the visuotactile likelihood depicted by the dashed green curve) is predicted on the basis of the estimate of the prior variance (step 1), the MLE-estimate for σVT2, and Eq. 7. The visuotactile gain is simply derived from the PSE (see definition in methods).
Fig. 5.
Fig. 5.
Comparison of velocity discrimination thresholds during tactile, visual, and visuotactile stimulation. A: extraction of σ from psychometric curves. Psychometric curves of one representative participant obtained by fitting the probabilities of perceiving the illusion as faster than the reference movement with a cumulative Gaussian distribution for the tactile stimulation (T; blue curve), visual stimulation (V; yellow curve), and visuotactile stimulation (VT; green curve) are shown. The discrimination threshold (σ) is the difference between the stimulation velocities leading to the faster answer 84.13% of the times and 50% of the times, and it is inversely related to the slope of the psychometric function. B: mean σ in bi- or unimodal stimulation. Mean individual values of σ (gray bars) and mean (±SD) values of σ extracted from the whole population data (N = 15) for tactile (blue square), visual (yellow square), and visuotactile (green square) stimulation are shown. For the mean σ values, significant differences were found between the bimodal and each of the two unimodal conditions (*P < 0.05; **P < 0.01). C: multisensory index for σ. Individual (gray bars) and mean multisensory index (green square) for σ (N = 15 participants) are shown. Positive and negative values correspond, respectively, to a multisensory benefit or loss in the discrimination performance of the participants with respect to their most efficient unimodal performance. D: comparison between observed and MLE-predicted σ. A comparison between observed σ in visuotactile stimulation and σ predicted by the MLE model for the 15 participants (S1 to S15) is shown. The green diamonds correspond to the observed data, and error bars are SDs. No significant difference was found between predictions and observations of σ (P = 0.55; not significant). Light green rectangles represent 95% confidence intervals (CIs) computed using the following bootstrap procedure. Choice data were resampled across repetitions (with replacement) and refitted 1,000 times to create sample distributions of the threshold for each psychometric function and for the predicted visuotactile parameters. CIs were directly estimated from these bootstrap samples (percentile method).
Fig. 6.
Fig. 6.
Comparison of the gains of the perceptual responses during tactile, visual, and visuo-tactile stimulation. A: extraction of the PSE from psychometric curves. Psychometric curves of one participant obtained by fitting the probability of perceiving the illusion as “faster than the reference” movement with a cumulative Gaussian distribution for the tactile stimulation (T; blue curve), visual stimulation (V; yellow curve), and visuotactile stimulation (VT; green curve) is shown. The PSE corresponds to the stimulation velocity leading to the faster than the reference answer 50% of the time. B: mean gain in bi- or unimodal stimulation. Mean individual values of gain (gray bars) and mean (±SD) values of gain calculated as the ratio between Vref and the actual velocity of the visual (yellow bars), tactile (blue bars), and visuotactile (green bars) stimulation at the PSE are shown. For the mean gain values, significant differences were found between the bimodal and each of the two unimodal conditions (*P < 0.05; **P < 0.01). C: multisensory index for gain. Individual (gray bars) and mean multisensory index (green square) of illusion gains (N = 15 participants) are shown. Positive and negative values correspond, respectively, to a multisensory increase or decrease in the gain of the perceptual illusions of the participants with respect to the best unimodal performance. D: comparison between observed and Bayesian-predicted gain. A comparison between observed gain in visuotactile stimulation and gain predicted by the Bayesian model with a zero-centered prior for the 15 participants (S1 to S15) is shown. The green diamonds correspond to the observed data, and error bars are SDs. The increase of the bimodal gain was predicted but overestimated by the model. Light green rectangles represent 95% CIs computed using the following bootstrap procedure. Choice data were resampled across repetitions (with replacement) and refitted 1,000 times to create sample distributions of the threshold for each psychometric function and for the predicted visuotactile parameters. The CIs were directly estimated from these bootstrap samples (percentile method).
Fig. 7.
Fig. 7.
Comparison of illusion gains between standard and noisy conditions. The mean gain (±SE) of the discrimination responses induced by tactile (T; squares), visual (V; diamonds), and visuotactile (VT; triangles) stimulation for the standard (gray) and noisy (hatched gray) conditions is shown. Note that illusion gains observed in the noisy conditions, in which muscle proprioception afferents were masked by an agoantagonist covibration, were significantly higher than those in the standard conditions whatever the stimulation (T, V, or VT). *P < 0.05; **P < 0.01.
Fig. 8.
Fig. 8.
Comparison of the Bayesian predictions for the standard and noisy conditions. A: Bayesian prediction versus observation in the noisy condition. A comparison between observed gains in visuotactile stimulation and gains predicted by the Bayesian model in the noisy condition for the 13 participants (S1 to S13) is shown. The dots correspond to individual observed data, and error bars are SDs. 95% CIs were computed using the following bootstrap procedure. Choice data were resampled across repetitions (with replacement) and refitted 1,000 times to create sample distributions of the threshold for each psychometric function and for the predicted visuotactile parameters. The CIs were directly estimated from these bootstrap samples (percentile method). Increase of the visuotactile gain was better predicted than in the standard condition but remained overestimated by the model. B: difference between predicted and observed gain. The quantitative difference between model predictions and empirically obtained values of visuotactile gain was significantly smaller in the noisy condition compared with the standard condition (P < 0.05).

Similar articles

Cited by

References

    1. Adams WJ, Banks MS, van Ee R. Adaptation to three-dimensional distortions in human vision. Nat Neurosci 4: 1063–1064, 2001. - PubMed
    1. Alais D, Burr D. The ventriloquist effect results from near-optimal bimodal integration. Curr Biol 14: 257–262, 2004. - PubMed
    1. Bensmaia SJ, Killebrew JH, Craig JC. Influence of visual motion on tactile motion perception. J Neurophysiol 96: 1625–1637, 2006. - PMC - PubMed
    1. Blanchard C, Roll R, Roll JP, Kavounoudias A. Combined contribution of tactile and proprioceptive feedback to hand movement perception. Brain Res 1382: 219–229, 2011. - PubMed
    1. Blanchard C, Roll R, Roll JP, Kavounoudias A. Differential contributions of vision, touch and muscle proprioception to the coding of hand movements. PLos One 8: e62475, 2013. - PMC - PubMed

LinkOut - more resources