. 2016 Jul 19;113(29):8260-5.
doi: 10.1073/pnas.1600974113. Epub 2016 Jul 6.

Source-sink plasmid transfer dynamics maintain gene mobility in soil bacterial communities

Affiliations

Source-sink plasmid transfer dynamics maintain gene mobility in soil bacterial communities

James P J Hall et al. Proc Natl Acad Sci U S A. .

Abstract

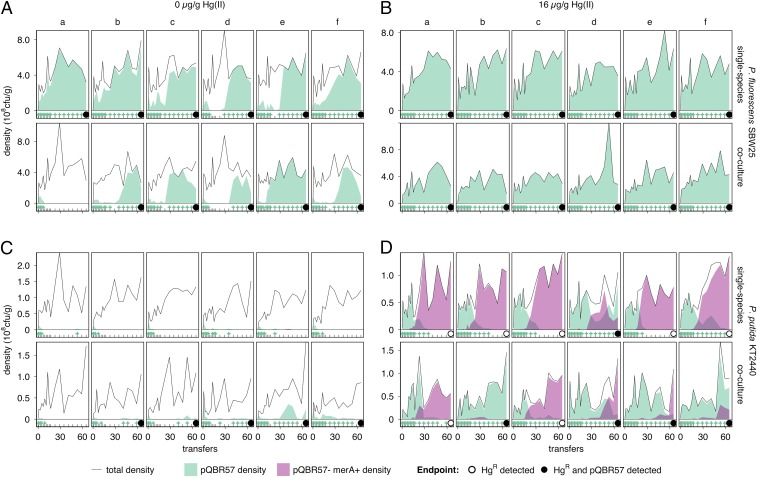
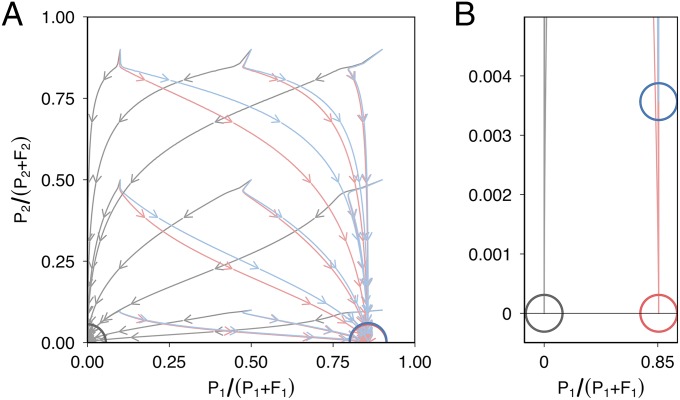
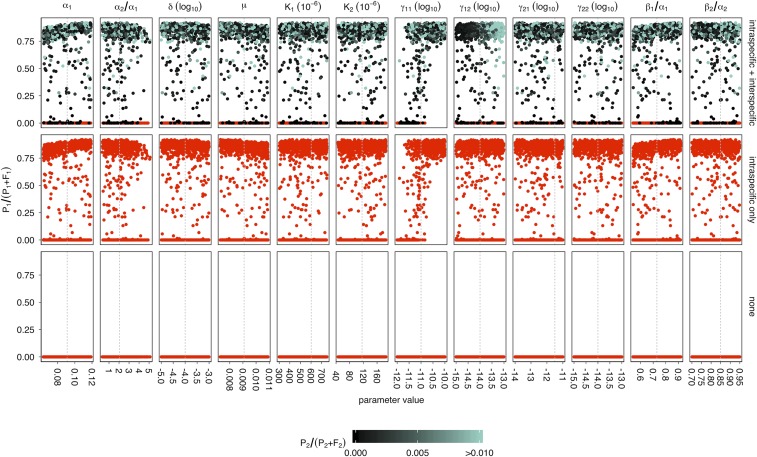
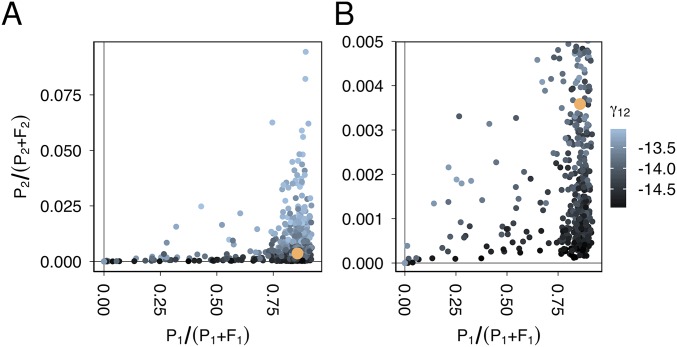
Horizontal gene transfer is a fundamental process in bacterial evolution that can accelerate adaptation via the sharing of genes between lineages. Conjugative plasmids are the principal genetic elements mediating the horizontal transfer of genes, both within and between bacterial species. In some species, plasmids are unstable and likely to be lost through purifying selection, but when alternative hosts are available, interspecific plasmid transfer could counteract this and maintain access to plasmid-borne genes. To investigate the evolutionary importance of alternative hosts to plasmid population dynamics in an ecologically relevant environment, we established simple soil microcosm communities comprising two species of common soil bacteria, Pseudomonas fluorescens and Pseudomonas putida, and a mercury resistance (Hg(R)) plasmid, pQBR57, both with and without positive selection [i.e., addition of Hg(II)]. In single-species populations, plasmid stability varied between species: although pQBR57 survived both with and without positive selection in P. fluorescens, it was lost or replaced by nontransferable Hg(R) captured to the chromosome in P. putida A simple mathematical model suggests these differences were likely due to pQBR57's lower intraspecific conjugation rate in P. putida By contrast, in two-species communities, both models and experiments show that interspecific conjugation from P. fluorescens allowed pQBR57 to persist in P. putida via source-sink transfer dynamics. Moreover, the replacement of pQBR57 by nontransferable chromosomal Hg(R) in P. putida was slowed in coculture. Interspecific transfer allows plasmid survival in host species unable to sustain the plasmid in monoculture, promoting community-wide access to the plasmid-borne accessory gene pool and thus potentiating future evolvability.

Keywords: horizontal gene transfer; microbial ecology; mobile genetic elements; plasmids.


Conflict of interest statement

The authors declare no conflict of interest.

Figures

Fig. 1.
Fig. 1.
Coculture with favorable host P. fluorescens promotes plasmid carriage in unfavorable P. putida. (A) P. fluorescens populations evolved with 0 µg/g Hg(II). The upper row of subpanels shows single-species populations; the lower row shows populations cultured alongside P. putida (coculture). Six replicate populations (columns, labeled a–f) were initiated for each treatment. Each subpanel shows, for an individual population, total density at transfer (solid line), the density of pQBR57+ (filled green area below the line), and the density of pQBR57– merA+ mutants (filled purple area below the line). For clarity, tick marks at the bottom of each subpanel indicate sampling times, and green “+” symbols indicate detection of pQBR57. A black circle at the final sampling point (transfer 65) indicates that HgR remained in the population at the end of the experiment; filled circles indicate pQBR57 (and HgR) remained. Note that no pQBR57– merA+ mutants were detected in P. fluorescens. (B) P. fluorescens populations evolved with 16 µg/g Hg(II). As in A, except evolved with 16 µg/g Hg(II). (C) P. putida populations evolved with 0 µg/g Hg(II). As in A, except populations were P. putida. The lower row of subpanels shows populations cultured alongside P. fluorescens (coculture). Each population of cocultured P. putida a–f was grown with the corresponding cocultured P. fluorescens population (a–f, A). (D) P. putida populations evolved with 16 µg/g Hg(II). As in C, except evolved with 16 µg/g Hg(II). Different y-axis scales are used for each species: P. fluorescens density was ∼5x P. putida.
Fig. 2.
Fig. 2.
A two-species model predicts between-species conjugation can promote plasmid carriage in an unfavorable host species. (A) Plasmid frequency in species 1 [P. fluorescens-like, P1/(P1+F1), x-axis] and species 2 [P. putida-like, P2/(P2+F2), y axis] was simulated over 5,000 iterations of a simple mass action plasmid dynamics model. The model was initiated with varying plasmid starting frequencies (0.1, 0.5, and 0.9). Arrows indicate the passage of time for each simulation, and a colored circle indicates the final state. Models omitting conjugation (gray) result in the loss of plasmid from both species. Models omitting interspecific conjugation (red) result in plasmid maintenance in species 1, but extinction in species 2, whereas models including interspecific conjugation (blue) result in plasmid maintenance at low levels in species 2. (B) Zoomed view of A. With interspecific conjugation, the plasmid is maintained at ∼0.35% in species 2.
Fig. S1.
Fig. S1.
A wide range of plausible biological values for model parameters produce qualitatively similar model outcomes. To test the sensitivity of the models to different parameter estimates, the three models (no conjugation, intraspecific conjugation only, intraspecific and interspecific conjugation) were run with 1,000 different combinations of parameter values, each of which was drawn from a uniform distribution covering a wide range of values (≥1 SE in each direction). Each subpanel shows P1/(P1+F1) (the proportion of plasmid-carrying species 1) at the end of 5,000 iterations of the model, plotted against the values of each parameter. Gray dashed lines indicate the values used in the originally parameterized model. Each column of subpanels refers to a different parameter, and each row of panels corresponds to one of the different models. Note that for “no conjugation” and “intraspecific conjugation only,” the corresponding γ parameters were always fixed at zero. Points are colored according to P2/(P2+F2) (the proportion of plasmid-carrying species 2), with lighter shades of green indicating models where P2/(P2+F2) exceeded 1% of the population, and red indicating models where P2/(P2+F2) was below 10−8 (approaching zero). Inspection of the model outcomes shows that P1/(P1+F1) was strongly dependent on γ11 (species 1 intraspecific conjugation rate) and weakly dependent on β1 (cost of plasmid carriage). P2/(P2+F2) was strongly dependent on P1/(P1+F1) (Fig. S2) and γ12 (interspecific conjugation rate from species 1 to species 2) and weakly dependent on β2.
Fig. S2.
Fig. S2.
Plasmid frequency in species 2 was strongly dependent on plasmid frequency in species 1 and the interspecific conjugation rate. (A) Endpoint plasmid frequencies from species 1 were plotted against endpoint frequencies species 2 for the 1,000 model simulation described in Fig. S1. Points are colored according to γ12 (interspecific conjugation rate from species 1 to species 2), except for one point in orange which shows the output of the originally parameterized model (Fig. 2). (B) Zoomed-in plot of A. Note that, even with low values of γ12, the plasmid is present in species 2, provided it is maintained in species 1.
Fig. S3.
Fig. S3.
Segregation rate affects qualitative model outcomes only at very high values. (A) To examine the sensitivity of the models to variation in plasmid segregation rate, we allowed segregation rates to vary between the species (δ1 for species 1, δ2 for species 2), and the three models were run with 1,000 different combinations of different segregation rates for each species (from 10−6 to 10−0.5). Each panel shows P1/(P1+F1) at the end of 5,000 iterations of the model plotted against the values of each parameter. Note that P1/(P1+F1) is strongly dependent on δ1, both with and without interspecific conjugation, but that this parameter does not affect plasmid survival unless it exceeds ∼10−2 h−1. (B) As in A, except the parameters are plotted against P2/(P2+F2). Note the different scales between A and B y axes. As with Fig. S1, the plasmid goes extinct in species 2 without interspecific conjugation. With interspecific conjugation both δ1 and δ2 affect P2/(P2+F2). However, the plasmid survives in species 2 even with high δ2, provided δ1 is sufficiently low to allow plasmid survival in species 1.
Fig. 3.
Fig. 3.
Short-term experiments show maintenance of pQBR57 by conjugation. (A) P. fluorescens donor and P. fluorescens recipient. Six replicate populations (columns, a–f) were initiated for each treatment. Each subpanel shows the densities at transfer of bacteria that began with pQBR57 (donors; dashed line) and bacteria that began without pQBR57 (recipients; solid line). The density of pQBR57+ is shown for the donors (filled yellow area below the dashed line) and the recipients (filled green area below the solid line). At the bottom of each subpanel, ticks indicate sampling points, green “+” symbols indicate detection of plasmid-bearing recipients, and a black circle indicates detection of plasmid-bearing recipients at the end of the experiment. (B) As in A, except the donor species was P. fluorescens and the recipient species was P. putida. The smaller subpanels below replicates b, c, and d show zoomed regions of the upper subpanels to indicate low-frequency pQBR57+ P. putida. (C) As in A, except with P. putida donor and P. fluorescens recipient.
Fig. S4.
Fig. S4.
A plasmid source enhances plasmid presence in a focal species. (A) Without selection, parameter space in which plasmids are lost (P=0, orange), plasmids are fixed (F=0, dark green), or a mixed population exists (P>0,F>0, light green). Intraspecific conjugation γ is shown on the x axis, and conjugation from the source Γ is on the y axis. Note that plasmids are only lost when Γ=0. (B) With selection, parameter space in which plasmids are lost and replaced by chromosomal mutants (P=0,Q=0, orange), plasmids are fixed (C=0, dark purple) or a mixed population exists (C>0,Q>0, light purple). The threshold for plasmid fixation (white line) both with and without selection is given by Eq. S3: Γ>μ((1/β)1)Kγ(1(μ/αβ)). This consistency is reflected in the experiments; if the plasmid is expected to be maintained in the absence of selection, then we do not expect the invasion of chromosomal mutants when selection is applied, whereas if plasmid loss is anticipated without selection, then conditions favor the invasion of chromosomal mutants under selection. Segregation is mathematically neglected to produce these figures (Supporting Information), but some segregation events are presumed to occur in order for chromosomal mutants to lose the plasmids.

References

    1. Frost LS, Leplae R, Summers AO, Toussaint A. Mobile genetic elements: The agents of open source evolution. Nat Rev Microbiol. 2005;3(9):722–732. - PubMed
    1. Halary S, Leigh JW, Cheaib B, Lopez P, Bapteste E. Network analyses structure genetic diversity in independent genetic worlds. Proc Natl Acad Sci USA. 2010;107(1):127–132. - PMC - PubMed
    1. Norman A, Hansen LH, Sørensen SJ. Conjugative plasmids: Vessels of the communal gene pool. Philos Trans R Soc Lond B Biol Sci. 2009;364(1527):2275–2289. - PMC - PubMed
    1. Baltrus DA. Exploring the costs of horizontal gene transfer. Trends Ecol Evol. 2013;28(8):489–495. - PubMed
    1. Bergstrom CT, Lipsitch M, Levin BR. Natural selection, infectious transfer and the existence conditions for bacterial plasmids. Genetics. 2000;155(4):1505–1519. - PMC - PubMed

Publication types

MeSH terms