. 2016 May 13;2(5):e1501639.
doi: 10.1126/sciadv.1501639. eCollection 2016 May.

Carbon sequestration potential of second-growth forest regeneration in the Latin American tropics

Robin L Chazdon  1 Eben N Broadbent  2 Danaë M A Rozendaal  3 Frans Bongers  4 Angélica María Almeyda Zambrano  2 T Mitchell Aide  5 Patricia Balvanera  6 Justin M Becknell  7 Vanessa Boukili  8 Pedro H S Brancalion  9 Dylan Craven  10 Jarcilene S Almeida-Cortez  11 George A L Cabral  11 Ben de Jong  12 Julie S Denslow  13 Daisy H Dent  14 Saara J DeWalt  15 Juan M Dupuy  16 Sandra M Durán  17 Mario M Espírito-Santo  18 María C Fandino  19 Ricardo G César  9 Jefferson S Hall  20 José Luis Hernández-Stefanoni  16 Catarina C Jakovac  21 André B Junqueira  22 Deborah Kennard  23 Susan G Letcher  24 Madelon Lohbeck  25 Miguel Martínez-Ramos  6 Paulo Massoca  26 Jorge A Meave  27 Rita Mesquita  26 Francisco Mora  28 Rodrigo Muñoz  27 Robert Muscarella  29 Yule R F Nunes  18 Susana Ochoa-Gaona  12 Edith Orihuela-Belmonte  12 Marielos Peña-Claros  4 Eduardo A Pérez-García  27 Daniel Piotto  30 Jennifer S Powers  31 Jorge Rodríguez-Velazquez  6 Isabel Eunice Romero-Pérez  27 Jorge Ruíz  32 Juan G Saldarriaga  33 Arturo Sanchez-Azofeifa  17 Naomi B Schwartz  34 Marc K Steininger  35 Nathan G Swenson  36 Maria Uriarte  34 Michiel van Breugel  37 Hans van der Wal  38 Maria D M Veloso  18 Hans Vester  39 Ima Celia G Vieira  40 Tony Vizcarra Bentos  26 G Bruce Williamson  41 Lourens Poorter  4
Affiliations

Carbon sequestration potential of second-growth forest regeneration in the Latin American tropics

Robin L Chazdon et al. Sci Adv. .

Abstract

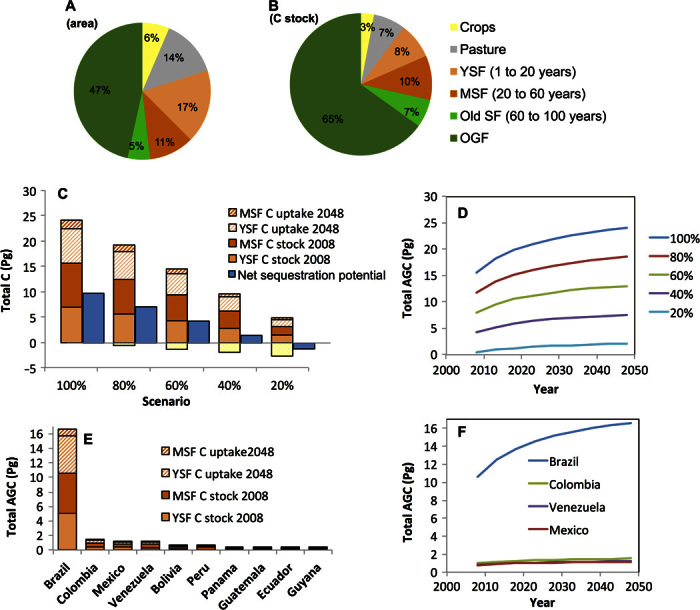
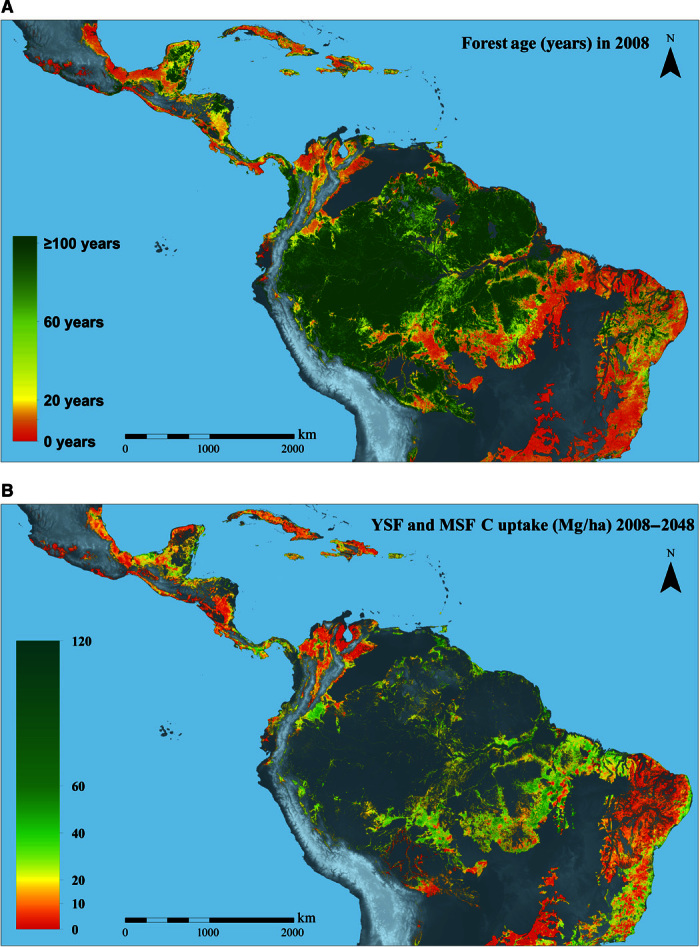
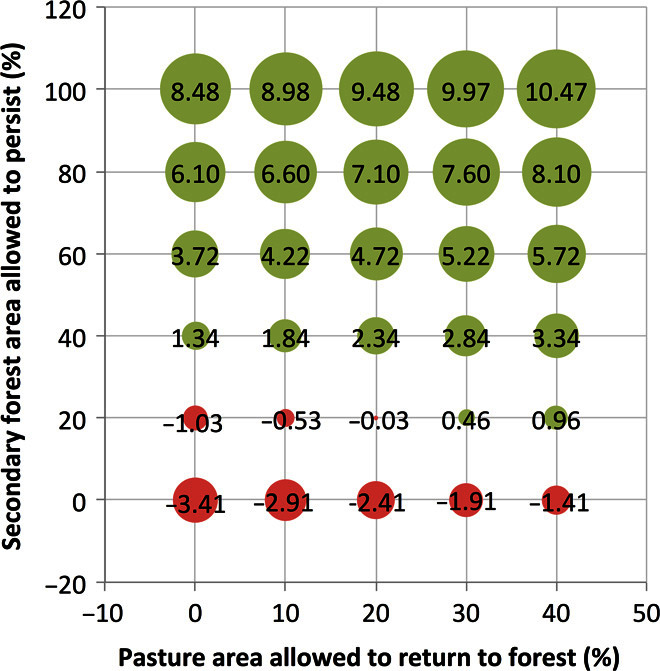
Regrowth of tropical secondary forests following complete or nearly complete removal of forest vegetation actively stores carbon in aboveground biomass, partially counterbalancing carbon emissions from deforestation, forest degradation, burning of fossil fuels, and other anthropogenic sources. We estimate the age and spatial extent of lowland second-growth forests in the Latin American tropics and model their potential aboveground carbon accumulation over four decades. Our model shows that, in 2008, second-growth forests (1 to 60 years old) covered 2.4 million km(2) of land (28.1% of the total study area). Over 40 years, these lands can potentially accumulate a total aboveground carbon stock of 8.48 Pg C (petagrams of carbon) in aboveground biomass via low-cost natural regeneration or assisted regeneration, corresponding to a total CO2 sequestration of 31.09 Pg CO2. This total is equivalent to carbon emissions from fossil fuel use and industrial processes in all of Latin America and the Caribbean from 1993 to 2014. Ten countries account for 95% of this carbon storage potential, led by Brazil, Colombia, Mexico, and Venezuela. We model future land-use scenarios to guide national carbon mitigation policies. Permitting natural regeneration on 40% of lowland pastures potentially stores an additional 2.0 Pg C over 40 years. Our study provides information and maps to guide national-level forest-based carbon mitigation plans on the basis of estimated rates of natural regeneration and pasture abandonment. Coupled with avoided deforestation and sustainable forest management, natural regeneration of second-growth forests provides a low-cost mechanism that yields a high carbon sequestration potential with multiple benefits for biodiversity and ecosystem services.

Keywords: biodiversity; biomass accumulation; carbon mitigation; ecology; forest regeneration; forest regrowth; secondary forests; tropical forests.


Figures

Fig. 1
Fig. 1. Area and carbon distributions in SFs in the lowland Neotropics.
(A and B) Percentages of modeled forest area (A) and AGC stock (B) in different land cover and forest age classes in 2008: cropland, pasture, forest ≤20 years (YSF), forest 20 to 60 years (MSF), forest 60 to 100 years (old SF), and forest >100 years (arbitrarily used as cutoff for OGF). (C) AGC stocks of YSFs and MSFs in 2008 (filled bars), and their net carbon sequestration from 2008 to 2048 (hatched bars). The total size of the bar indicates the total carbon stocks of those forests in 2048. Stacked bars are shown for five scenarios, where 100, 80, 60, 40, and 20% of the area are allowed to recover. The hatched yellow bar below the zero line indicates the carbon loss under these scenarios due to forest conversion to pasture or cropland in 2008, and the blue bar indicates the net sequestration potential of the different scenarios (carbon sequestration from 2008 to 2048 minus conversion-driven carbon loss in 2008). (D) Total AGC of YSFs and MSFs over the period 20082048 under different regeneration scenarios. (E) AGC of YSFs and MSFs in 2008, and their net carbon sequestration from 2008 to 2048 given 100% recovery, for each country separately. The total size of the bar indicates the total carbon stocks (AGC) of those forests in 2048. (F) Total AGC of YSFs and MSFs from 2008 to 2048 for the four countries with the largest carbon sequestration potential in naturally regenerating forests (see table S2 for more details).
Fig. 2
Fig. 2. Age and carbon sequestration maps of a lowland Neotropical forest.
(A and B) Modeled mean forest age in 2008 (A), and the total potential sequestered carbon in OGFs, 2008–2048 for all YSFs (≤20 years) and MSFs (20 to 60 years) in 2008 (B). The gray areas are areas with no data: above 1000-m altitude, savannas, rivers, lakes, OGFs, or urban areas. The biomes covered are moist and dry tropical forests.
Fig. 3
Fig. 3. Potential AGC sequestration (in petagrams) for scenarios of combinations of land use over four decades (2008–2048).
Land-use change combinations incorporate the percentage area of land allowed to regenerate following pasture abandonment (0 to 40% cessation of pasture use) and the percentage of YSF (≤20 years) and MSF (20 to 60 years) areas allowed to persist and continue regeneration (0 to 100% forest persistence). The size of the circles indicates the potential amount of carbon sequestered. Values in the cells indicate the magnitude of net carbon sequestered over 40 years (in petagrams), with all possible combinations of the two factors. These scenarios account for carbon loss due to SF clearing, which can lead to negative net carbon sequestration (red circles).

References

    1. Houghton R. A., Byers B., Nassikas A. A., A role for tropical forests in stabilizing atmospheric CO2. Nat. Clim. Chang. 5, 1022–1023 (2015).
    1. Pan Y., Birdsey R. A., Fang J., Houghton R., Kauppi P. E., Kurz W. A., Phillips O. L., Shvidenko A., Lewis S. L., Canadell J. G., Ciais P., Jackson R. B., Pacala S. W., McGuire A. D., Piao S., Rautiainen A., Sitch S., Hayes D., A large and persistent carbon sink in the world’s forests. Science 333, 988–993 (2011). - PubMed
    1. Wright S. J., The carbon sink in intact tropical forests. Glob. Chang. Biol. 19, 337–339 (2013). - PubMed
    1. FAO, Global Forest Resources Assessment 2015. How Are the World’s Forests Changing? (FAO, Rome, Italy, 2015).
    1. Aide T. M., Clark M. L., Grau H. R., López-Carr D., Levy M. A., Redo D., Bonilla-Moheno M., Riner G., Andrade-Núñez M. J., Muñiz M., Deforestation and reforestation of Latin America and the Caribbean (2001–2010). Biotropica 45, 262–271 (2013).

Publication types

LinkOut - more resources