. 2016 May 6;2(5):e1501705.
doi: 10.1126/sciadv.1501705. eCollection 2016 May.

A global quantification of "normal" sleep schedules using smartphone data

Affiliations

A global quantification of "normal" sleep schedules using smartphone data

Olivia J Walch et al. Sci Adv. .

Abstract

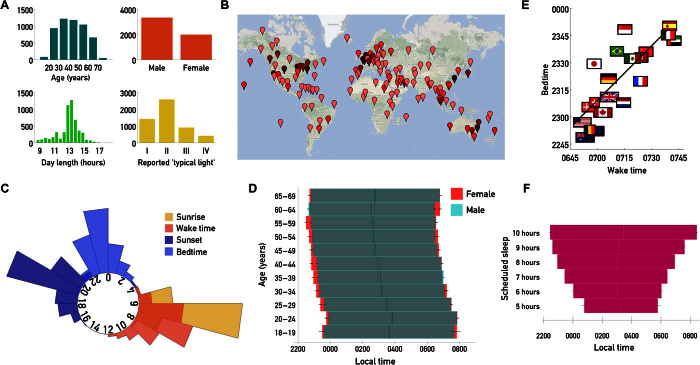
The influence of the circadian clock on sleep scheduling has been studied extensively in the laboratory; however, the effects of society on sleep remain largely unquantified. We show how a smartphone app that we have developed, ENTRAIN, accurately collects data on sleep habits around the world. Through mathematical modeling and statistics, we find that social pressures weaken and/or conceal biological drives in the evening, leading individuals to delay their bedtime and shorten their sleep. A country's average bedtime, but not average wake time, predicts sleep duration. We further show that mathematical models based on controlled laboratory experiments predict qualitative trends in sunrise, sunset, and light level; however, these effects are attenuated in the real world around bedtime. Additionally, we find that women schedule more sleep than men and that users reporting that they are typically exposed to outdoor light go to sleep earlier and sleep more than those reporting indoor light. Finally, we find that age is the primary determinant of sleep timing, and that age plays an important role in the variability of population-level sleep habits. This work better defines and personalizes "normal" sleep, produces hypotheses for future testing in the laboratory, and suggests important ways to counteract the global sleep crisis.

Keywords: sleep; sleep schedules; smart phones.


Figures

Fig. 1
Fig. 1. Demographics of the surveyed set and validation.
(A) Age, sex, day length, and lighting distributions from the user base. Lighting is divided into low indoor (I), bright indoor (II), low outdoor (III), and bright outdoor (IV). The vertical axis denotes the number of respondents in the cleaned data set. (B) Global spread of responses. One pin stands for every city that users could choose as their locale; darker colors indicate more responses from that location. Map data ©2015 Google. (C) The distribution of sunrise, sunset, wake time, and bedtime in the surveyed population, normalized and plotted on the circle. (D) Sleep scheduling by age and sex. We note a quadratic trend in sleep with age. We further note that women sleep more than men, through both earlier bedtimes and later wake times. (E) The 20 countries with the most respondents, plotted by mean wake time and bedtime. Geographically and culturally similar countries tend to cluster together. (F) Scheduled sleep and sleep duration, gauged by asking about normal habits. We note a significant quadratic trend in midsleep with sleep duration and that duration and timing are not independent variables in our data set (table S6).
Fig. 2
Fig. 2. Solar mediation of sleep.
Light profiles with different sunrise and sunset times are simulated. Between sunrise and the population mean wake time, light from the sun is blocked. Between sunset and the population mean bedtime, light input is set to a low level representing indoor light. (A1) Model prediction of sleep scheduling for indoor (brown) and outdoor (yellow) light populations at varying sunrise times. (A2) Sleep scheduling for indoor and outdoor light populations at varying sunrise times from the data. As in the model, later sunrise times correspond to later wake times and bedtimes, with the trend being most pronounced after 0630. (B1) Model prediction of sleep scheduling for indoor (brown) and outdoor (yellow) light populations at varying sunset times. A pronounced shift in both bedtime and wake time is observed, particularly for the outdoor population. (B2) Sleep scheduling for indoor and outdoor light populations at varying sunset times from the data. Later sunsets correlate with later wake times in the outdoor light population. (C1) and (C2) Predicted sleep duration for varying sunrises (C1) and sunsets (C2). The increase in sleep duration with later sunset predicted by the model is seen in the data set. (D) Later sunset time increases sleep duration. The sunset distribution is divided into thirds; purple indicates the population experiencing the earliest third of the sunset range, and blue indicates the population experiencing the latest third. Black x’s mark the overall population mean. To control for bedtime, only the population with the most frequent bedtime (2300) is plotted. (E) Later sunrises shift wake time later. Green, histogram of wake times for users experiencing early sunrises (before 0530); blue, histogram of wake times for users experiencing later sunrises (after 0730). Again, black x’s indicate the overall population mean.
Fig. 3
Fig. 3. Country effects on sleep duration act through bedtime.
(A) Wake time and sleep duration for the 20 countries in the data set with the most respondents. (B) Bedtime and sleep duration for the same 20 countries. A significant trend appears only in bedtime.
Fig. 4
Fig. 4. Differential sensitivity to sunrise and sunset across subpopulations and population-level differences.
(A) Regression coefficients resulting from multiple linear regression. This model assesses the contributions of sunrise and sunset to wake time and bedtime. For all groups, the coefficient corresponding to sunrise was higher than that for sunset for both wake time and bedtime. Generally, coefficients were higher for older populations (>55 years old), women, and those reporting outdoor light as “typical.” Bars show SDs found through bootstrapping. (B) SD in population-level sleep habits decreases with increasing age. Bars show SDs found through bootstrapping. (C) Normalized histograms for the older population (>55 years old) versus the younger population (<30 years old), plotted on the circle. Younger individuals have much wider and later distributions of wake time and bedtime. (D) Normalized histograms on the circle for men and women. These distributions are much more similar than those for the older and younger populations, with the distribution for women skewed slightly earlier for bed and slightly later for wake. (E) Fraction of population in each sleep duration group, split up into men and women. Women are more likely to be long sleepers (>9 hours) and show less of a shift in sleeping habits with increasing age.

References

    1. Roenneberg T., Allebrandt K. V., Merrow M., Vetter C., Social jetlag and obesity. Curr. Biol. 22, 939–943 (2012). - PubMed
    1. Wittmann M., Dinich J., Merrow M., Roenneberg T., Social jetlag: Misalignment of biological and social time. Chronobiol. Int. 23, 497–509 (2006). - PubMed
    1. Roenneberg T., Chronobiology: The human sleep project. Nature 498, 427–428 (2013). - PubMed
    1. Roenneberg T., Wirz-Justice A., Merrow M., Life between clocks: Daily temporal patterns of human chronotypes. J. Biol. Rhythms 18, 80–90 (2003). - PubMed
    1. Zavada A., Gordijn M. C. M., Beersma D. G. M., Daan S., Roenneberg T., Comparison of the Munich Chronotype Questionnaire with the Horne-Östberg’s Morningness-Eveningness Score. Chronobiol. Int. 22, 267–278 (2005). - PubMed

Publication types

LinkOut - more resources