Comparative Study
. 2016 Jul 7;4(1):37.
doi: 10.1186/s40168-016-0182-1.

The microbiota in bronchoalveolar lavage from young children with chronic lung disease includes taxa present in both the oropharynx and nasopharynx

Affiliations
Comparative Study

The microbiota in bronchoalveolar lavage from young children with chronic lung disease includes taxa present in both the oropharynx and nasopharynx

R L Marsh et al. Microbiome. .

Abstract

Background: Invasive methods requiring general anaesthesia are needed to sample the lung microbiota in young children who do not expectorate. This poses substantial challenges to longitudinal study of paediatric airway microbiota. Non-invasive upper airway sampling is an alternative method for monitoring airway microbiota; however, there are limited data describing the relationship of such results with lung microbiota in young children. In this study, we compared the upper and lower airway microbiota in young children to determine whether non-invasive upper airway sampling procedures provide a reliable measure of either lung microbiota or clinically defined differences.

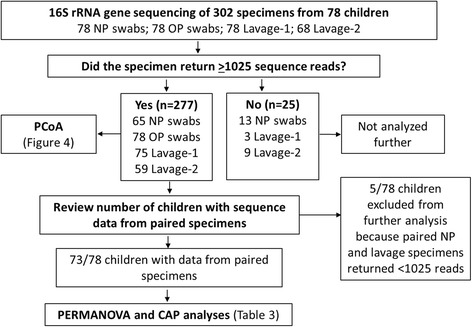
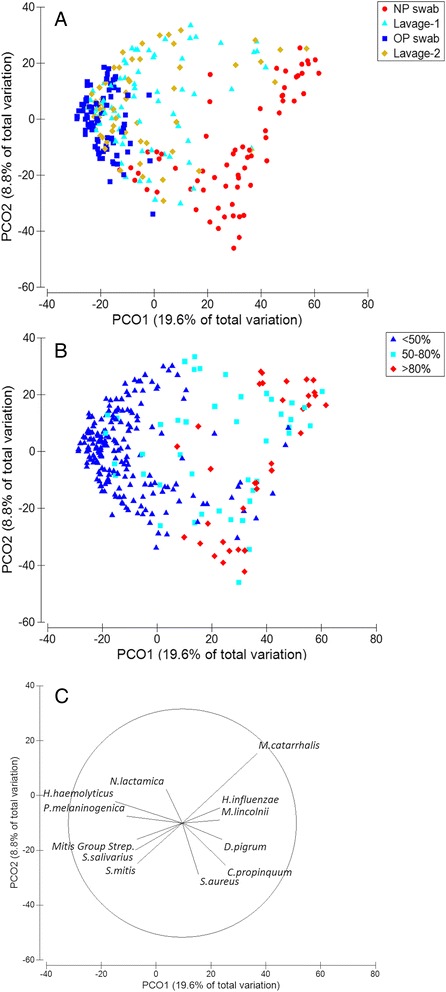
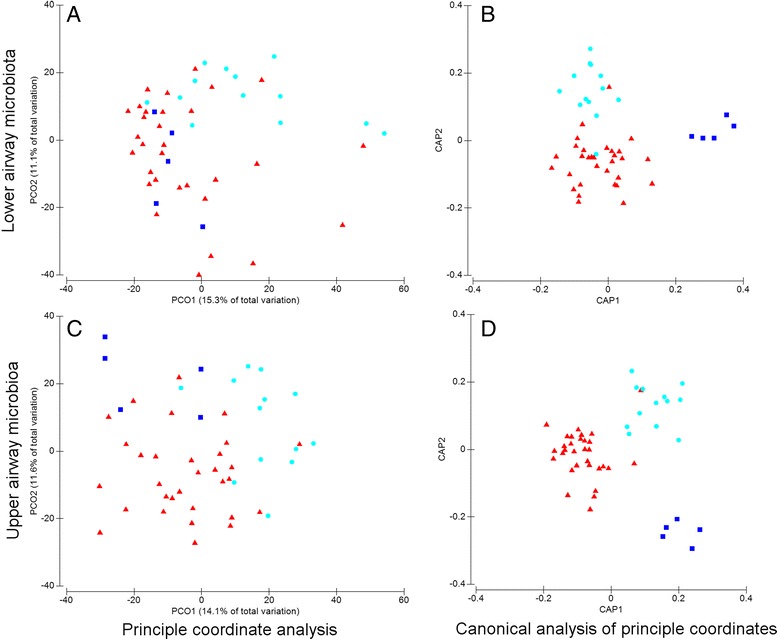
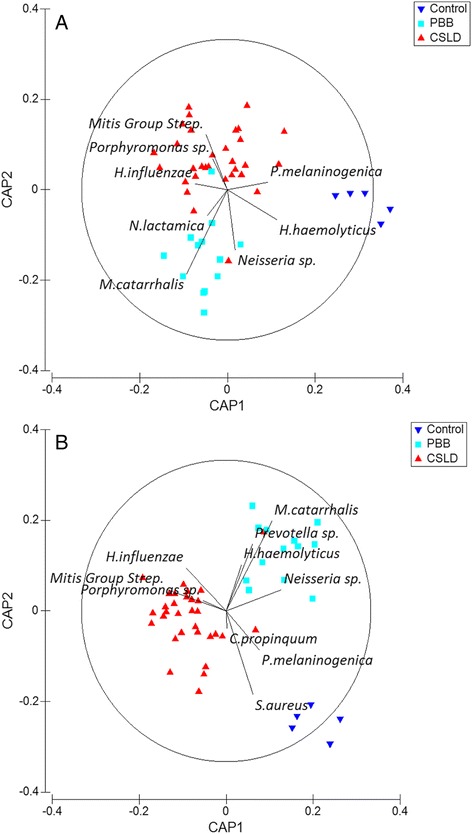
Results: The microbiota in oropharyngeal (OP) swabs, nasopharyngeal (NP) swabs and bronchoalveolar lavage (BAL) from 78 children (median age 2.2 years) with and without lung disease were characterised using 16S rRNA gene sequencing. Permutational multivariate analysis of variance (PERMANOVA) detected significant differences between the microbiota in BAL and those in both OP swabs (p = 0.0001, Pseudo-F = 12.2, df = 1) and NP swabs (p = 0.0001; Pseudo-F = 21.9, df = 1) with the NP and BAL microbiota more different than the OP and BAL, as indicated by a higher Pseudo-F value. The microbiota in combined OP and NP data (upper airways) provided a more comprehensive representation of BAL microbiota, but significant differences between the upper airway and BAL microbiota remained, albeit with a considerably smaller Pseudo-F (PERMANOVA p = 0.0001; Pseudo-F = 4.9, df = 1). Despite this overall difference, paired BAL and upper airway (OP and NP) microbiota were >50 % similar among 69 % of children. Furthermore, canonical analysis of principal coordinates (CAP analysis) detected significant differences between the microbiota from clinically defined groups when analysing either BAL (eigenvalues >0.8; misclassification rate 26.5 %) or the combined OP and NP data (eigenvalues >0.8; misclassification rate 12.2 %).

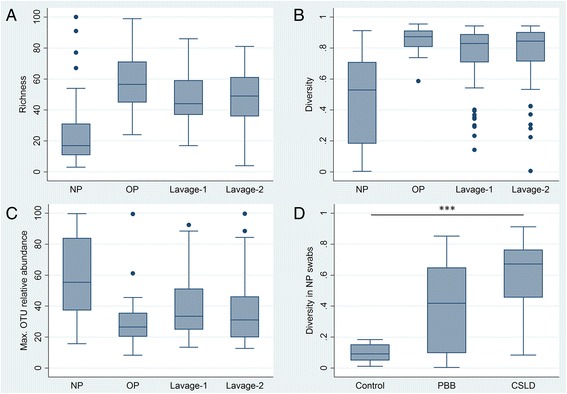
Conclusions: Upper airway sampling provided an imperfect, but reliable, representation of the BAL microbiota for most children in this study. We recommend inclusion of both OP and NP specimens when non-invasive upper airway sampling is needed to assess airway microbiota in young children who do not expectorate. The results of the CAP analysis suggest lower and upper airway microbiota profiles may differentiate children with chronic suppurative lung disease from those with persistent bacterial bronchitis; however, further research is needed to confirm this observation.

Keywords: Bronchoalveolar lavage; Lower airways; Microbiota; Nasopharynx; Oropharynx; Paediatric lung disease; Upper airways.


Figures

Fig. 1
Fig. 1
Summary of specimen processing after 16S rRNA gene sequencing. Specimens that returned <1025 reads were excluded from further analysis as bacterial community coverage in these specimens (based on rarefaction and Good’s coverage) was too low
Fig. 2
Fig. 2
Bacterial load in DNA extracted from clinical specimens. Bacterial load is expressed on a log-scale as genome equivalents (GE)/μL extracted DNA. The red dashed line indicates 1 × 103 GE/μL of the extracted DNA. The black dotted line indicates the qPCR limit of detection (90 GE). Quantification below the qPCR limit of detection (90 GE) is unreliable. NP NP swab, OP OP swab
Fig. 3
Fig. 3
Alpha diversity in the microbiota of different specimen types. a OTU-level richness in different specimen types. b Simpson’s index of diversity in different specimen types. Values approaching one indicate higher richness and more even community structure. Values approaching zero indicate communities dominated by a small number of taxa. c Relative abundance of the most dominant OTU in different specimen types (Max. OTU relative abundance). d Diversity in NP swabs from each diagnostic group. Diversity in NP swabs from control children was significantly lower than that in children with CSLD (Dunn’s post hoc test, p < 0.0001); comparisons between other groups did not reach statistical significance after correcting for multiple measures. NP NP swabs, OP OP swabs
Fig. 4
Fig. 4
Lavage microbiota shows similarity to both OP and NP. Principal coordinate analysis (PCoA) demonstrating relationships between the microbiota in different specimen types based on a Bray-Curtis similarity matrix derived from square root transformed OTU-level data. a The NP and OP microbiota were distinct, whereas Lavage-1 and Lavage-2 specimens were dispersed between the OP and NP data points. Red circles = NP swabs. Dark blue squares = OP swabs. Light blue triangles = Lavage-1. Mustard diamonds = Lavage-2. b Dispersion across the main axis (PCO1) reflected differences in the relative abundance of the dominant OTU. The PCoA is identical to that in part A of this figure but has been coloured to indicate the relative abundance of the dominant OTU. Dark blue triangles = dominant OTU at <50 % relative abundance. Light blue squares = dominant OTU at 50–80 % relative abundance. Red circles = dominant OTU at >80 % relative abundance. c A vector plot visualising directional effects of dominant OTUs (Table 2) in the different specimen types. Vectors show the Pearson rank correlation between each OTU and the PCO axes. The vectors are labelled to indicate the BLAST identification of dominant OTUs. The Mitis Group Streptococci vector indicates a single OTU that could not be identified to the species level. Mitis Group Streptococci include Streptococcus pneumoniae. Vectors are not shown for Porphyromonas, Terrahaemophilus, and Gemella OTUs as they overlapped with Neisseria, Prevotella and Haemophilus haemolyticus, respectively. Likewise, vectors are not shown for Granulicatella adiacens and Moraxella nonliquiefaciens as they overlapped with the Streptococcus mitis and Moraxella lincolnii vectors, respectively
Fig. 5
Fig. 5
Paired specimens from 65 % of children were more similar to each other than to specimens from other children. Hierarchical group average cluster analysis based on Bray-Curtis similarity matrix derived from square root transformed OTU-level data. Forty-nine children with sequence data for upper airway (combined NP and OP) and lower airway (combined Lavage-1 and Lavage-2) microbiota were included in the cluster analysis. Coloured symbols at the right of the figure indicate paired upper and lower airway data from individual children. A similarity profile permutation test was used to identify clusters with significant similarity (red dashed branches)
Fig. 6
Fig. 6
Significant discrimination of microbiota in different diagnostic groups detected for both the lower and upper airway data. Differences in the microbiota from children with CSLD (red triangles) and PBB (light blue circles) and control children (dark blue squares) were evident in principal coordinate analysis of the lower (a) and upper (c) airway data. In the lower airway plots, each data point represents the combined Lavage-1 and Lavage-2 data from a single child. Likewise, in the upper airway plots, each data point represents the combined NP and OP data from a single child. Canonical analysis of principal coordinates (CAP) from the lower (b) and upper (d) airway data discriminated the diagnostic groups. Each CAP included 49 children. CAP eigenvalues were all >0.8. The misclassification error was 26.5 and 12.2 % for the lower and upper airway data, respectively. CAP of lower and upper airway specimens were optimised with 26/49 and 18/49 PCO axes, respectively
Fig. 7
Fig. 7
Analysis of OTUs contributing to discrimination of clinically defined groups based on analysis of the lower or upper airway microbiota. SIMPER analysis was used to identify the top 10 OTUs contributing to discrimination of the CSLD and PBB groups. These OTUs were visualised on the CAP ordination with vectors whose length and direction reflected the Spearman rank correlations of these OTUs with the CAP axes. For the lower airway data (a), OTU vectors consistent with a Prevotella sp. and a Leptotrichia sp. are not shown as they overlapped with the M. catarrhalis and the Neisseria sp. vectors, respectively. For the upper airway data (b), the OTU vector consistent with M. lincolnii is not shown as it overlapped with the Porphyromonas sp. vector

References

    1. Bassis CM, Erb-Downward JR, Dickson RP, Freeman CM, Schmidt TM, Young VB, et al. Analysis of the upper respiratory tract microbiotas as the source of the lung and gastric microbiotas in healthy individuals. MBio. 2015;6(2):e00037. doi: 10.1128/mBio.00037-15. - DOI - PMC - PubMed
    1. Dickson RP, Martinez FJ, Huffnagle GB. The role of the microbiome in exacerbations of chronic lung diseases. Lancet. 2014;384(9944):691–702. doi: 10.1016/S0140-6736(14)61136-3. - DOI - PMC - PubMed
    1. Forton J. Induced sputum in young healthy children with cystic fibrosis. Paediatr Respir Rev. 2015;16(Suppl 1):6–8. - PubMed
    1. Whiteson KL, Bailey B, Bergkessel M, Conrad D, Delhaes L, Felts B, et al. The upper respiratory tract as a microbial source for pulmonary infections in cystic fibrosis. Parallels from island biogeography. Am J Respir Crit Care Med. 2014;189(11):1309–15. doi: 10.1164/rccm.201312-2129PP. - DOI - PMC - PubMed
    1. van der Gast CJ, Cuthbertson L, Rogers GB, Pope C, Marsh RL, Redding GJ, et al. Three clinically distinct chronic pediatric airway infections share a common core microbiota. Ann Am Thorac Soc. 2014;11(7):1039–48. doi: 10.1513/AnnalsATS.201312-456OC. - DOI - PMC - PubMed

Publication types