. 2016 Oct;245(10):1011-28.
doi: 10.1002/dvdy.24430. Epub 2016 Aug 17.

Insights into blood cell formation from hemogenic endothelium in lesser-known anatomic sites

Affiliations

Insights into blood cell formation from hemogenic endothelium in lesser-known anatomic sites

Amanda D Yzaguirre et al. Dev Dyn. 2016 Oct.

Abstract

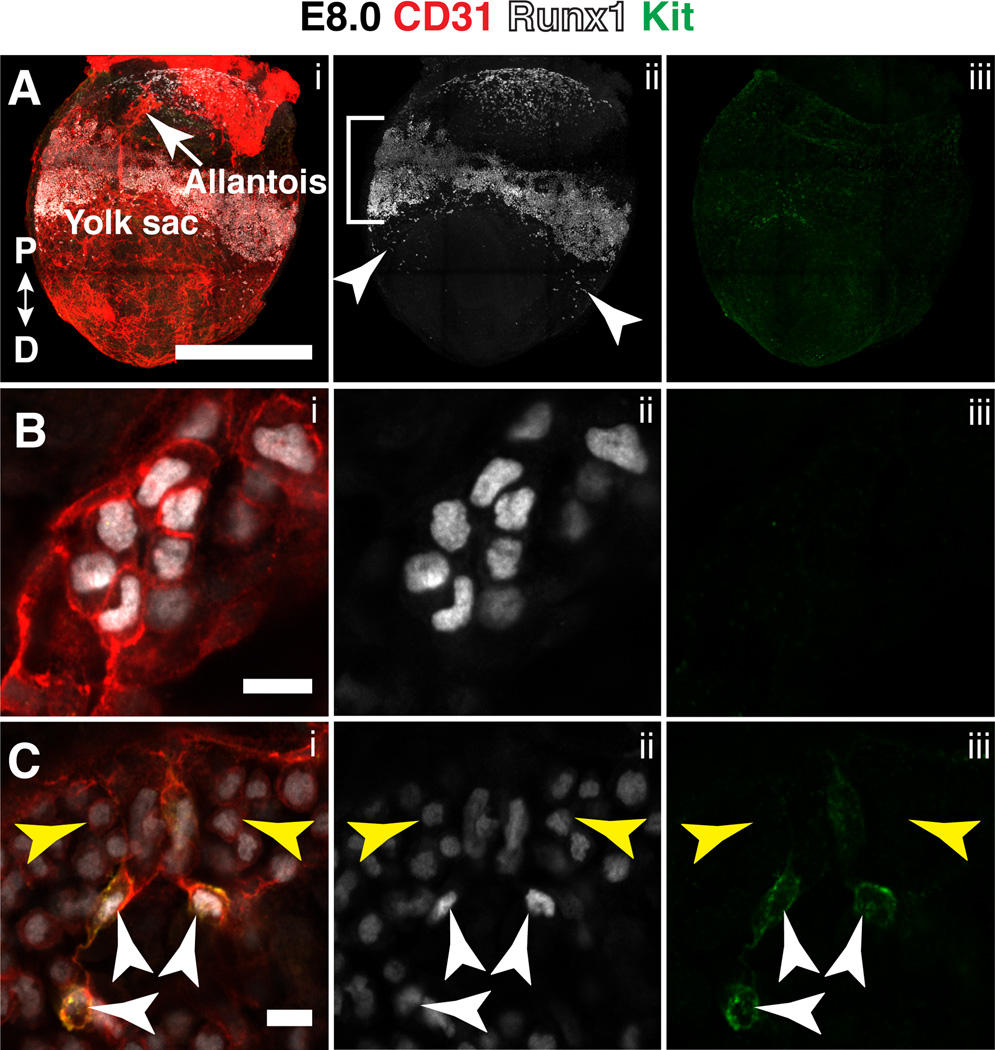
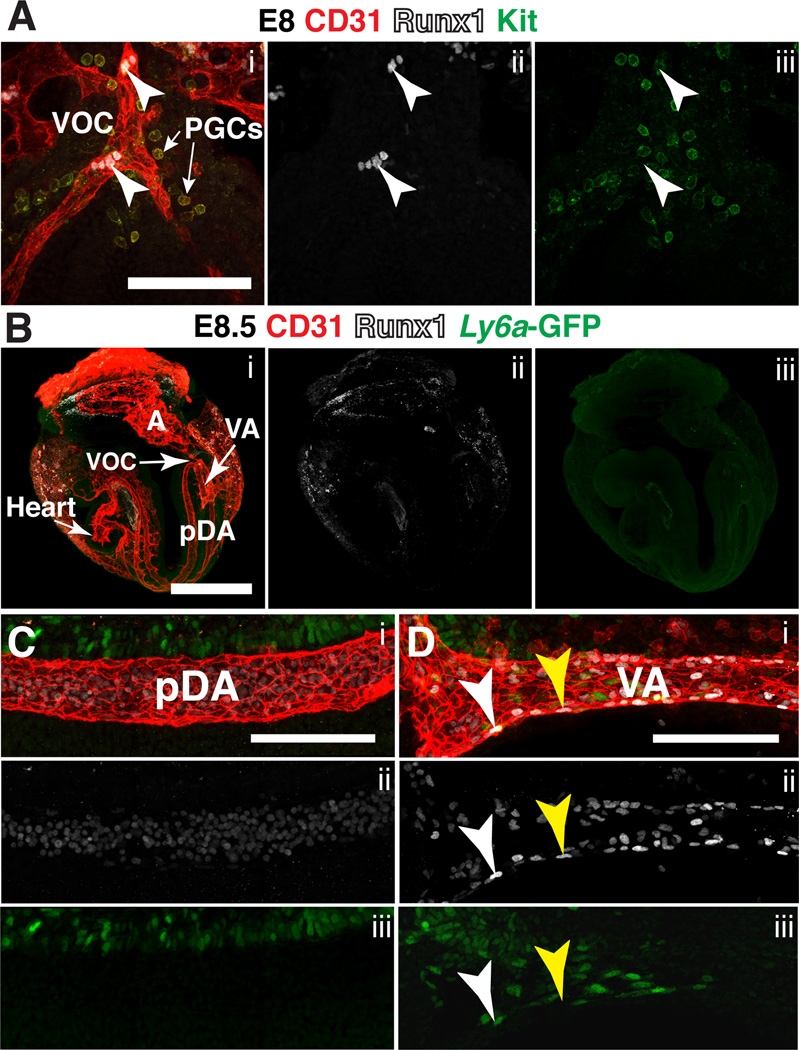
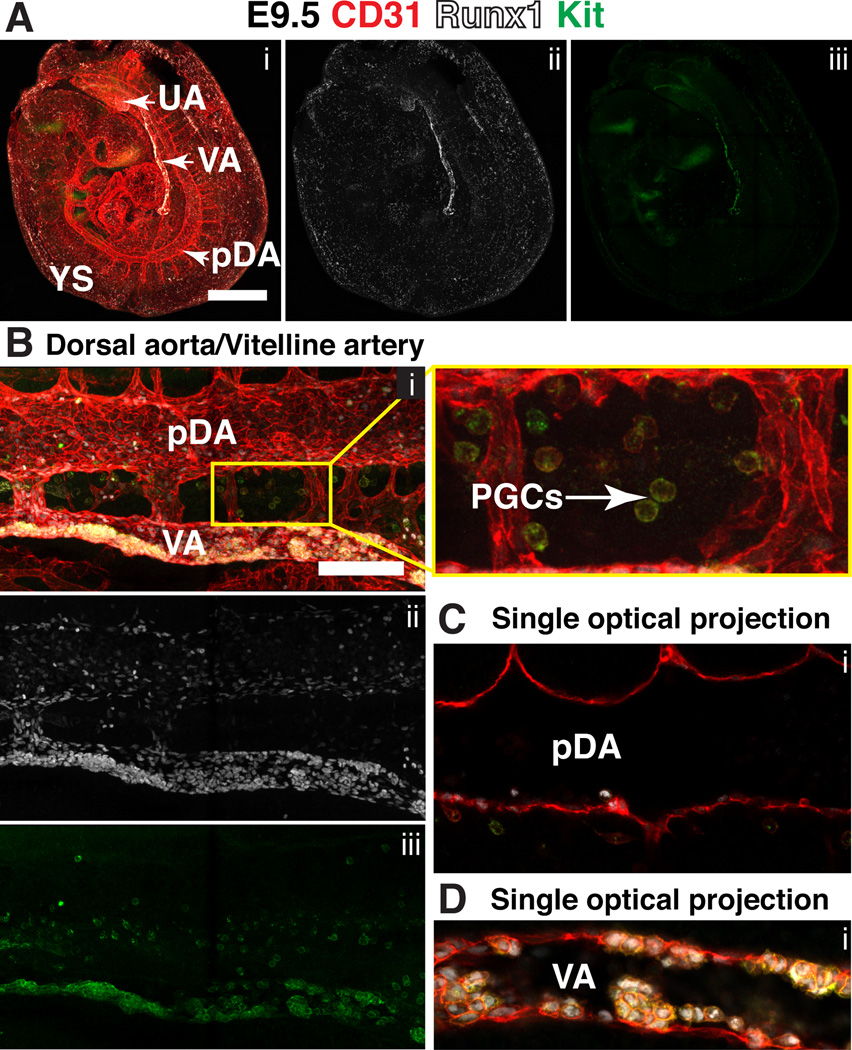
Background: Hematopoietic stem and progenitor cells (HSPCs) are generated de novo in the embryo in a process termed the endothelial to hematopoietic transition (EHT). EHT is most extensively studied in the yolk sac and dorsal aorta. Recently new sites of hematopoiesis have been described, including the heart, somites, head, and venous plexus of the yolk sac.

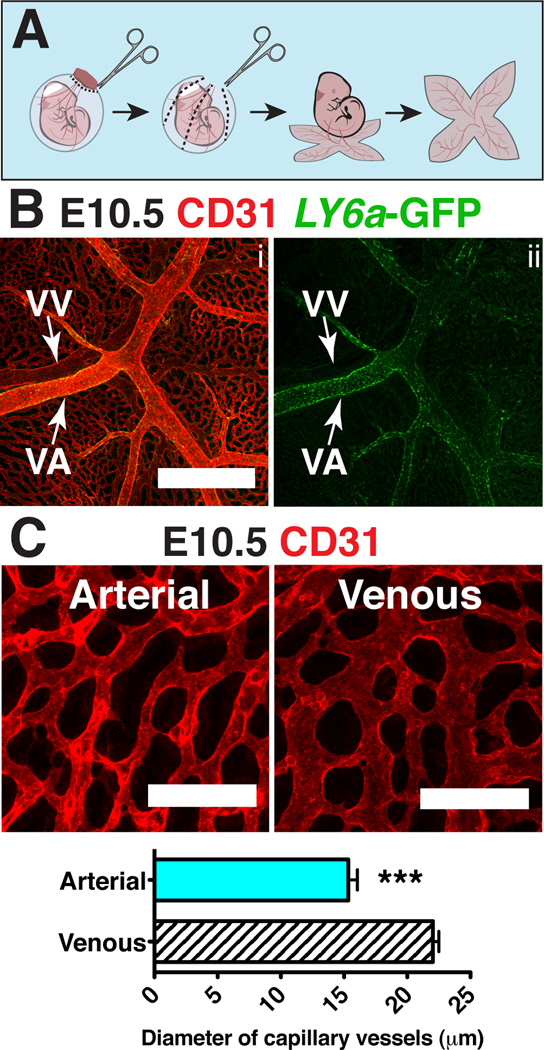
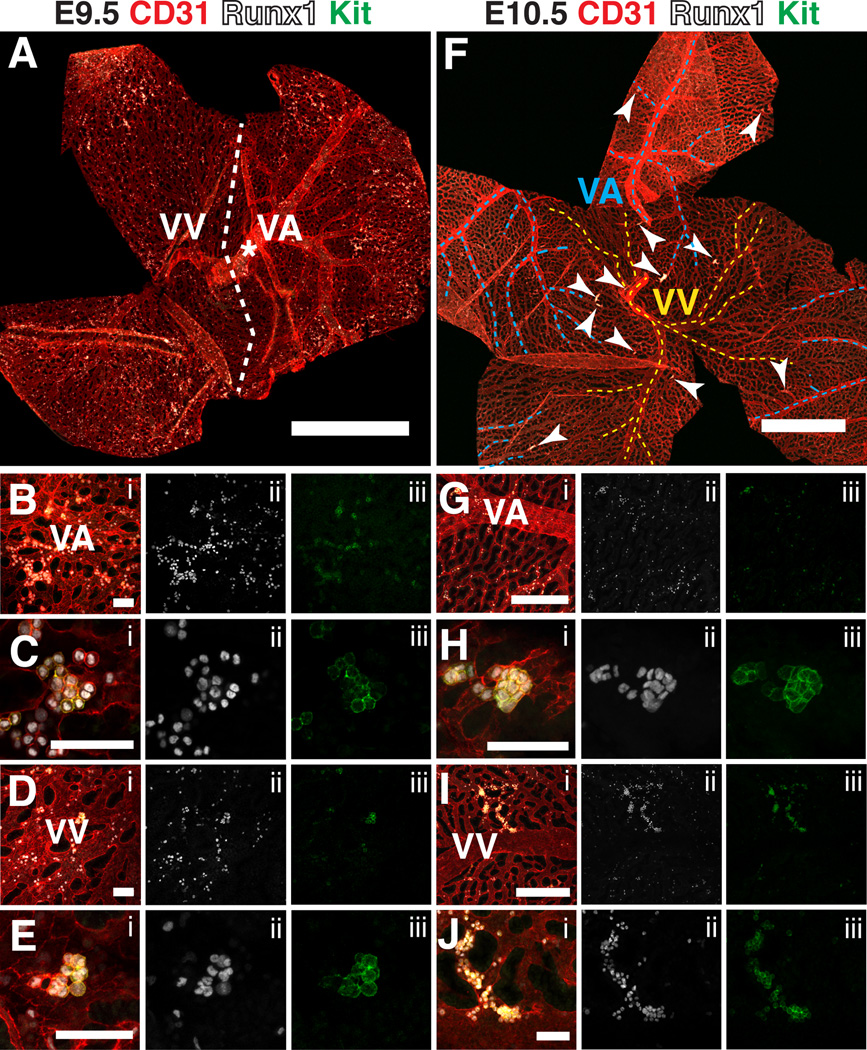
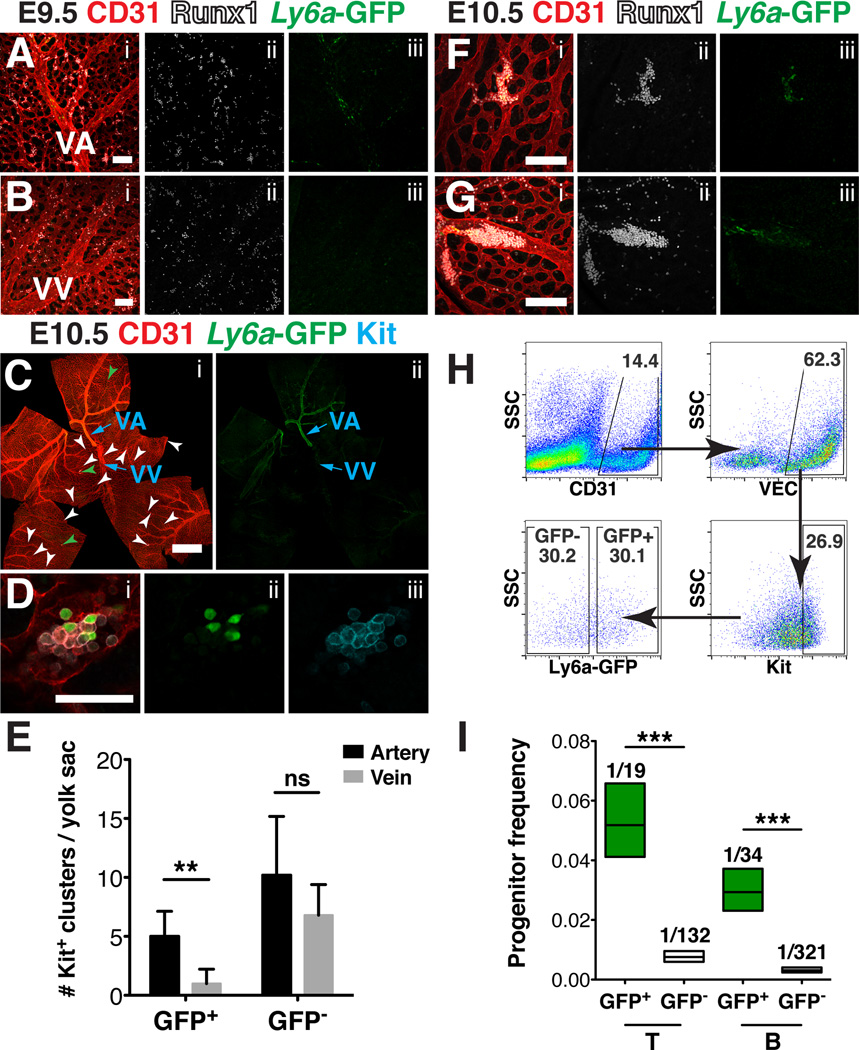
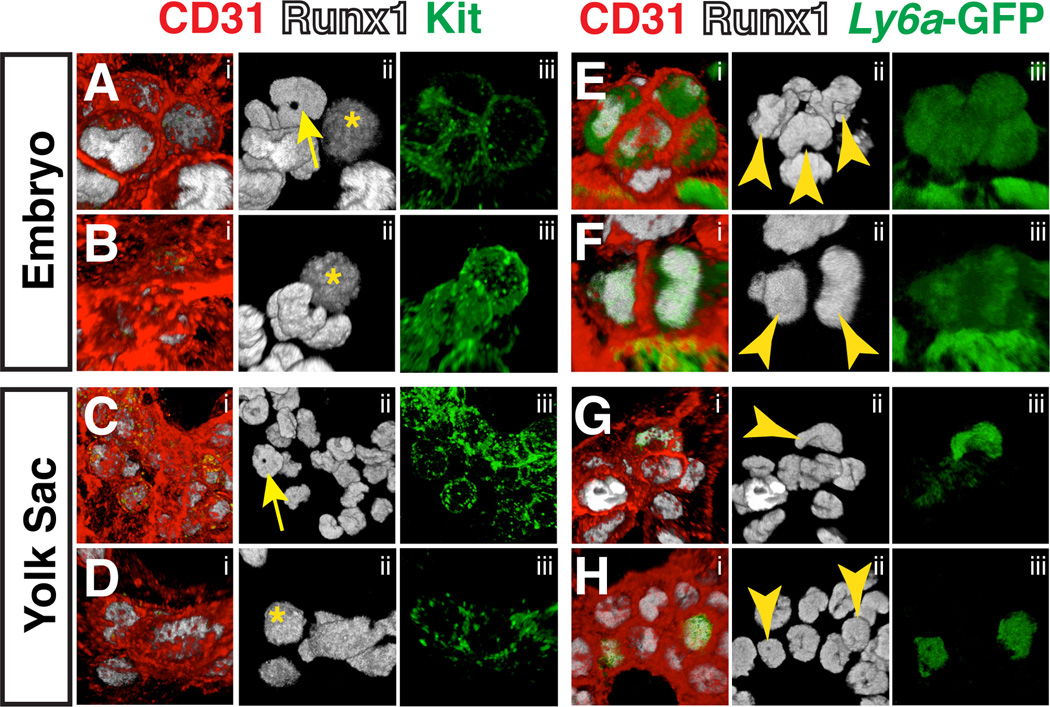
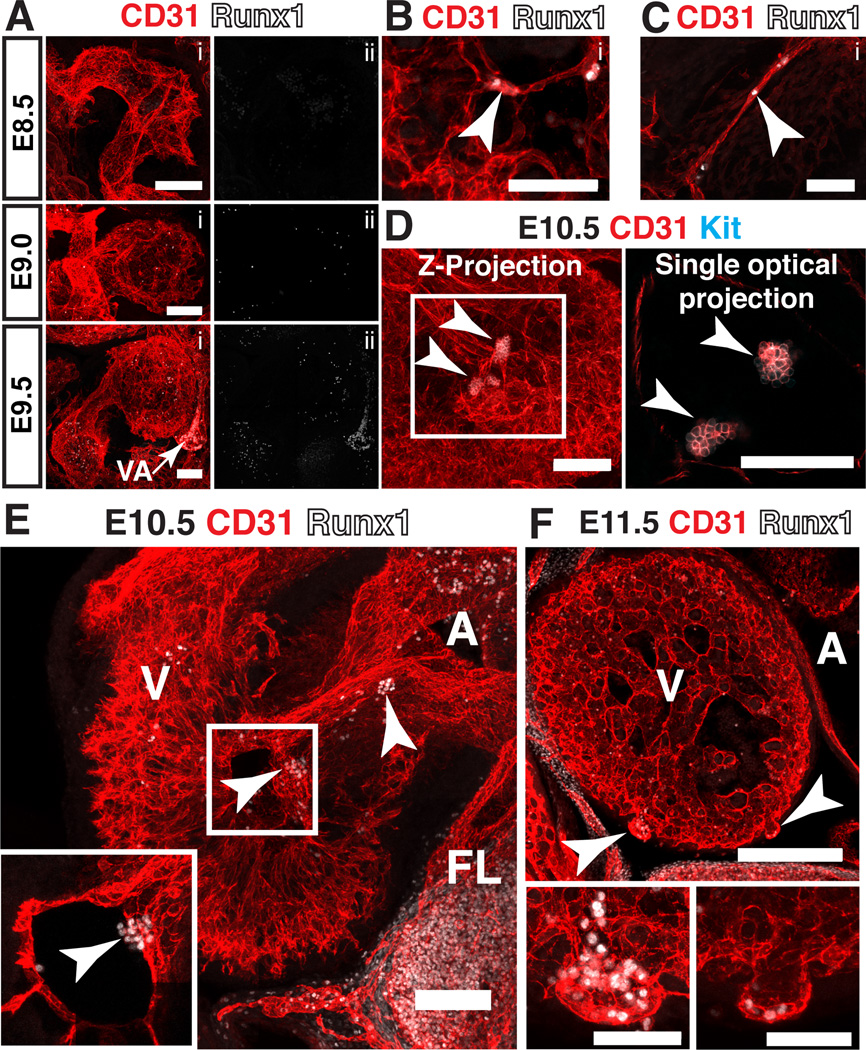
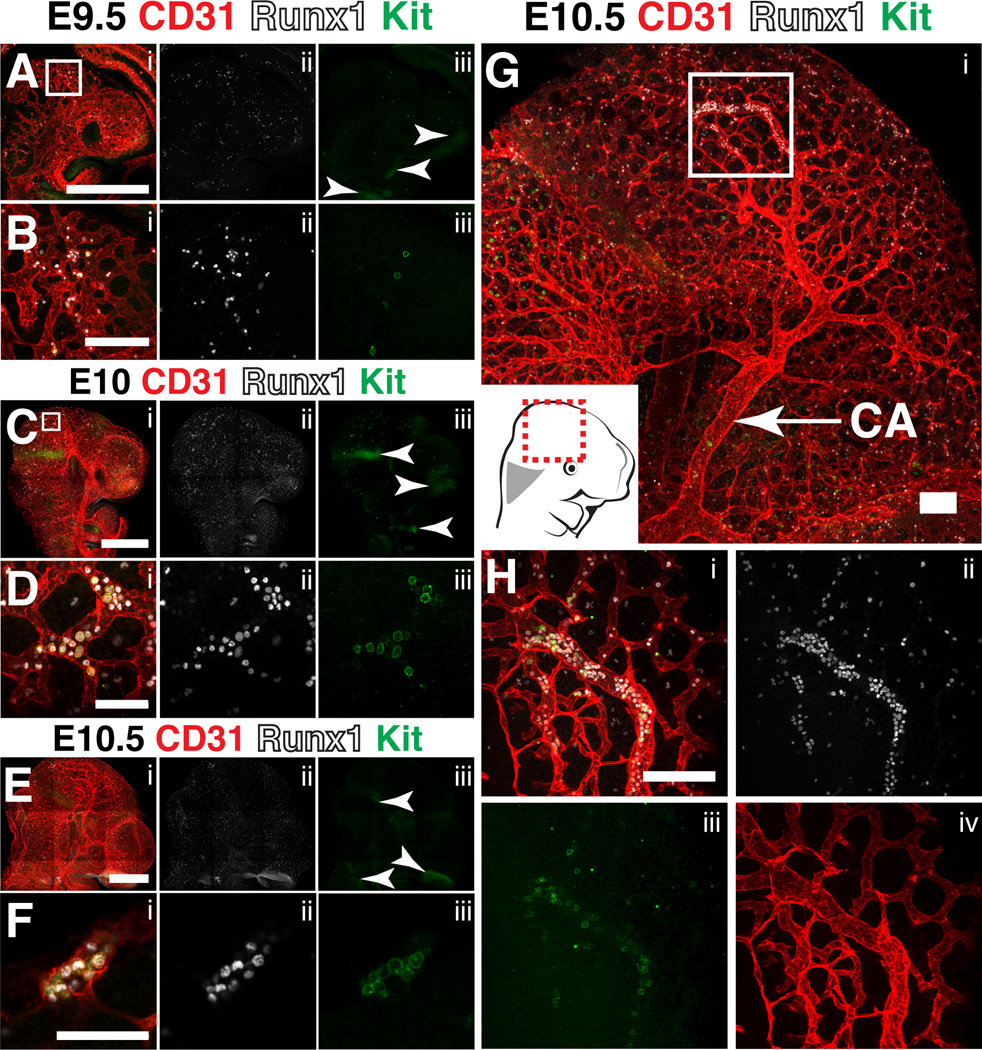
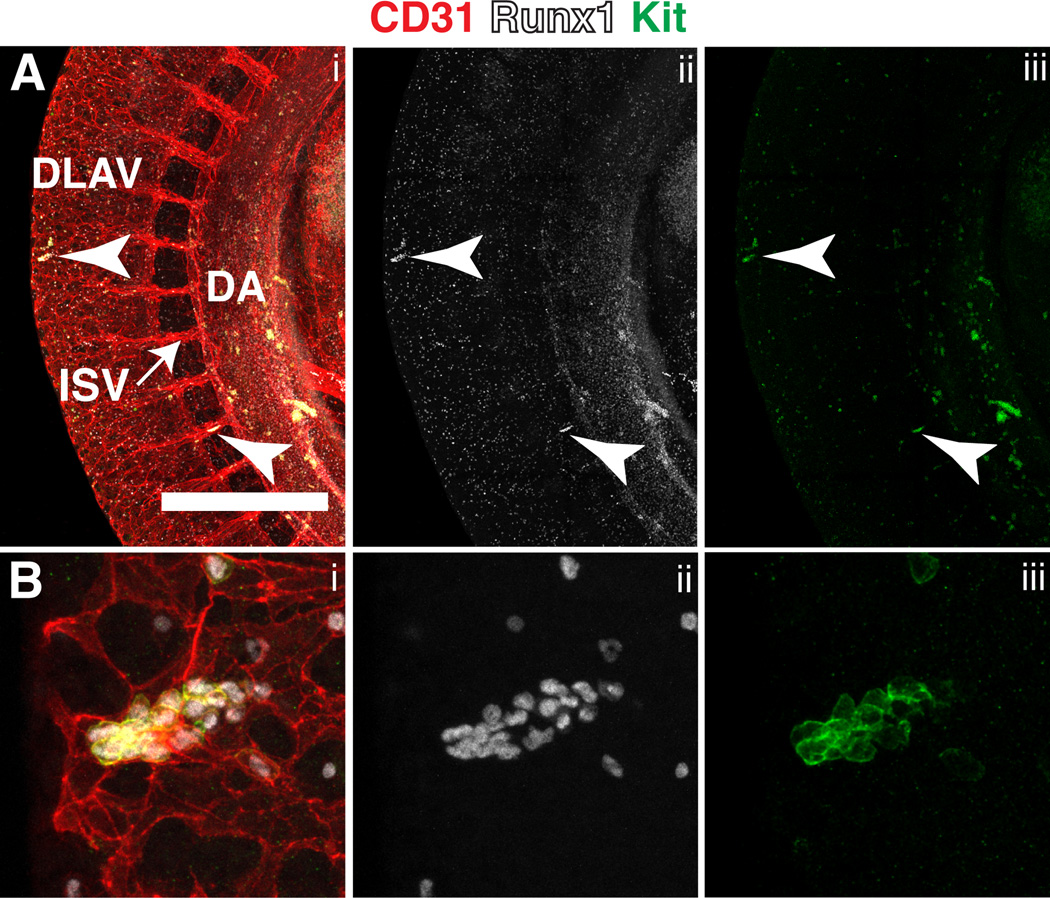
Results: We examined sites of HSPC formation in well-studied and in less well-known sites by mapping the expression of the key EHT factor Runx1 along with several other markers by means of confocal microscopy. We identified sites of HSPC formation in the head, heart and somites. We also identified sites of HSPC formation in both the arterial and venous plexuses of the yolk sac, and show that progenitors with lymphoid potential are enriched in hematopoietic clusters in close proximity to arteries. Furthermore, we demonstrate that many of the cells in hematopoietic clusters resemble monocytes or granulocytes based on nuclear shape.

Conclusions: We identified sites of HSPC formation in the head, heart, and somites, confirming that embryonic hematopoiesis is less spatially restricted than previously thought. Furthermore, we show that HSPCs in the yolk sac with lymphoid potential are located in closer proximity to arteries than to veins. Developmental Dynamics 245:1011-1028, 2016. © 2016 Wiley Periodicals, Inc.

Keywords: Ly6a; Runx1; embryo; head; heart; hematopoiesis; nuclear shape; somites; yolk sac.


Figures

Figure 1
Figure 1. Runx1 and Kit expression in the yolk sac at late head fold stage
(A–C) A late head fold stage (E8.0) mouse embryo immunostained for CD31 (i), Runx1 (i,ii) and Kit (i,iii). (A) Confocal Z-projection. Proximal (P) and distal (D) axes are indicated in i. Bracket in ii indicates band of Runx1+ cells in the proximal yolk sac. Arrowheads in ii point to Runx1+ cells located distal of the proximal band of Runx1+ cells. Scale bar = 500µm (see Movie 1 for animation of Z-stack). (B) Magnified image of Runx1+ cells in the distal yolk sac. Scale bar = 10µm. (C) Single optical projection showing hematopoietic cells (yellow arrowheads) and hemogenic endothelial cells (white arrowheads) in the proximal band of Runx1+ cells in the yolk sac. Scale bar = 10µm.
Figure 2
Figure 2. Distinguishing features of arteries and veins in the yolk sac
(A) Scheme demonstrating removal of the yolk sac prior to imaging to preserve orientation of the vitelline artery and vein. (B) Z-projection of an E10.5 Tg(Ly6a-GFP) yolk sac immunostained for CD31 (i) and GFP (i,ii) . Scale bar = 500µm, VV = vitelline vein and VA = vitelline artery. (C) Z-projection of arterial vascular plexus surrounding the vitelline artery (left) and venous plexus surrounding the vitelline vein (right) at E10.5 in samples immunostained for CD31. Scale bar = 100µm. The diameters of capillary vessels surrounding the vitelline artery and vein were measured using Image J software. Five E10.5 yolk sacs and 60 capillary vessels per yolk sac were measured. The diameter of arterial capillary vessels is 15.3µm ± 0.7µm and the diameter of venous capillary vessels is 22.0µm ± 0.5µm (mean ± SEM). Unpaired 2-tailed Student’s t-test was applied to determine significance. *** indicates that P ≤ 0.001.
Figure 3
Figure 3. Hematopoietic clusters in the vitelline artery and vein of the yolk sac from E9.5 to E10.5
(A) Confocal Z-projection of a 22sp yolk sac immunostained for CD31, Runx1 and Kit. Dotted line roughly demarcates the venous and arterial sides of the yolk sac. VA = vitelline artery, VV = vitelline vein. Scale bar = 1mm. (B–E) Confocal images of the vascular plexus near the vitelline artery and vein immunostained for CD31 (i), Runx1 (i,ii) and Kit (i,iii). Scale bars = 50µm. (B) Z-projection of the arterial plexus. (C) Single optical projection of a hematopoietic cluster in the vascular plexus in close proximity to the vitelline artery. (D) Z-projection of the venous plexus. (E) Z-projection of a hematopoietic cluster in the vascular plexus in close proximity to the vitelline vein. (F) Z-projection of an E10.5 yolk sac. Dotted blue lines demarcate the vitelline artery, dotted yellow lines demarcate the vitelline vein, and arrowheads point to CD31+ Runx1+ Kit+ clusters containing 5 or more cells. Scale bar = 1mm. (G–H) Immunostained for CD31 (i), Runx1 (i,ii) and Kit (i,iii). (G) Z-projection of an E10.5 yolk sac near the vitelline artery. Scale bar = 250 µm. (H) Z-projection of a hematopoietic cluster near the vitelline artery. Scale bar = 50µm. (I) Z-projection of the venous vasculature of an E10.5 yolk sac. Scale bar = 250µm. (J) Magnified image of hematopoietic cluster from (I). Scale bar = 50µm.
Figure 4
Figure 4. Hematopoietic progenitor potential of Kit high cluster cells in the yolk sac at E9.5 and E10.5
(A) Representative scatter plots of CD31+ VEC+ Kit high hematopoietic cluster cells collected from E9.5 and E10.5 wild type yolk sacs for progenitor assays. (B) The frequency of erythro-myeloid progenitors (EMP), T cell progenitors, and B cell progenitors in the VEC+ CD31+ Kithigh cluster population in the yolk sac at E9.5 and E10.5 (mean ± SD). Progenitor frequency is indicated above columns. Data are from three experiments using pooled cells from superovulated litters of E10.5 and E9.5 wild type embryos. Biological replicates are as follows: E9.5 EMP, n=8; E9.5 T progenitors, n=5; E9.5 B progenitors, n=4; E10.5 EMP, n=7; E10.5 T progenitors, n=7; E10.5 B progenitors, n=4. Unpaired two-tailed Student’s t-test applied to determine significance. * indicates that P ≤ 0.05 and ** indicates that P ≤ 0.01. (C) Percent of EMP colony type derived from sorted VEC+ CD31+ Kithigh cells. Mk: megakaryocyte; CFU-GEMM: granulocyte-erythroid-monocyte-megakaryocyte; BFU-E: burst forming unit-erythroid; G/M: granulocyte-macrophage colonies. Unpaired two-tailed Student’s t-test applied to determine significance.
Figure 5
Figure 5. Yolk sac lymphoid progenitors are enriched in the Ly6a GFP+ population of hematopoietic cluster cells that reside primarily in the arteries
(A–B, F–G) Immunostaining for CD31 (i), Runx1 (i, ii) and Ly6a-GFP (i, iii) (A) Confocal Z-projection of the vitelline artery (VA) and surrounding vascular plexus of a 28sp (E9.5) Tg(Ly6a-GFP) yolk sac. Scale bar = 100µm. (B) Z-projection of the vitelline vein (VV) and surrounding vascular plexus of a 28sp (E9.5) Tg(Ly6a-GFP) yolk sac. Scale bar = 100µm. (C) Z-projection of an E10.5 Tg(Ly6a-GFP) yolk sac immunostained for CD31 (i), GFP (i,ii) and Kit (i). White arrowheads point to hematopoietic clusters that contain 5 or more CD31+ Kit+ cells and no Ly6a–GFP+ cells, and green arrowheads point to hematopoietic clusters that contain 5 or more CD31+ Kit+ cells and at least 1 GFP+ cell. Scale bar = 1mm. (D) Magnified image of a hematopoietic cluster found within the vascular plexus of an E10.5 Tg(Ly6a-GFP) yolk sac immunostained for CD31 (i), GFP (i,ii) and Kit (i,iii). Scale bar = 50µm. (E) Quantification of CD31+ Kit+ hematopoietic clusters containing Ly6a–GFP+ cells closest to arteries (5.0 ± 2.1) and closest to veins (1.0 ± 1.2) (P ≤ 0.0065) and CD31+ Kit+ Ly6a-GFP hematopoietic clusters closest to arteries (10.2 ± 5.0) and closest to veins (6.8 ± 2.6), Mean ± SD, n = 5. Unpaired two-tailed Student’s t-test applied to determine significance. (F) Z-projection of a hematopoietic cluster within the vascular plexus of an E10.5 Tg(Ly6a-GFP) yolk sac. Scale bar = 100µm. (G) Z-projection of a hematopoietic cluster in the vitelline artery of an E10.5 Tg(Ly6a-GFP) yolk sac. Scale bar = 100µm. (H) Representative scatter plots of CD31+ VEC+ Kithigh Ly6a-GFP+ and CD31+ VEC+ Kithigh Ly6a-GFP hematopoietic cluster cells collected from Tg(Ly6a-GFP) E10.5 yolk sacs for progenitor assays. (I) Frequency of HSPCs with T and B cell potential in the VEC+ CD31+ Kithigh Ly6a-GFP+ and VEC+ CD31+ Kithigh Ly6a-GFP cluster populations from E10.5 yolk sacs (progenitor frequency ± lower and upper 95% confidence intervals). Progenitor frequency is indicated above columns. Data represent 5 biological replicates using pooled cells from superovulated litters of E10.5 Tg(Ly6a-GFP) embryos collected in 3 independent experiments. ELDA software (Hu and Smyth, 2009) was applied to determine progenitor frequencies and P values.
Figure 6
Figure 6. Expression of Runx1 in the major arteries at E8.0 and E8.5
(A) Confocal Z-projection of the vessel of confluence (VOC) and surrounding primordial germ cells (PGCs) in a late head fold stage embryo (E8.0) immunostained for CD31 (i), Runx1 (i,ii) and Kit (i,iii). White arrowheads point to CD31+ Runx1+ endothelial cells in the VOC. Scale bar = 100µm. (B–D) Immunostaining for CD31 (i), Runx1 (i,ii) and Ly6a-GFP (i,iii). (B) Confocal Z-projection of a 6 sp (E8.5) Tg(Ly6a-GFP) embryo. The top and bottom Z-sections containing the yolk sac were removed to make the vasculature in the embryo proper visible. A = allantois, VA = vitelline artery, pDA = paired dorsal aortae, VOC = vessel of confluence. Scale bar = 500µm. See Movie 2 for animation of Z-stack. (C) Z-projection of one of the two vessels that make up the paired dorsal aortae in an E8.5 Tg(Ly6a-GFP) embryo. Scale bar = 100µm. (D) Z-projection of the vitelline artery; white arrowhead points to a CD31+ Runx1+ Ly6a–GFP+ endothelial cell and yellow arrowhead points to a CD31+ Runx1+ Ly6a–GFP endothelial cell. Scale bar = 100µm.
Figure 7
Figure 7. Expression of Runx1 and Kit in the major arteries at E9.5
(A–D) Immunostaining for CD31 (i), Runx1 (i,ii) and Kit (i,iii). (A) Confocal Z-projection of a 25sp mouse embryo partially enveloped in its yolk sac. Scale bar = 500µm. See Movie 3 for animation of Z-stack (B) Z-projection of the paired dorsal aortae (pDA) and vitelline artery (VA). Scale bar = 100µm. Magnified view of boxed region on the right shows primordial germ cells (PGCs) in between the pDA and VA. (C) Single optical projection through the pDA shown in (B). (D) Single optical projection through the VA shown in (B); clusters are visible on both the ventral and dorsal sides of the VA.
Figure 8
Figure 8. Confocal analysis of hematopoietic cluster cell nuclear shape at E10.5
(A–D) Immunostaining for CD31 (i), Runx1 (i,ii) and Kit (i,iii). (A–D) yellow asterisks indicate round nuclei and yellow arrow indicates ring-shaped nuclei. (A–B) Confocal Z-projections of hematopoietic clusters containing ring, bean, and round-shaped nuclei in the umbilical artery of an E10.5 embryo. (C–D) Z-projections of hematopoietic clusters in the yolk sac of an E10.5 embryo. (E–H) Immunostaining for CD31 (i), Runx1 (i,ii) and Ly6a-GFP (i,iii) (E–F) Z-projections of hematopoietic clusters in the umbilical arteries of E10.5 Tg(Ly6a-GFP) embryos. Yellow arrowheads point to nuclei in Ly6a–GFP+ cluster cells. (G–H) Z-projections of hematopoietic clusters in the yolk sacs of E10.5 Tg(Ly6a-GFP) embryos. Yellow arrowheads point to nuclei in Ly6a–GFP+ cluster cells(see movies 4–11 for 3D reconstruction of cluster cell nuclei).
Figure 9
Figure 9. Hematopoietic cluster formation in the heart
(A–C) Immunostaining for CD31 (i) and Runx1 (i,ii). (A) Confocal Z-projections of the hearts of E8.5 (9sp), E9 (16sp) and E9.5 (22sp) embryos. VA = vitelline artery. (B) Z-projection of the ventricle of an E10.5 embryo. Arrowhead points to a Runx1+ endocardial cell. Scale bar = 50µm. (C) Z-projection of the atrioventricular canal of an E10.5 embryo. Arrowhead points to Runx1+ endocardial cell. Scale bar = 50µm. (D) Ventricle of an E10.5 mouse embryo immunostained for CD31 and Kit. Arrowheads point to hematopoietic clusters in the ventricular cavity in both the Z-projection and the single optical projection. All scale bars = 100µm. (E) Confocal Z-projection of the heart of an E10.5 embryo immunostained for CD31 and Runx1. Arrowheads point to hematopoietic clusters in the ventricular cavity and atrioventricular canal. Inset represents a single optical projection showing the hematopoietic cluster in the ventricular cavity. A = atrium, V = ventricle, FL = fetal liver. (F) Z-projection of the heart of an E11.5 embryo immunostained for CD31 and Runx1. Arrowheads point to cardiac blood islands. A = atrium, V = ventricle; scale bars = 250µm. Lower panels are magnified images of cardiac blood islands. Scale bars in lower panels = 50µm.
Figure 10
Figure 10. Hematopoietic cluster formation in the head
(A–H) Immunostaining for CD31 (i), Runx1 (i,ii) and Kit (i,iii). (A) Confocal Z-projection of the head of an E9.5 embryo. Scale bar = 500µm. Arrowheads point to Runx1 Kit+ neurons. (B) Magnified view of the boxed region in (A) demonstrating the presence of Runx1+ Kit+ and Runx1+ Kit cells with hematopoietic morphology within the cephalic vascular plexus. Scale bar = 50µm. (C) Confocal Z-projection of the head of an E10.0 embryo. Arrowheads point to Runx1 Kit+ neurons. Scale bar = 500µm. (D) Magnified view of the boxed region in (C). Scale bar = 50µm. (E) Confocal Z-projection of the head of an E10.5 embryo. Arrowheads point to Runx1 Kit+ neurons. Scale bar = 500µm. (F) Single optical projection of a hematopoietic cluster found in the peripheral cephalic plexus of the E10.5 head in (E). Scale bar = 50µm. (G) Confocal Z-projection of the head of an E10.5 embryo. CA=carotid artery; scale bar = 100µm. (H) Magnified view of boxed region in (G). Scale bar = 100µm.
Figure 11
Figure 11. Hematopoietic cluster formation in the somitic region at E10.5
(A) Confocal Z-projection of the dorsal aorta (DA) and somitic region of an E10.5 mouse immunostained for CD31 (i), Runx1 (i,ii) and Kit (i,iii). Arrowheads point to hematopoietic clusters in the dorsal longitudinal anastomotic vessels (DLAV) and intersomitic vessels (ISV). Scale bar = 500µm (B) Magnified view of the hematopoietic cluster within the DLAV shown in (A).

References

    1. Bertrand JY, Chi NC, Santoso B, Teng S, Stainier DY, Traver D. Haematopoietic stem cells derive directly from aortic endothelium during development. Nature. 2010;464:108–111. - PMC - PubMed
    1. Bertrand JY, Giroux S, Golub R, Klaine M, Jalil A, Boucontet L, Godin I, Cumano A. Characterization of purified intraembryonic hematopoietic stem cells as a tool to define their site of origin. Proc Natl Acad Sci U S A. 2005;102:134–139. - PMC - PubMed
    1. Biermann H, Pietz B, Dreier R, Schmid KW, Sorg C, Sunderkötter C. Murine leukocytes with ring-shaped nuclei include granulocytes, monocytes, and their precursors. J Leukoc Biol. 1999;65:217–231. - PubMed
    1. Bigas A, Guiu J, Gama-Norton L. Notch and Wnt signaling in the emergence of hematopoietic stem cells. Blood Cells Mol Dis. 2013;51:264–270. - PubMed
    1. Boisset JC, van Cappellen W, Andrieu-Soler C, Galjart N, Dzierzak E, Robin C. In vivo imaging of haematopoietic cells emerging from the mouse aortic endothelium. Nature. 2010;464:116–120. - PubMed

Publication types