. 2016 Jul 7;12(7):e1005004.
doi: 10.1371/journal.pcbi.1005004. eCollection 2016 Jul.

Properties of Neurons in External Globus Pallidus Can Support Optimal Action Selection

Affiliations

Properties of Neurons in External Globus Pallidus Can Support Optimal Action Selection

Rafal Bogacz et al. PLoS Comput Biol. .

Abstract

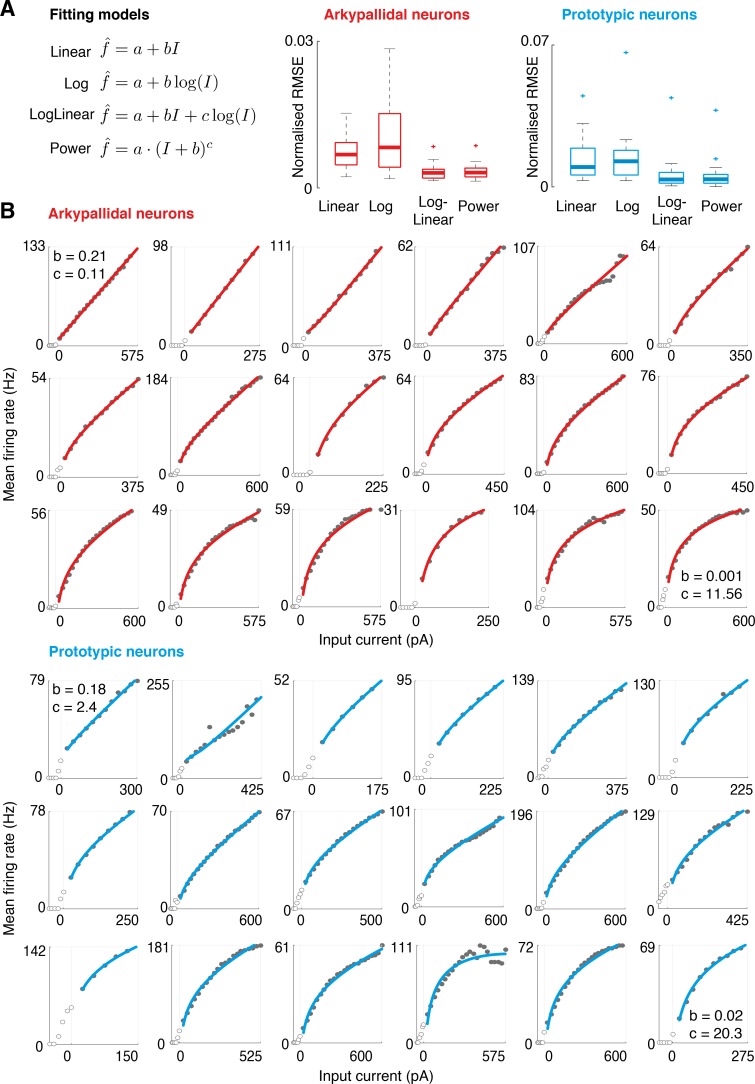
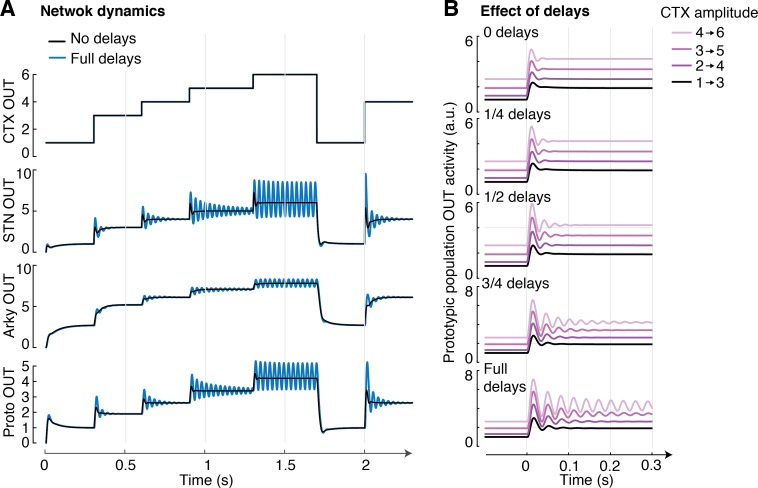
The external globus pallidus (GPe) is a key nucleus within basal ganglia circuits that are thought to be involved in action selection. A class of computational models assumes that, during action selection, the basal ganglia compute for all actions available in a given context the probabilities that they should be selected. These models suggest that a network of GPe and subthalamic nucleus (STN) neurons computes the normalization term in Bayes' equation. In order to perform such computation, the GPe needs to send feedback to the STN equal to a particular function of the activity of STN neurons. However, the complex form of this function makes it unlikely that individual GPe neurons, or even a single GPe cell type, could compute it. Here, we demonstrate how this function could be computed within a network containing two types of GABAergic GPe projection neuron, so-called 'prototypic' and 'arkypallidal' neurons, that have different response properties in vivo and distinct connections. We compare our model predictions with the experimentally-reported connectivity and input-output functions (f-I curves) of the two populations of GPe neurons. We show that, together, these dichotomous cell types fulfil the requirements necessary to compute the function needed for optimal action selection. We conclude that, by virtue of their distinct response properties and connectivities, a network of arkypallidal and prototypic GPe neurons comprises a neural substrate capable of supporting the computation of the posterior probabilities of actions.


Conflict of interest statement

The authors have declared that no competing interests exist.

Figures

Fig 1
Fig 1. Mapping of Bayes’ theorem onto a subset of the cortico-basal-ganglia-thalamic circuits.
Black and grey circles denote neural populations selective for two sample actions (A1 or A2), and the labels next to the circles indicate their anatomical correlates. Arrows denote excitatory (glutamatergic) connections, while lines ended with circles denote inhibitory (GABAergic) connections. The following abbreviations have been used: ctx.–cortex, STN–subthalamic nucleus, GPe–external globus pallidus, Output–output nuclei of the basal ganglia, i.e. internal globus pallidus and substantia nigra pars reticulata.
Fig 2
Fig 2. Computation of function STN–log STN in a microcircuit containing two distinct populations of GPe neurons.
(A) Decomposition of function STN–log STN (shown in black) into a difference between a Prototypic function (P, shown in blue) and Adjustment (A, corresponding to red striped area). (B) A hypothetical neural circuit computing STN–log STN. Rectangles denote neural populations, arrows denote excitatory connections, while lines ended with circles denote inhibitory connections. P denotes the neural population with f-I curve corresponding to function P from the left panel. Activity of neurons P is adjusted by inhibition from population denoted by A with f-I curve corresponding to the red area from the left panel. (C) Experimentally-derived connectivity between major cell types in STN-GPe circuit. PRO, prototypic GPe neurons; ARK, arkypallidal neurons.
Fig 3
Fig 3. Autonomous firing and driven responses of molecularly-identified GPe neurons.
(A) After recording, all neurons were labelled with biocytin, recovered and tested for expression of parvalbumin (PV) and forkhead box protein 2 (FoxP2). Prototypic GPe neurons (left) expressed PV but not FoxP2, whereas arkypallidal neurons (right) expressed FoxP2 but not PV. Scale bars = 20 μm. (B) Typical examples of the autonomous firing of a prototypic neuron (left) and an arkypallidal neuron (right). (C) Typical examples of the driven activity of a prototypic neuron (left) and arkypallidal neuron (right). Same neurons as shown in A and B. (D) Average f-I curves of prototypic and arkypallidal neurons recorded in vitro. The error bars show the standard error of the mean.
Fig 4
Fig 4. Linearity and non-linearity of f-I curves of GPe neurons.
(A) Comparison of quality of fits of f-I curves of arkypallidal or prototypic neurons to 4 different functions (linear, logarithmic, a combination of logarithmic and linear, or a power function). The fits were assessed by root mean squared error (RMSE). Note that the best fits (lowest RMSE values) arose from using the combination of logarithmic and linear as well as from the power function. Plots indicate medians plus IQRs for all neurons of each type. (B) Individual fits for all f-I curves recorded in arkypallidal (n = 18) and prototypic (n = 18) neurons. Traces are sorted from most linear (top left) to logarithmic (bottom right) for each population. Only positive responses are considered, since log x is undefined for x≤0. In the displays showing the most linear and the most logarithmic neurons, the values of coefficients in fitted function f = a + bI + clogI are printed. The logarithmic coefficient c has relatively high values even for the most linear neurons, because function logI has much smaller range for a given input than the linear function I.
Fig 5
Fig 5. The connections between prototypic neurons linearize their response profiles.
(A) A schematic diagram illustrating how mutual inhibition linearizes the response profile (see main text). (B) A model of a population of prototypic neurons, PRO, receiving excitatory input (I) and mutual inhibition (average weight wPP). (C) The resulting response profiles for different levels of inhibition within the population (when wPP = 0, there is no mutual inhibition). Note the linearization of the population response with increasing mutual inhibition.
Fig 6
Fig 6. Computational model of STN-GPe network.
(A) Architecture of the model including all 18 prototypic and arkypallidal neurons recorded experimentally, and connections within GPe and with STN. wiXY denotes the strength of connections between population X and Y. Sub-indices indicate the individual neuron associated with each weight. Inner GPe weights linking arkypallidal and prototypic neurons are assumed identical for all connections, hence represented by a single value. (B) Illustrative examples of inhibition sent from GPe to STN i.e. i=118wiPSPROi(t)/αSfor different optimal weights (dashed yellow and green), and comparison with the desired function STN–log STN throughout the input range considered ([0.7–6]). Middle plot shows two sets of weight parameters corresponding to the top display, and the bottom display shows the range of weight parameters found in 100 runs. Weights for each population are organised from the most linear neuron’s to the most logarithmic neuron’s (left to right), highlighting the lack of preferential connections to linear or logarithmic neurons.
Fig 7
Fig 7. Dynamical behaviour of STN-GPe network.
(A) Output responses of STN, Arkypallidal and Prototypic populations for a sequence of cortical (CTX) input steps ranging from 1 to 6 (a.u.). The output from arkypallidal neurons is taken as wAP<ARKi(t)>i, while the output from prototypic neurons was taken as i=118wiPSPROi(t)/αS. Black and blue traces correspond to the behaviour of the system without and with delays respectively. (B) Evaluation of the effect of delays in the system in response to varying cortical input. As delays increase (and delay values approach those reported in literature), the cortical input for which the system becomes unstable decreases.
Fig 8
Fig 8. Connectivity between GPe and striatum.
Rectangles denote neural populations: D1 and D2 label striatal neurons with D1 and D2 receptors, while PRO and ARK label prototypic and arkypallidal neurons respectively. Arrows and lines ending with circles denote excitatory and inhibitory connections respectively. Black and coloured parts of the circuit highlight the pathways illustrated in each panel. Purple pathways denote routes alternative to those shown in orange. The connections between striatum and GPe are dashed to indicate that it is not known which groups of neurons in striatum and GPe are interconnected–the figure shows only the hypothetical connections discussed in the main text. (A) Part of the indirect pathway connected with movement inhibition. (B) Routes providing evidence for actions to STN. (C) Routes providing normalization to the striatum.

References

    1. Redgrave P, Prescott TJ, Gurney K. The basal ganglia: a vertebrate solution to the selection problem? Neuroscience 1999; 89: 1009–1023. - PubMed
    1. Kita H. Globus pallidus external segment. Prog Brain Res 2007; 160: 111–133. - PubMed
    1. Smith Y, Bevan MD, Shink E, Bolam JP. Microcircuitry of the direct and indirect pathways of the basal ganglia. Neuroscience 1998; 86: 353–387. - PubMed
    1. Frank MJ, Seeberger LC, O'Reilly R C. By carrot or by stick: cognitive reinforcement learning in parkinsonism. Science 2004; 306: 1940–1943. - PubMed
    1. Gurney K, Prescott TJ, Redgrave P. A computational model of action selection in the basal ganglia. I. A new functional anatomy. Biol Cybern 2001; 84: 401–410. - PubMed

Publication types

LinkOut - more resources