. 2016 Oct;59(10):2156-65.
doi: 10.1007/s00125-016-4033-1. Epub 2016 Jul 7.

Transcriptomic profiling of pancreatic alpha, beta and delta cell populations identifies delta cells as a principal target for ghrelin in mouse islets

Affiliations

Transcriptomic profiling of pancreatic alpha, beta and delta cell populations identifies delta cells as a principal target for ghrelin in mouse islets

Alice E Adriaenssens et al. Diabetologia. 2016 Oct.

Abstract

Aims/hypothesis: Intra-islet and gut-islet crosstalk are critical in orchestrating basal and postprandial metabolism. The aim of this study was to identify regulatory proteins and receptors underlying somatostatin secretion though the use of transcriptomic comparison of purified murine alpha, beta and delta cells.

Methods: Sst-Cre mice crossed with fluorescent reporters were used to identify delta cells, while Glu-Venus (with Venus reported under the control of the Glu [also known as Gcg] promoter) mice were used to identify alpha and beta cells. Alpha, beta and delta cells were purified using flow cytometry and analysed by RNA sequencing. The role of the ghrelin receptor was validated by imaging delta cell calcium concentrations using islets with delta cell restricted expression of the calcium reporter GCaMP3, and in perfused mouse pancreases.

Results: A database was constructed of all genes expressed in alpha, beta and delta cells. The gene encoding the ghrelin receptor, Ghsr, was highlighted as being highly expressed and enriched in delta cells. Activation of the ghrelin receptor raised cytosolic calcium levels in primary pancreatic delta cells and enhanced somatostatin secretion in perfused pancreases, correlating with a decrease in insulin and glucagon release. The inhibition of insulin secretion by ghrelin was prevented by somatostatin receptor antagonism.

Conclusions/interpretation: Our transcriptomic database of genes expressed in the principal islet cell populations will facilitate rational drug design to target specific islet cell types. The present study indicates that ghrelin acts specifically on delta cells within pancreatic islets to elicit somatostatin secretion, which in turn inhibits insulin and glucagon release. This highlights a potential role for ghrelin in the control of glucose metabolism.

Keywords: Alpha cells; Beta cells; Delta cells; Ghrelin; Glucagon; Insulin; RNA sequencing; Somatostatin.


Conflict of interest statement

Funding This work was supported by the European Foundation for the Study of Diabetes and Boehringer Ingelheim Basic Research Programme; the Wellcome Trust (grants 106262/Z/14/Z, 106263/Z/14/Z and 100574/Z/12/Z); the Medical Research Council Metabolic Diseases Unit (grants MRC_MC_UU_12012/3 and MRC_MC_UU_12012/5); and the Novo Nordisk Foundation. Duality of interest statement The authors declare that there is no duality of interest associated with this manuscript. Access to research materials All transgenic animal models used can be requested from the corresponding authors subject to material transfer agreement negotiation. The RNA-sequencing data have been deposited at NCBI Gene Expression Omnibus AccNo: GSE76017. Contribution statement AEA designed and performed experiments, prepared figures and wrote the manuscript. BS designed and performed experiments, helped to prepare figures and revised the manuscript. BYHL performed analysis, helped to prepare figures and revised the manuscript. GSHY and JJH contributed to the design and analysis of experiments and revised the manuscript. FR and FMG conceived and designed the project, analysed the data and revised the manuscript. All authors approved the final manuscript. FMG and FR are jointly responsible for the integrity of the work as a whole.

Figures
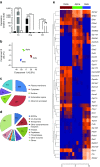
Fig. 1
Fig. 1
Transcriptomic profiling of pancreatic alpha, beta and delta cells. RNA was extracted from purified populations of alpha, beta and delta cells, and converted to cDNA or prepped for RNA sequencing. (a) Populations of alpha (black bars), beta (grey bars) and delta (white bars) cells were checked for Ins, Gcg and Sst enrichment, respectively, using qPCR analysis. Data are presented as the geometric mean, with error bars (SEM) calculated from log2 data. Each column represents the average expression from three separate samples. Significance comparisons were calculated by one-way ANOVA with Bonferroni post hoc comparison; ***p < 0.001. (b) RNA from five alpha cell samples, four beta cell samples and six delta cell samples was sequenced using SE50 sequencing. Differential gene expression was determined using edgeR, and a principle component analysis plot was constructed using a false discovery rate of 5% and a sensitivity threshold of FPKM values >1. (c) Pie chart showing the cellular distribution of genes differentially expressed between islet cell types. (d) Pie chart showing the distribution of differentially expressed genes found at the plasma membrane. (e) Heatmap showing the top 40 most differentially expressed genes found at the plasma membrane. Data are presented as log2 FPKM
Fig. 2
Fig. 2
Confirmation of Ghsr expression and GHSR activity in delta cells. (ac) Log2 of FPKM values for GPCRs expressed by each cell type were plotted against each other: (a) alpha vs beta cells; (b) alpha vs delta cells; and (c) beta vs delta cells. A threshold of twofold differential expression was set. Three of the most highly enriched and expressed GPCRs for each cell type are indicated on the graphs. (d, e) Histograms showing the relative expression of Ghsr in pancreatic alpha, beta and delta cells (d) and Ghrl in the whole stomach, small intestine and islets (e). Expression was analysed by qPCR and compared with that of Actb in the same sample. Data are presented as the geometric mean, with error bars (SEM) calculated from log2 data. Each column represents the average expression from three separate samples. Two to five mice were pooled for each sample in (d) and one mouse was used for each sample in (e). Significance comparisons were calculated by one-way ANOVA with Bonferroni post hoc comparison; *p < 0.05, ***p < 0.001. (f, g) Pancreatic islets from Sst-Cre/Rosa26 tdRFP/GCaMP3 mice were dispersed and cultured on glass-bottom dishes and imaged 24–48 h after plating. Delta cells were excited with 488/8 nm, and the GCaMP3 fluorescence (488 fluorescence units [FU]) was recorded. Cells were perfused with either 100 nmol/l hexarelin or 30 mmol/l KCl, as indicated. Representative responses of two delta cells monitored in parallel in the same dish are shown in black and grey (f). Mean changes in GCaMP3 in cells from seven mice are shown in a histogram (g), with the number of responding cells out of the total number of cells imaged for each condition shown above each bar. Data represent the mean ± SEM of the number of responding cells. Significance above baseline was calculated using a single Student’s t test; ***p < 0.001. (h) A whole pancreas was perfused with 3.5 mmol/l glucose and treated with 10 nmol/l ghrelin and 10 mmol/l arginine, as indicated, and SST concentrations were measured every minute
Fig. 3
Fig. 3
Ghrelin stimulated SST release, while decreasing insulin and glucagon release, in a perfused pancreas model. Whole pancreases were perfused with 12 mmol/l glucose (control) and treated with 1 or 100 nmol/l ghrelin, and the secretion of SST (a, b), insulin (c, d) and glucagon (e, f) was measured. Mean hormone outputs were averaged over 5 min before addition of the test substance and during the final 5 min of test substance perfusion. Data are represented as means ± SEM. Significance was tested by one-way ANOVA with post hoc Tukey modification; n = 7; *p < 0.05, ***p < 0.001
Fig. 4
Fig. 4
The effects of ghrelin on SST, insulin and glucagon were sensitive to SSTR. (a) Expression levels of Sstr in alpha (black bars), beta (grey bars) and delta (white bars) cells, as determined by RNA sequencing, were plotted and their expression was confirmed by qPCR (b). Data are presented as the geometric mean, with error bars (SEM) calculated from log2 data. Each column represents the average expression from three separate samples. Two to six mice were pooled for each sample in (a) and one mouse was used for each sample in (b). Significance comparisons were calculated by one-way ANOVA with Bonferroni post hoc comparison; *p < 0.05, **p < 0.01, ***p < 0.001. (c, d) Whole perfused pancreases were perfused with 12 mmol/l glucose (basal) and treated with 10 nmol/l ghrelin in the presence and absence of the SSTR inhibitors H6056 and H5884 (SSTR ant), and the secretion of SST (c, d), insulin (e, f) and glucagon (g, h) was measured; 10 mmol/l arginine (Arg) was used as a positive control. Mean hormone outputs were averaged over 5 min before addition of the test substance and during the final 5 min of test substance perfusion. Data are represented as means ± SEM. Significance was tested by one-way ANOVA and paired Student’s t test; n = 8; **p < 0.01, ***p < 0.001

References

    1. Lin HV, Accili D. Hormonal regulation of hepatic glucose production in health and disease. Cell Metab. 2011;14:9–19. doi: 10.1016/j.cmet.2011.06.003. - DOI - PMC - PubMed
    1. Unger RH, Cherrington AD. Glucagonocentric restructuring of diabetes: a pathophysiologic and therapeutic makeover. J Clin Invest. 2012;122:4–12. doi: 10.1172/JCI60016. - DOI - PMC - PubMed
    1. Caicedo A. Paracrine and autocrine interactions in the human islet: more than meets the eye. Semin Cell Dev Biol. 2013;24:11–21. doi: 10.1016/j.semcdb.2012.09.007. - DOI - PMC - PubMed
    1. Schuit FC, Derde MP, Pipeleers DG. Sensitivity of rat pancreatic A and B cells to somatostatin. Diabetologia. 1989;32:207–212. doi: 10.1007/BF00265096. - DOI - PubMed
    1. Hauge-Evans AC, King AJ, Carmignac D, et al. Somatostatin secreted by islet delta-cells fulfills multiple roles as a paracrine regulator of islet function. Diabetes. 2009;58:403–411. doi: 10.2337/db08-0792. - DOI - PMC - PubMed

Publication types

MeSH terms