. 2016 Dec;40(8):678-688.
doi: 10.1002/gepi.21989. Epub 2016 Jul 7.

A perspective on interaction effects in genetic association studies

Affiliations

A perspective on interaction effects in genetic association studies

Hugues Aschard. Genet Epidemiol. 2016 Dec.

Abstract

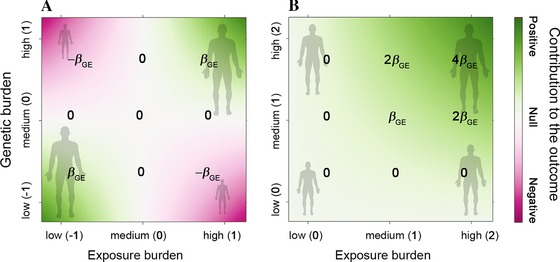
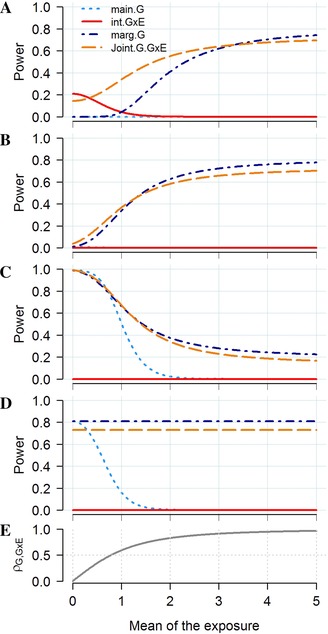
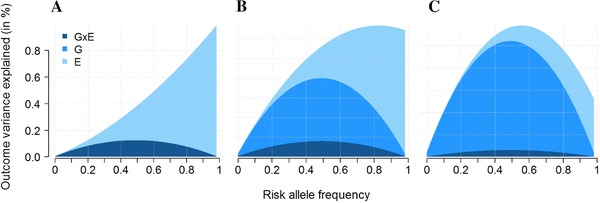
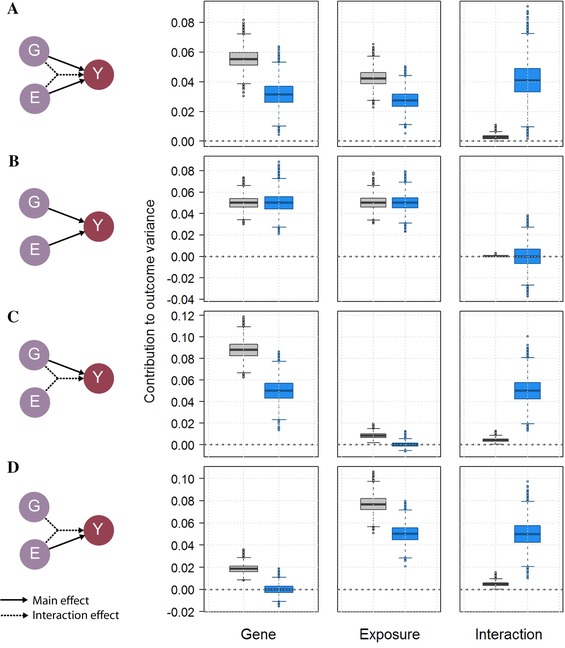
The identification of gene-gene and gene-environment interaction in human traits and diseases is an active area of research that generates high expectation, and most often lead to high disappointment. This is partly explained by a misunderstanding of the inherent characteristics of standard regression-based interaction analyses. Here, I revisit and untangle major theoretical aspects of interaction tests in the special case of linear regression; in particular, I discuss variables coding scheme, interpretation of effect estimate, statistical power, and estimation of variance explained in regard of various hypothetical interaction patterns. Linking this components it appears first that the simplest biological interaction models-in which the magnitude of a genetic effect depends on a common exposure-are among the most difficult to identify. Second, I highlight the demerit of the current strategy to evaluate the contribution of interaction effects to the variance of quantitative outcomes and argue for the use of new approaches to overcome this issue. Finally, I explore the advantages and limitations of multivariate interaction models, when testing for interaction between multiple SNPs and/or multiple exposures, over univariate approaches. Together, these new insights can be leveraged for future method development and to improve our understanding of the genetic architecture of multifactorial traits.

Keywords: GWAS; genetic risk score; interaction; joint test; multivariate analysis; power; pratt index; statistical method; variance explained.


Figures

Figure 1
Figure 1
Example of a gene by exposure interaction effect on height. Pattern of contribution of a hypothetical genetic‐by‐exposure interaction term to human height when shifting the location of the genetic and the exposure burdens in the generative model. Genetic burden can correspond to the number of coded allele for a given SNP and exposure burden can correspond to the measure of an environmental exposure. Examples of simple coding are defined in parenthesis on both axes, and the resulting contributions to each specific combination of genetic and environmental values are defined on each panel for a given interaction effect parameter βGE. In (A) the interaction is defined as the product of a centered genetic variant and a centered exposure. Such encoded interaction induces positive contribution to the outcome for the two extreme groups: (i) maximum exposure burden and maximum genetic burden, and (ii) lowest exposure burden and lowest genetic burden; and negative contribution to the outcome for the two opposite groups: (iii) maximum exposure burden and lowest genetic burden, and (iv) lowest exposure burden and maximum genetic burden. In (B) genetic and exposure burdens are encode in their natural scale and are therefore positive or null. Such coding induces a contribution of the interaction effect to the outcome that is monotonic with increasing genetic and exposure burden.
Figure 2
Figure 2
Relative power of the joint test of main genetic and interaction effects. Power comparison for the tests of the main genetic effect (main.G), the interaction effect (int.GxE), and the joint effect (Joint G.GxE) from the interaction model, and the test of the marginal genetic effect (mar.G). The outcome Y is define as a function of a genetic variant G coded as [0,1,2] with a minor allele frequency of 0.3, and the interaction of G with an exposure E normally distributed with variance 1 and mean E¯. The genetic and interaction effects vary so that they explain 0% and 0.04% (A), 0.1% and 0.1% (B), 0.6% and 0.1% (C) with effect in opposite direction, and 0.4% and 0% (D) of the variance of Y, respectively. Power and ρG,G×E, the correlation between G and the G×E interaction term (E) were plotted for a sample size of 10,000 individuals and increasing E¯ from 0 to 5.
Figure 3
Figure 3
Examples of attribution of phenotypic variance explained by an interaction effect. Proportion of variance of an outcome Y explained by a genetic variant G, an exposure E and their interaction G × E in a model harboring a pure interaction effect only (Y=βGE×G×E+ε). The exposure E follows a normal distribution with a standard deviation of 1 and mean of 0 (A), 2 (B), and 4 (C). The genetic variant is biallelic with a risk allele frequency increasing from 0.01 to 0.99. The interaction effect is set so that the maximum of the variance explained by the model equals 1%.
Figure 4
Figure 4
Relative importance of an interaction term as defined by the Pratt index. Contribution of a genetic variant G with minor allele frequency of 0.5, a normally distributed exposure E with mean of 4 and variance of 1 and their interaction G × E, to the variance of a normally distributed outcome Y, based on the standard approach‐–the marginal contribution of E and G and the increase in r 2 when adding the interaction term–(gray boxes), and based on the Pratt index (blue boxes), across 10,000 replicates of 5,000 subjects. For illustration purposes the predictors explain jointly 10% of the variance of Y. In scenario (A) all G, E, and G × E have equal contribution, while in scenarios (B), (C), and (D) there is no interaction effect, no exposure effect, and no genetic effect, respectively.
Figure 5
Figure 5
Advantages and limitations of testing interaction effect with a genetic risk score. Examples of power comparison for the combined analysis of interaction effects between 20 SNPs and a single exposure. Power was derived for three scenarios: the interaction effects are normally distributed (upper panels) and (A) centered, (B) slightly positive so that 25% of the interactions are negative, and (C) positive only. Three tests are compared while increasing sample size from 0 to 10,000: the joint test of all interaction terms, the genetic risk score by exposure interaction test, and the test of the strongest interaction effect (pairwise test) after correction for the 20 tests performed (middle panels). The lower panels show power of the three tests for a sample size of 5,000, when including 1–400 non‐interacting SNPs on top of the 20 causal SNPs in the analysis and after accounting for multiple testing in the pairwise test.

References

    1. Ahmad, S. , Rukh, G. , Varga, T. V. , Ali, A. , Kurbasic, A. , Shungin, D. , … Franks, P. W. (2013). Gene x physical activity interactions in obesity: combined analysis of 111,421 individuals of European ancestry. PLoS Genetics, 9(7), e1003607. - PMC - PubMed
    1. Aiken, L. S. , West, S. G. , & Reno, R. R. (1991). Multiple Regression: testing and interpreting interactions. Newbury Park, CA: Sage.
    1. Andersen, P. K. , & Skovgaard, L. T. (2010). Regression with linear predictors. 5. Multiple regression, the linear predictor. New York: Springer‐Verlag.
    1. Aschard, H. , Hancock, D. B. , London, S. J. , & Kraft, P. (2010). Genome‐wide meta‐analysis of joint tests for genetic and gene‐environment interaction effects. Human Heredity, 70(4), 292–300. - PMC - PubMed
    1. Aschard, H. , Chen, J. , Cornelis, M. C. , Chibnik, L. B. , Karlson, E. W. , & Kraft, P. (2012a). Inclusion of gene‐gene and gene‐environment interactions unlikely to dramatically improve risk prediction for complex diseases. American Journal of Human Genetics, 90(6), 962–972. - PMC - PubMed

LinkOut - more resources