

SLC25A46 is required for mitochondrial lipid homeostasis and cristae maintenance and is responsible for Leigh syndrome
- PMID: 27390132
- PMCID: PMC5009808
- DOI: 10.15252/emmm.201506159
SLC25A46 is required for mitochondrial lipid homeostasis and cristae maintenance and is responsible for Leigh syndrome
Abstract
Mitochondria form a dynamic network that responds to physiological signals and metabolic stresses by altering the balance between fusion and fission. Mitochondrial fusion is orchestrated by conserved GTPases MFN1/2 and OPA1, a process coordinated in yeast by Ugo1, a mitochondrial metabolite carrier family protein. We uncovered a homozygous missense mutation in SLC25A46, the mammalian orthologue of Ugo1, in a subject with Leigh syndrome. SLC25A46 is an integral outer membrane protein that interacts with MFN2, OPA1, and the mitochondrial contact site and cristae organizing system (MICOS) complex. The subject mutation destabilizes the protein, leading to mitochondrial hyperfusion, alterations in endoplasmic reticulum (ER) morphology, impaired cellular respiration, and premature cellular senescence. The MICOS complex is disrupted in subject fibroblasts, resulting in strikingly abnormal mitochondrial architecture, with markedly shortened cristae. SLC25A46 also interacts with the ER membrane protein complex EMC, and phospholipid composition is altered in subject mitochondria. These results show that SLC25A46 plays a role in a mitochondrial/ER pathway that facilitates lipid transfer, and link altered mitochondrial dynamics to early-onset neurodegenerative disease and cell fate decisions.
Keywords: Leigh syndrome; SLC25A46; mitochondrial architecture; phospholipid transfer.
© 2016 The Authors. Published under the terms of the CC BY 4.0 license.
Figures
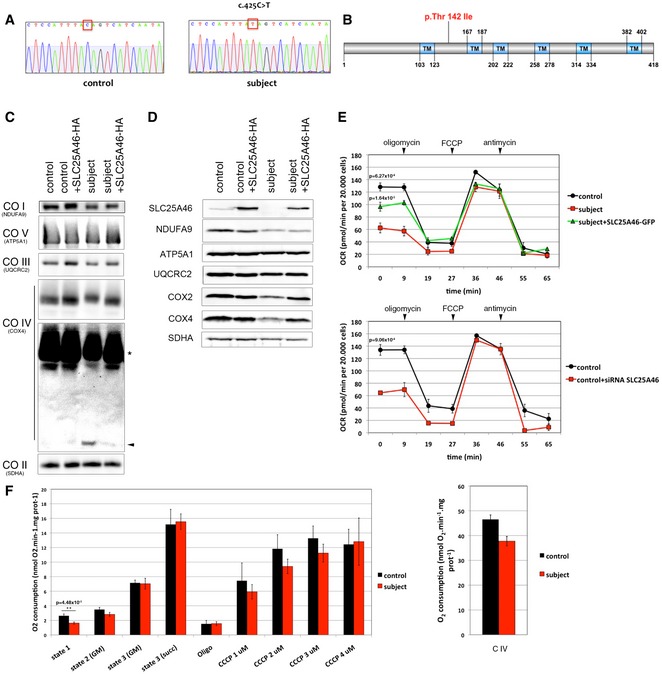
DNA sequence analysis of SLC25A46 cDNA showing a homozygous c.425C > T mutation in the subject fibroblasts compared to the control.
Schematic representation of SLC25A46 protein and position of the mutated p.Thr142Ile amino acid.
BN‐PAGE analyses of OXPHOS mitochondrial complexes in fibroblasts from control and subject, overexpressing an HA‐tagged version of wild‐type SLC25A46. Each of the five OXPHOS complexes (I–V) was visualized with a subunit‐specific antibody that recognizes the native complex as follows: COI (NDUFA9), COII (SDHA), COIII (UQCRC1), COIV (COX4), COV (ATP5A1). Overexposure of the blot shows a defect in assembled complex IV (asterisk) and some free unassembled COX4 subunit in the subject (arrowhead). Complex II was used as a loading control.
Immunoblot analysis of the same samples as in (C) for expression of SLC25A46 and individual structural subunits of the five OXPHOS complexes. The 70 kDa subunit of complex II (SDHA) was used as a loading control.
Seahorse analysis of oxygen consumption rate in fibroblasts from control compared to subject fibroblasts with or without expression of an EGFP‐tagged version of wild‐type SLC25A46 (top panel) and in fibroblasts from control compared to those in which SLC25A46 is suppressed by a specific siRNA (bottom panel). n = 3, data represent mean ± SEM and P‐values were calculated using a t‐test.
Polarographic analysis of oxygen consumption in permeabilized fibroblasts from control and subject. Left panel: State 1: no exogenous substrates; state 2: addition of glutamate and malate (GM); state 3 (GM): addition of ADP; state 3 (Succ): addition of succinate; Oligo: inhibition of ATP synthase by oligomycin. Serial addition of 1–4 μM CCCP measuring maximal uncoupled respiration (control n = 4 vs. subject n = 5). Right panel: Complex IV‐driven O2 consumption was measured in the presence of antimycin A, TMPD and ascorbate (control n = 4 vs. subject n = 5). Data represent mean ± SEM and P‐values were calculated using a t‐test.
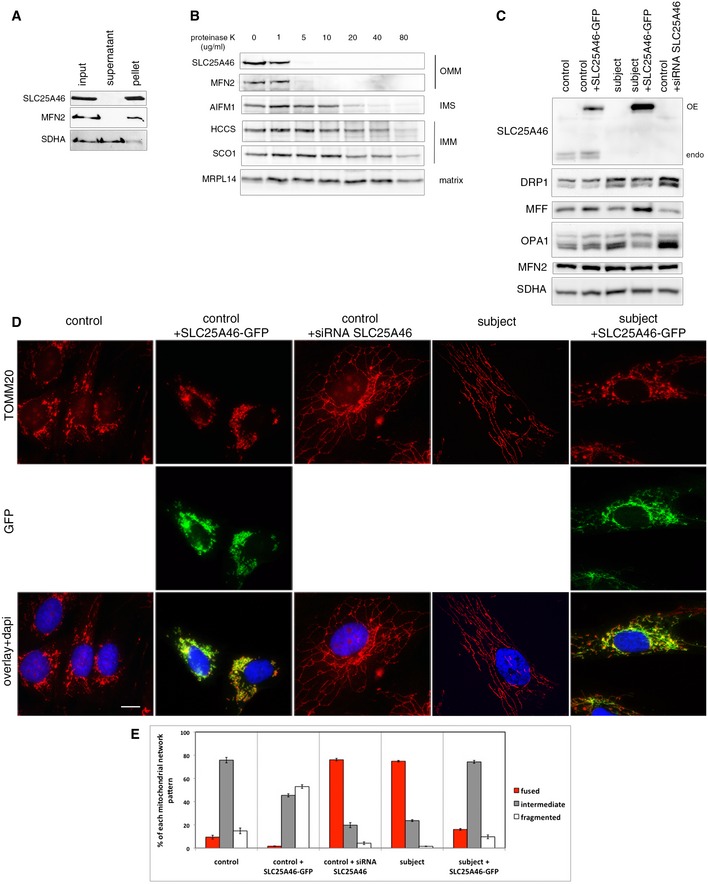
Alkaline carbonate extraction of mitochondria from control fibroblasts. Immunoblot analysis shows that SLC25A46 is an integral membrane protein. SDHA (soluble, membrane‐associated protein) and MFN2 (integral inner membrane protein) were used as controls.
Proteinase K digestion assay on mitochondria from control fibroblasts. Mitochondria were exposed to an increasing concentration of proteinase K to determine the submitochondrial localization of SLC25A46. SLC25A46 behaves as an outer membrane protein. MFN2 was used as a control for outer membrane protein, AIFM1 for protein present in the inter‐membrane space, HCCS and SCO1 for inner membrane proteins, and MRPL14 for matrix protein.
Immunoblot analysis of mitochondria from the same samples as in (D), for expression of SLC25A46 and known molecular components of the fusion/fission machinery. SDHA was used as a loading control.
Immunofluorescence analysis of the mitochondrial network. Control and subject fibroblasts, overexpressing an EGFP‐tagged version of the wild‐type SLC25A46 protein (green) and control fibroblasts treated with an siRNA against SLC25A46, were stained with the mitochondrial marker TOMM20 (red) and the nuclear marker DAPI (blue). Scale bars: 10 μm.
Quantification of the effect of SLC25A46 on the mitochondrial network shape. In each experimental condition described in (D), 150 cells were analyzed and the mitochondrial network organization was classified as intermediate, fused, or fragmented, in three independent experiments. Data represent mean ± SEM and P‐values were calculated using a t‐test: control vs. patient, P = 1.10 × 10⁻⁴; control vs. siRNA SLC25A46, P = 1.16 × 10⁻⁴; subject vs. subject + SLC25A46‐GFP, P = 2.06 × 10⁻⁵.
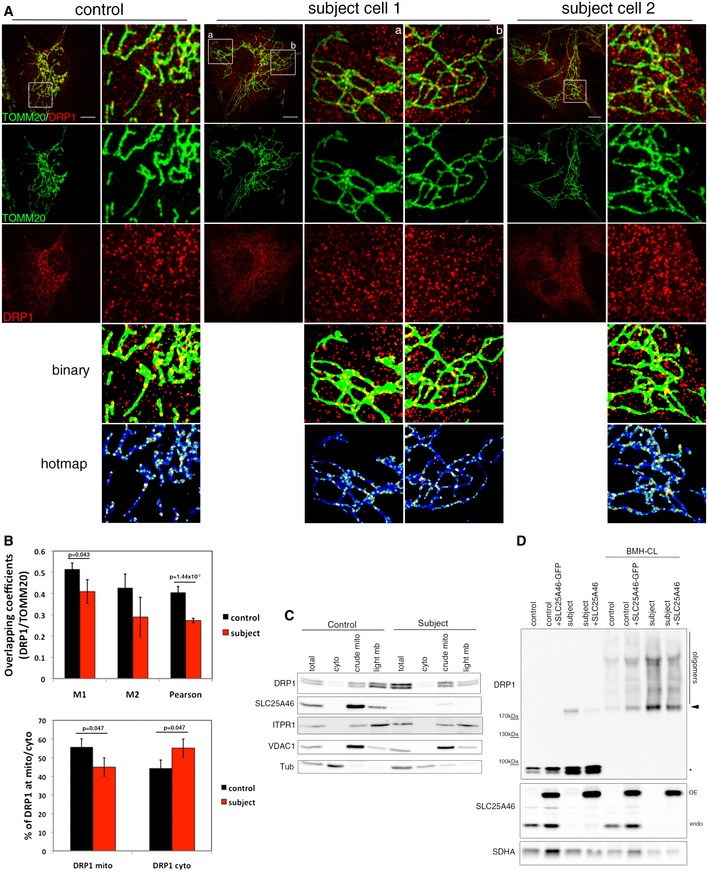
Immunofluorescence analysis of DRP1 localization in control and subject fibroblasts. Mitochondria were visualized with TOMM20 (green) and endogenous DRP1 in red. Binary indicates thresholded binarized images and the hot map shows thresholded and binarized images from DRP1 and mitochondria combined to create an image of mitochondrial DRP1. The mitochondrial DRP1 created image was then merged with the mitochondrial image. False colors show the accumulation of DRP1 at mitochondria. Scale bars: 10 μm.
Quantitation of the DRP1 localization by immunofluorescence analysis. Upper panel: Co‐localization of TOMM20 and DRP1 in control and subject fibroblasts was calculated by Mander's and Pearson's coefficients. Bottom panel: Quantification of DRP1 localization in the cytosol and the mitochondria. At least 15 cells per condition were analyzed in three independent experiments. Data represent mean ± SD and P‐values were calculated using a Student's t‐test.
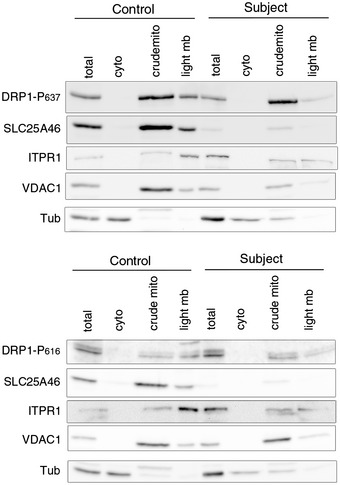
Analysis of DRP1 localization in control and subject fibroblasts by immunoblot analysis after cellular fractionation. ITPR1 was used as an ER marker, VDAC1 as a mitochondrial marker, and alpha‐tubulin as a cytosolic marker.
Immunoblot analysis of mitochondrial DRP1 oligomers in control and subject fibroblasts, overexpressing an EGFP‐tagged version of wild‐type SLC25A46. Crude mitochondria were treated or not with the BMH cross‐linker. SDHA was used as a loading control. Monomers (asterisk), dimers (arrowhead), and oligomers of DRP1 are indicated.
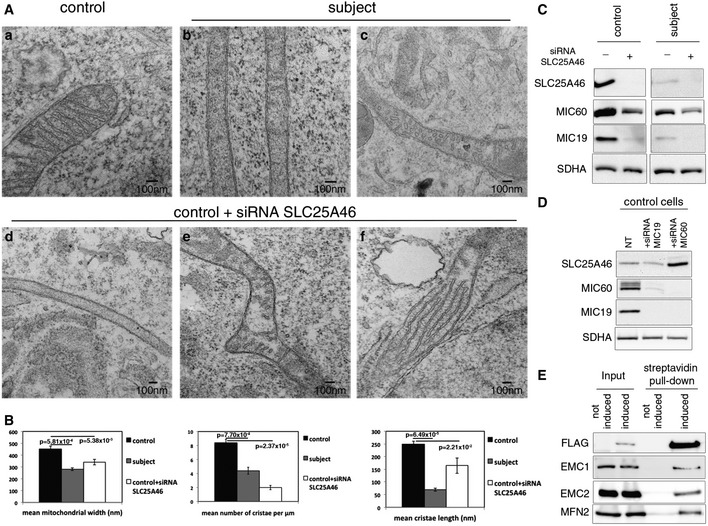
Analysis of the mitochondrial ultrastructure by transmission electron microscopy in control (a) and subject (b and c) fibroblasts and control fibroblasts treated with an siRNA against SLC25A46 (d–f).
Quantification of the effect of SLC25A46 on the mitochondrial ultrastructure organization. In each experimental condition, 30 cells were analyzed for mitochondrial width, the number of cristae per μm of mitochondrial length, and the length of cristae. Data represent mean ± SEM and P‐values were calculated using a t‐test.
Fibroblasts from control and subject, depleted of SLC25A46, were analyzed by immunoblot for expression of SLC25A46 and subunits of the MICOS complex. SDHA was used as a loading control.
Control fibroblasts, non‐transfected or knocked down for MIC60 and MIC19, were analyzed by immunoblot for expression of SLC25A46, MIC60, and MIC19. SDHA was used as a loading control.
Immunoblot analysis of the BioID assay with an N‐terminally FlagBirA*‐tagged SLC25A46 showing an interaction of SLC25A46 with EMC1, EMC2, and MFN2.
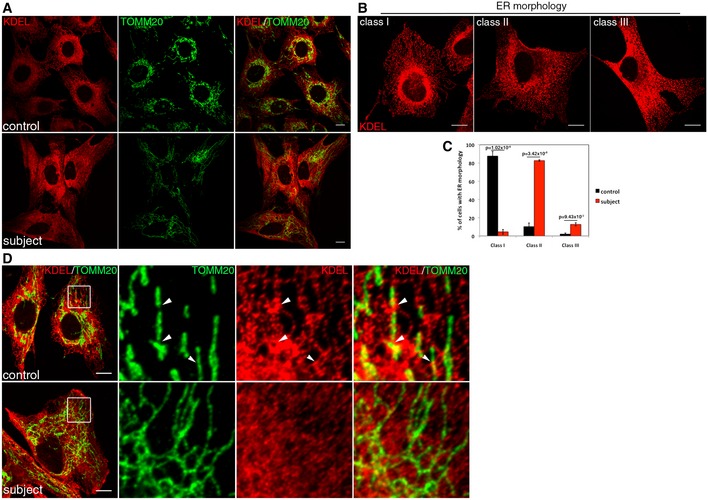
Immunofluorescence analysis of the endoplasmic reticulum (ER) network in control and subject fibroblasts. The ER was stained in red (KDEL), mitochondria in green (TOMM20). Scale bars: 20 μm.
The organization of the reticular ER network was classified as class I (normal), class II (mildly disorganized), or class III (highly disorganized). Scale bars: 10 μm.
Quantification of the control and subject ER network organization. In each condition, 30 cells were analyzed in three independent experiments. Data represent mean ± SD and P‐values were calculated using a t‐test.
Immunofluorescence analysis of contacts sites between ER and mitochondria in control and subject fibroblasts. ER was stained in red (KDEL), mitochondria in green (TOMM20). Contact sites are shown by arrowheads. Scale bars: 10 μm.
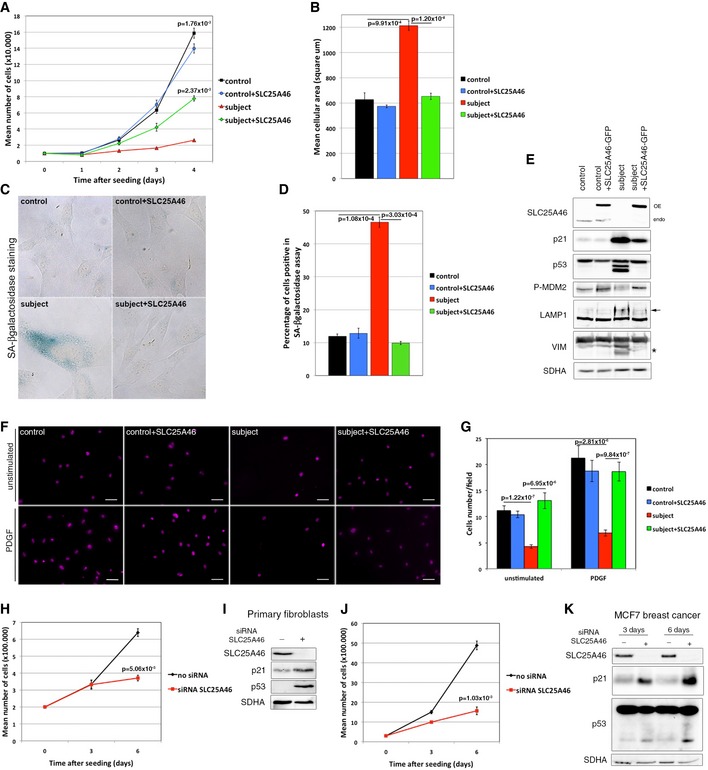
Analysis of the cell growth rate of control and subject fibroblasts, overexpressing or not an EGFP‐tagged version of the wild‐type SLC25A46. Experiments were done in independent triplicates. Data represent mean ± SEM and P‐values were calculated using t‐test.
Analysis of the cell area in control and subject fibroblasts, overexpressing or not an EGFP‐tagged version of the wild‐type SLC25A46. 30 cells were measured in each condition and experiments were repeated three times. Data represent mean ± SEM and P‐values were calculated using t‐test.
Analysis of the senescence‐associated β‐galactosidase (SA‐β‐gal) activity in control and subject fibroblasts, overexpressing or not an EGFP‐tagged version of the wild‐type SLC25A46. Hydrolysis of X‐gal results in the accumulation of a distinctive blue color in senescent cells.
Quantification of the senescence‐associated β‐galactosidase (SA‐β‐gal) activity in each of the experimental conditions described in (C). In each condition, 200 cells were analyzed. Percentage of positive blue cells corresponding to senescent cells was calculated. Experiments were done in independent triplicates. Data represent mean ± SEM and P‐values were calculated using a t‐test.
Immunoblot analysis from the same samples as in (A), for expression of SLC25A46, regulators of the cell cycle, and markers of senescence. SDHA was used as a loading control.
Analysis of cell migration capacity of control and subject fibroblasts, overexpressing or not an EGFP‐tagged version of the wild‐type SLC25A46, using a transwell assay as described in Materials and Methods. Cells that migrated through the membrane were identified under a microscope using DAPI staining. Scale Bars: 50 μm.
Quantification of cell migration capacity in each of the experimental conditions described in (F). In each condition, all cells present in a field were counted and five random fields were analyzed per condition. Experiments were done in independent triplicates. Data represent mean ± SD and P‐values were calculated using a Student's t‐test.
Analysis of the cell growth rate of primary control fibroblasts treated or not with an siRNA against SLC25A46 for 3 and 6 days. Experiments were done in independent triplicates. Data represent mean ± SEM and P‐values were calculated using t‐test.
Immunoblot analysis from the same samples as in (H), for expression of SLC25A46, regulators of the cell cycle, and markers of senescence. SDHA was used as a loading control.
Analysis of the cell growth rate of MCF7 breast cancer cells treated or not with an siRNA against SLC25A46 for 3 and 6 days. Experiments were done in independent triplicates. Data represent mean ± SEM and P‐values were calculated using a t‐test.
Immunoblot analysis from the same samples as in (J). SDHA was used as a loading control.
References
-
- Alexander C, Votruba M, Pesch UE, Thiselton DL, Mayer S, Moore A, Rodriguez M, Kellner U, Leo‐Kottler B, Auburger G et al (2000) OPA1, encoding a dynamin‐related GTPase, is mutated in autosomal dominant optic atrophy linked to chromosome 3q28. Nat Genet 26: 211–215 - PubMed
-
- Anton F, Fres JM, Schauss A, Pinson B, Praefcke GJ, Langer T, Escobar‐Henriques M (2011) Ugo1 and Mdm30 act sequentially during Fzo1‐mediated mitochondrial outer membrane fusion. J Cell Sci 124: 1126–1135 - PubMed
Publication types
MeSH terms
Substances
Grants and funding
LinkOut - more resources
Full Text Sources
Other Literature Sources
Molecular Biology Databases
Research Materials
