. 2016 Jun 22;3(3):ENEURO.0136-15.2016.
doi: 10.1523/ENEURO.0136-15.2016. eCollection 2016 May-Jun.

Cell-Type-Selective Effects of Intramembrane Cavitation as a Unifying Theoretical Framework for Ultrasonic Neuromodulation

Affiliations

Cell-Type-Selective Effects of Intramembrane Cavitation as a Unifying Theoretical Framework for Ultrasonic Neuromodulation

Michael Plaksin et al. eNeuro. .

Abstract

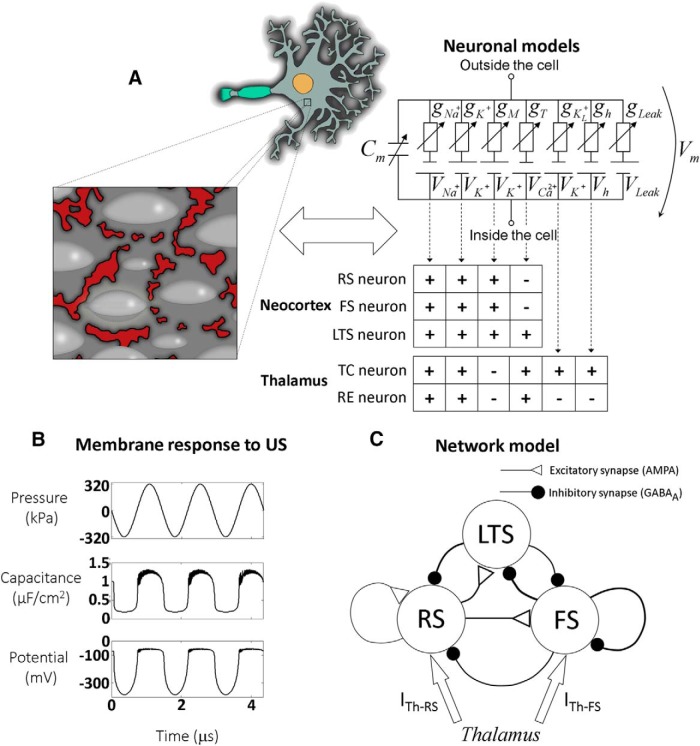
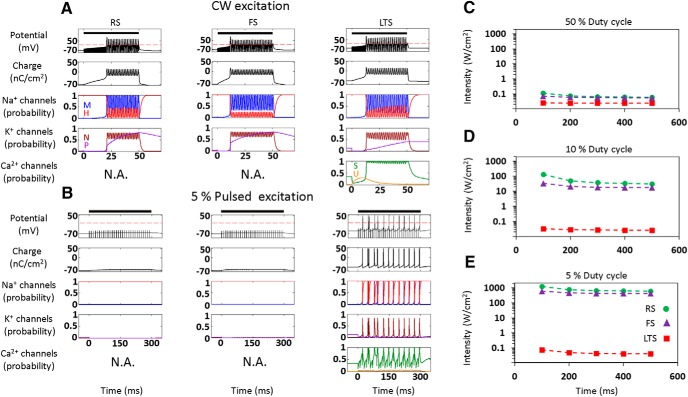
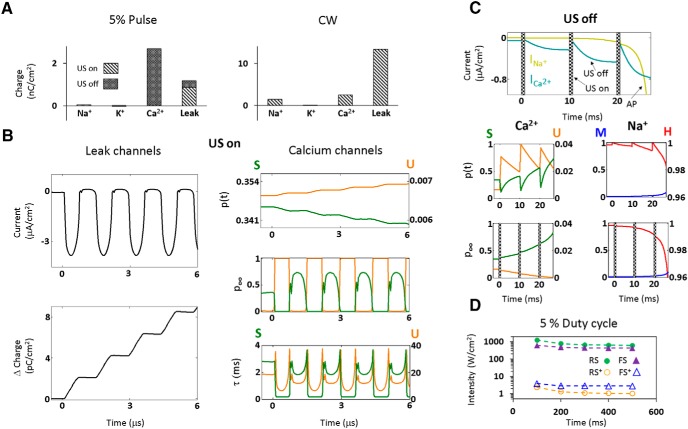
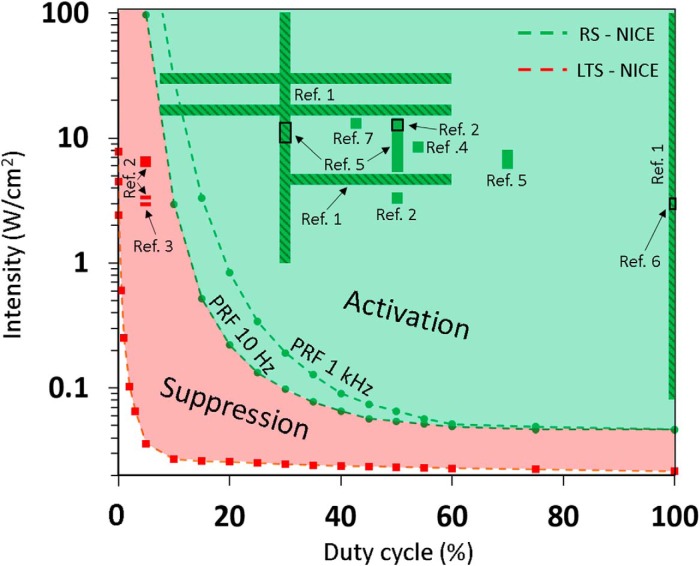
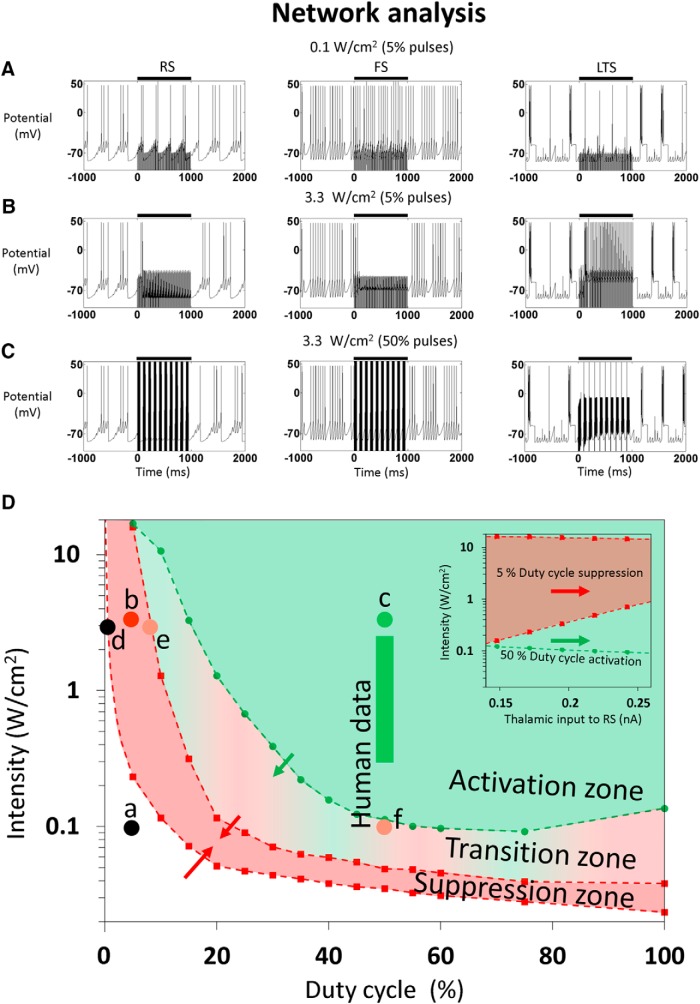
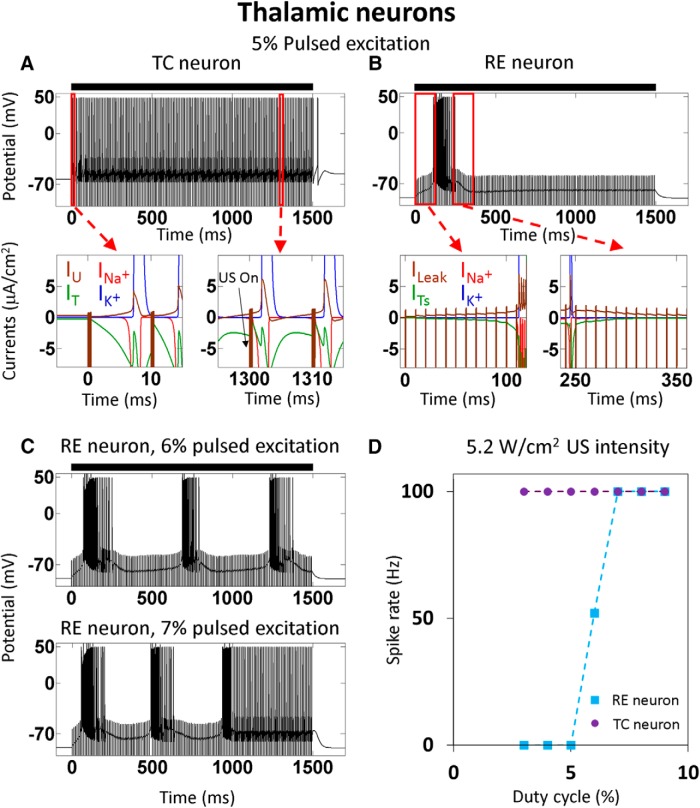
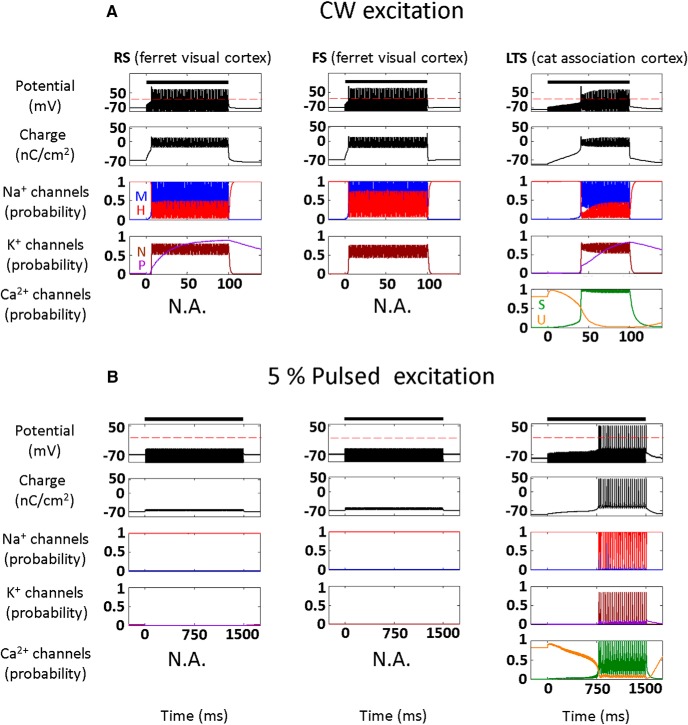
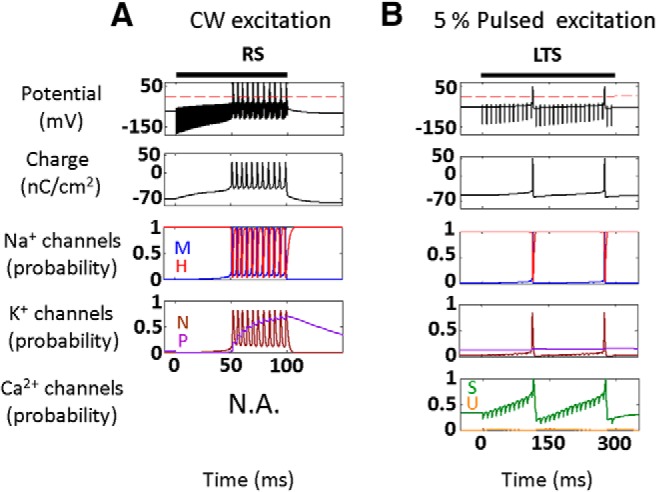
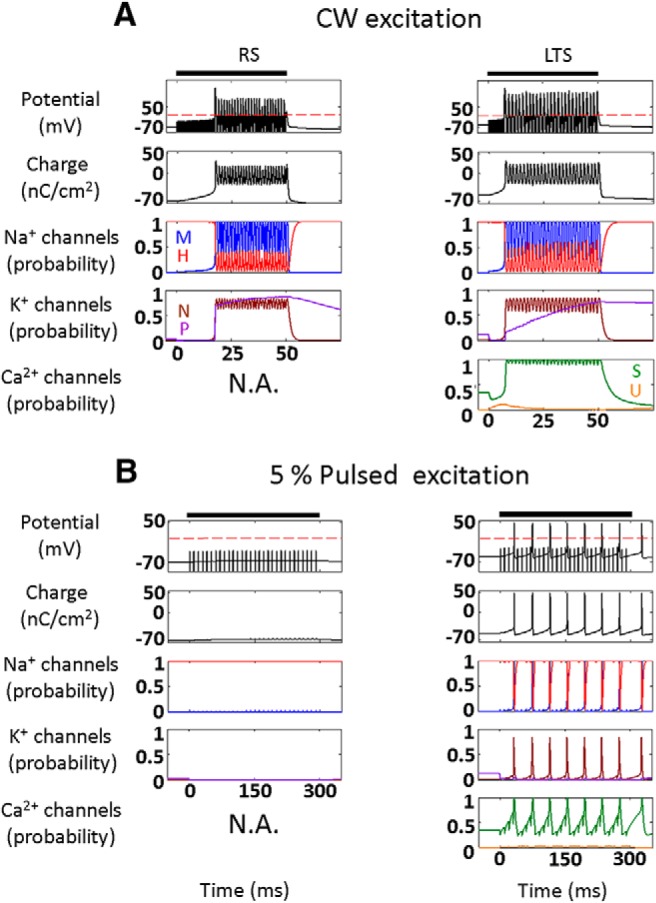
Diverse translational and research applications could benefit from the noninvasive ability to reversibly modulate (excite or suppress) CNS activity using ultrasound pulses, however, without clarifying the underlying mechanism, advanced design-based ultrasonic neuromodulation remains elusive. Recently, intramembrane cavitation within the bilayer membrane was proposed to underlie both the biomechanics and the biophysics of acoustic bio-effects, potentially explaining cortical stimulation results through a neuronal intramembrane cavitation excitation (NICE) model. Here, NICE theory is shown to provide a detailed predictive explanation for the ability of ultrasonic (US) pulses to also suppress neural circuits through cell-type-selective mechanisms: according to the predicted mechanism T-type calcium channels boost charge accumulation between short US pulses selectively in low threshold spiking interneurons, promoting net cortical network inhibition. The theoretical results fit and clarify a wide array of earlier empirical observations in both the cortex and thalamus regarding the dependence of ultrasonic neuromodulation outcomes (excitation-suppression) on stimulation and network parameters. These results further support a unifying hypothesis for ultrasonic neuromodulation, highlighting the potential of advanced waveform design for obtaining cell-type-selective network control.

Keywords: Hodgkin and Huxley; T-type calcium channels; action potential; model; neurons; ultrasound.


Conflict of interest statement

The authors report no conflict of interest.

Figures

Figure 1.
Figure 1.
Cortical and thalamic NICE models. A, Geometrical and biophysical representation structure of the NICE models: top view (left) of the US-induced dome-shaped BLS intermembrane cavities (light gray) in the plasma membrane bare zones (dark grey), bounded by cholesterol-rich protein islands (red areas). The equivalent electrical circuit of this biophysical complex structure (right) includes a potential (Vm), time-varying capacitance (Cm), and Hodgkin–Huxley type ionic conductances (gi) and sources (Vi). Each neuron type channels' composition is summarized in the neocortical and thalamic tables. B, Electrical dynamics during first three cycles of the model membrane exposed to US (f=0.69 MHz, 3.3 W/cm2): acoustic pressure (kPa), membrane capacitance (μF/cm2), and membrane potential (mV). C, A simplified network of RS, FS, and LTS cortical neurons. The filled black circles and open triangles are GABAA and AMPA- type synapses, respectively. The excitatory connections to the two FS and LTS inhibitory neurons are depressing and facilitating, respectively. The synaptic strength is represented by changes of the lines' thickness (logarithmically scaled) and ITh-RS and ITh-FS are the thalamic inputs.
Figure 2.
Figure 2.
Effect of continuous and pulsed US stimuli on the different cortical NICE-neurons (f=0.69 MHz). A, B, Effect of US stimulus (3.3 W/cm2, indicated by bars) on membrane potential and charge (top), sodium and potassium channels kinetics (middle), and on LTS neuron T-type calcium channels kinetics (bottom). Fifty millisecond continuous stimulus, effectively stimulates all neuron types (A), whereas a 300-ms-long pulsed stimulus (pulse repetition frequency (PRF) 100 Hz and duty-cycle 5%) causes only the LTS neuron to tonically fire a volley of APs (B). This selective LTS excitation is mediated through the elevation of the T-type calcium channels' S-gates open probability during the US off times (right), which elevates these channels' conductance and consequently amplifies the charge accumulation process that occurs during US's-on periods. CE, Threshold intensity versus duration required to generate a single AP using constant duty-cycle (PRF, 100 Hz). The excitation thresholds for the RS and FS neurons at 5% duty-cycle are >3.5 orders of magnitude higher than for the LTS neuron (E), decreasing rapidly to ∼2× at 50% duty-cycle (C).
Figure 3.
Figure 3.
Detailed US response of LTS neurons (f=0.69 MHz). A, The contribution of each channel type to the accumulated membrane charge during 10 ms of CW versus a short-pulsed US stimulus (5% duty-cycle, PRF=100Hz): leak channels have the biggest contribution during the US-on period, whereas the T-type calcium channels dominate the US-off period. B, Leak and calcium channels' dynamical response to the first few US cycles (1.3 W/cm2); the hyperpolarized phase drives negative leak currents that insert positive charge into the cell, while rapidly suppressing the calcium conductance due to the changes in S- and U-type gates open probability p(t), through dynamical perturbations of the steady state probability (p), and the gates' time constants (τ). C, T-type calcium versus sodium channels' dynamical responses during sparse stimulation (5% duty-cycle, 1.3 W/cm2); the comparison highlights the dramatic changes during the US breaks in the calcium currents, open probability p(t) and the steady-state open probability (p) of the S- and U-type gates, whereas the Na+ gates are mostly dormant prior to action potential initiation (arrow). D, The pulsed US excitation thresholds of native RS and FS neurons versus following the chimeric addition of T-type calcium channels (RS+ and FS+).
Figure 4.
Figure 4.
Phase plane diagram of single-neuron responses to varying US stimulation duty-cycle and intensity versus experimental cortical neuromodulation parameters. The phase diagram boundaries denote threshold intensities for US-mediated responses (frequency 0.69 MHz, duration 500 ms) from excitatory RS neurons (green dashed lines indicating 10 Hz and 1 kHz PRFs) and inhibitory LTS interneurons (red dashed lines, changes only slightly for different PRFs, not shown). These boundaries separate the phase diagram into regions where either the inhibitory LTS neurons are activated alone (red, “suppression zone”) or the RS and the LTS neurons are jointly activated leading to net network stimulation (green, “activation zone”). The superposed bars indicate the experimental parameter ranges used in seven published cortical ultrasonic neuromodulation studies, color-coded according to the mediated responses: Ref. 1 (King et al., 2013; bars with diagonal lines), Ref. 2 (Yoo et al., 2011a), Ref. 3 (Kim et al., 2015), Ref. 4 (Kim et al., 2012), Ref. 5 (Kim et al., 2014), Ref. 6 (King et al., 2014), and Ref. 7 (Tufail et al., 2011). The excitation parameters reported for King et al. (2013) were those that caused stimulation success rates significantly higher than their noise floor (∼20%), with low-frequency CW intensities corrected for the expected formation of standing waves (Plaksin et al., 2014).
Figure 5.
Figure 5.
Simplified cortical NICE-network responses to different US waveforms and intensities. The US stimuli (US frequency and duration: 0.69 MHz and 1 s) are indicated by black bars (AC). A, For a stimulus duty-cycle of 5% and 0.1 W/cm2 intensity (PRF, 100 Hz) no significant response to US is observed. B, Increasing the intensity to 3.3 W/cm2 causes FS and RS activity suppression due to strong LTS activation (∼40 Hz). C, Increasing the duty-cycle to 50% (PRF, 10 Hz) leads to high frequency activation of the RS and FS neurons, unsuppressed by the weaker LTS firing (only at the beginning of each US pulse). D, Phase plane diagram for the network responses to US with varying duty-cycle and intensity (PRF, 100 Hz). Marks a–c indicate the conditions of the respective simulations (matching the experimental observations of Yoo et al. (2011a) and marks d, e, indicate parameters from Kim et al. (2015) where the experimental responses were no longer suppressive. The vertical green bar represent human primary somatosensory cortex stimulation parameters used to evoke tactile sensations (Lee et al., 2015); f marks the only case where no response was observed. The green and red arrows and the inset depict the effect of increased thalamic input on the activation and suppression thresholds.
Figure 6.
Figure 6.
The response of thalamic NICE-TC and NICE-RE models to low duty-cycle US stimulation waveforms. The US stimuli (US intensity: 5.2 W/cm2; US frequency: 0.69 MHz; PRF, 100 Hz) are indicated by black bars (AC). A, B, For a 1.5 s, 5% duty-cycle US stimulus, the TC cell fires a tonic 100 Hz volley of APs, whereas the RE cell fires only one volley and stops. Bottom, The currents' profiles of the segments marked in the top, where IU is the sum of Ih, IKL+, and ILeak currents (see complete channel composition in the Theoretical framework section). C, Increasing the duty-cycle to 6% and 7% brings the RE neurons to fire periodical volleys and a constant volley of APs after two braked volleys, respectively. D, The relation between the TC and RE neurons' spike rates and the US stimulation duty-cycle, calculated for the last 0.5 s period of the 1.5-s-long US stimulation.
Figure 7.
Figure 7.
Effect on cortical NICE-neuron models from different mammalian species (Pospischil et al., 2008) of continuous and 5% duty-cycle pulsed US stimuli (US intensity: 3.3 W/cm2; US frequency: 0.69 MHz; PRF, 100 Hz, indicated by bars). US stimulus effects on membrane potential, charge and channels kinetics for cortical neurons of two different mammals (RS and FS, ferret visual cortex; LTS, cat association cortex). The panel organization and responses were similar to those described in Figure 2 and are explained by the very same underlying mechanisms. For continuous stimuli (A; 100 ms duration) there isn't a major difference between the responses of the different neuron types, except for a delay in the LTS neuron firing due to low leaky channels' conductances that cause slower charge accumulation. For pulsed stimuli (B; 1500 ms duration), only the LTS neuron responded.
Figure 8.
Figure 8.
Effect of partial sonophore membrane area coverage during continuous and 5% duty-cycle pulsed US stimuli (US intensity: 3.3 W/cm2; US frequency: 0.69 MHz; PRF, 100 Hz, indicated by bars) on cortical RS (A) and LTS-NICE (B) neuron models, respectively. Partial coverage (here 75%) reduces the membrane potential oscillations down to a narrower range (>−150mV). Although the potential oscillations were more limited, the neurons' response to continuous and pulsed stimulation is still evident. Membrane capacitance was calculated as a weighted mean of the resting and dynamic capacitances: Cm=fsCm_s(t)+(1fs)Cm0 , where fs is the active area fraction.
Figure 9.
Figure 9.
Effect of purely sinusoidal capacitive drive on cortical RS and LTS-neuron models in continuous (A) and 5% duty-cycle (B) stimulation modes (Cm=Cm0+CAmpsin(2πft) , CAmp≈0.8 μF/cm2, f=0.69 MHz; PRF, 100 Hz, indicated by bars). Cm0 is the resting membrane capacitance. Although the sinusoidal and the intramembrane cavitation theory-based capacitance variations are fundamentally different, the basic qualitative neural responses remain the same. The CAmp was determined when 80% decline in the membrane capacitance (Fig. 1B; f=0.69 MHz and intensity 3.3 W/cm2) was taken into account.

References

    1. Alkire MT, Miller J (2005) General anesthesia and the neural correlates of consciousness. Prog Brain Res 150:229-244. 10.1016/S0079-6123(05)50017-7 - DOI - PubMed
    1. Bystritsky A, Korb AS, Douglas PK, Cohen MS, Melega WP, Mulgaonkar AP, DeSalles A, Min BK, Yoo SS (2011) A review of low-intensity focused ultrasound pulsation. Brain Stimul. 4:125-136. 10.1016/j.brs.2011.03.007 - DOI - PubMed
    1. Colucci V, Strichartz G, Jolesz F, Vykhodtseva N, Hynynen K (2009) Focused ultrasound effects on nerve action potential in vitro. Ultrasound Med Biol 35:1737-1747. 10.1016/j.ultrasmedbio.2009.05.002 - DOI - PMC - PubMed
    1. Coluccia D, Fandino J, Schwyzer L, O’Gorman R, Remonda L, Anon J, Martin E, Werner B (2014) First noninvasive thermal ablation of a brain tumor with MR-guided focused ultrasound. J Ther Ultrasound 2:17. 10.1186/2050-5736-2-17 - DOI - PMC - PubMed
    1. Cruikshank SJ, Lewis TJ, Connors BW (2007) Synaptic basis for intense thalamocortical activation of feedforward inhibitory cells in neocortex. Nat Neurosci 10:462-468. 10.1038/nn1861 - DOI - PubMed

Publication types

Substances