. 2016 Jul 8;11(7):e0158495.
doi: 10.1371/journal.pone.0158495. eCollection 2016.

Multiplexed Spectral Imaging of 120 Different Fluorescent Labels

Affiliations

Multiplexed Spectral Imaging of 120 Different Fluorescent Labels

Alex M Valm et al. PLoS One. .

Abstract

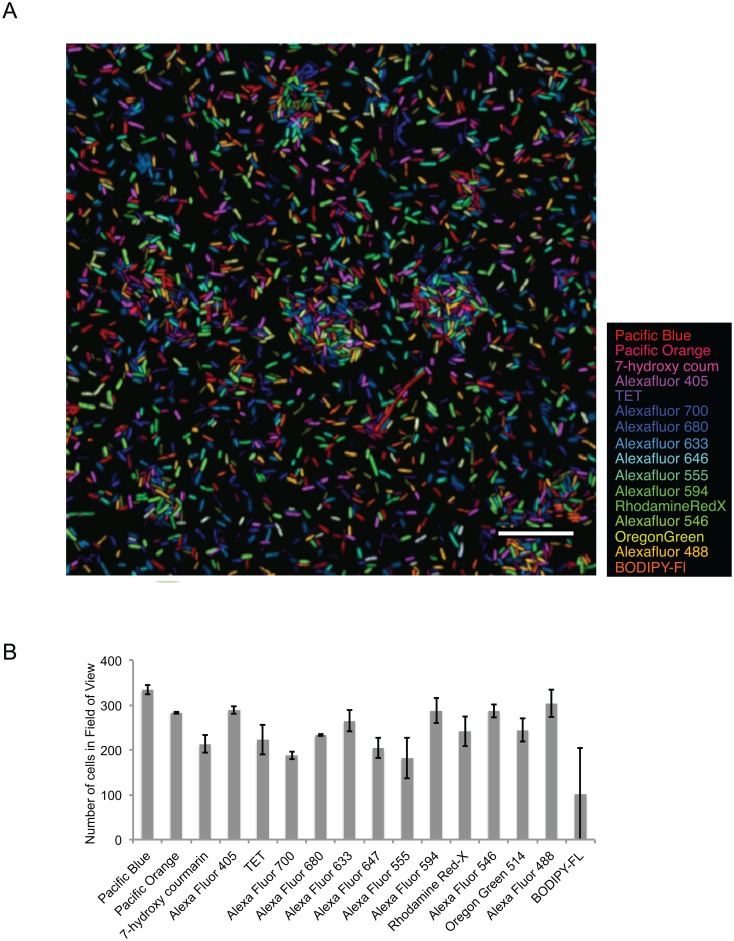
The number of fluorescent labels that can unambiguously be distinguished in a single image when acquired through band pass filters is severely limited by the spectral overlap of available fluorophores. The recent development of spectral microscopy and the application of linear unmixing algorithms to spectrally recorded image data have allowed simultaneous imaging of fluorophores with highly overlapping spectra. However, the number of distinguishable fluorophores is still limited by the unavoidable decrease in signal to noise ratio when fluorescence signals are fractionated over multiple wavelength bins. Here we present a spectral image analysis algorithm to greatly expand the number of distinguishable objects labeled with binary combinations of fluorophores. Our algorithm utilizes a priori knowledge about labeled specimens and imposes a binary label constraint on the unmixing solution. We have applied our labeling and analysis strategy to identify microbes labeled by fluorescence in situ hybridization and here demonstrate the ability to distinguish 120 differently labeled microbes in a single image.


Conflict of interest statement

Competing Interests: The authors have declared that no competing interests exist.

Figures

Fig 1
Fig 1. Excitation and emission spectra of 16 commercially available fluorophores.
Both excitation (A) and emission (B) spectra of organic fluorophores have characteristic shapes.
Fig 2
Fig 2. Concatenation of fluorophore emission spectra recorded with multiple excitation wavelengths.
Graphic representation of the m × n matrix of fluorophore emission spectra. Each column represents the spectrum of one fluorophore and each row represents the normalized intensities of the fluorophores at a particular excitation / emission wavelength combination. Shade in the boxes of the matrix represents normalized intensity from zero (black) to 1 (white). Intensity values in each column of the matrix were normalized to the maximum value for each fluorophore. The resulting excitation/emission pattern is specific to the combination of excitation wavelengths and excitation energy. In order for this matrix to correctly represent the fluorophore spectra in labeled specimens, the samples must be images using the same excitation wavelength combination and excitation power.
Fig 3
Fig 3. Graphic representation of the binary label constraint on the unmixing solution.
In this in-silico experiment, we depict an observed emission spectrum of an object labeled with AlexaFluor 488 and AlexaFluor 555 (solid line). Dotted lines represent possible binary combinations of reference spectra. While the graphic only shows 4 different binary combinations, the algorithm solves the unmixing operation for 120 combinations, each time finding the best fit of the binary spectrum to the observed spectrum. Once all 120 solutions are found, the solution with the overall lowest sum of squared residuals is identified and that combination is chosen as the best solution.
Fig 4
Fig 4. Mixture of 16 differently labeled populations of E. coli
A. Image of the E. coli mixture after standard linear unmixing using an algorithm that concatenates spectral data from multiple spectral images of a single field of view. Bar = 20 μm. Present in the center of the image is an abnormally long E. coli cell, which are sometimes present in our laboratory culture. B. Quantification of the 16 different label-types. Equal volumes of each label type were combined to create the mixture. All label-types are present in the image at approximately equal concentration as expected. Bars represent mean values from three fields of view of the same mixture and error bars represent standard deviation.
Fig 5
Fig 5. Computer model to test binary label constraint.
A. Normalized emission spectra of four fluorophores that are well excited by 488 nm laser light. B. Computer model data. Model particle spectra were created in Mathematica as a binary combination of Alexa Fluor 488 and BODIPY-FL, then unmixed against the spectra of all four fluorophores plotted in A. Results of the unmixing are plotted as the percent of particles that were correctly identified in their binary label composition as a function of signal-to-noise ratio in the modeled spectra either by standard unmixing or with a binary label constraint.
Fig 6
Fig 6. Proof-of-principle experiment with 120 differently labeled E. coli
A. Unmixed spectral image of an artificial mixture of 120 differently labeled E. coli, each of the 120 label types being a binary combination of two fluorophores from the repertoire of 16 in Fig 1. Cells were segmented from background in raw spectral images, intensity measurements were averaged over all pixels within each cell, then the averaged object spectra were unmixed using the binary-constrained algorithm described in the text. Each binary label-type is represented as a unique color. The image was acquired with a low magnification, high numerical aperture objective lens (20 X/0.8 NA). Bar = 100 μm. Inset shows a magnified region of interest from the unmixed image and a graphical representation of confidence in label assignment of each particle in the image. Confidence level is reported as the Pearson’s correlation coefficient between observed spectrum and computed model spectrum from the best-fit unmixing solution. Bar = 25 μm. B. Output from unmixed images, measured as the percent of each label-type of cell detected in the mixture is plotted against input into the mixture, measured as percent volume of each label-type added to make the mixture. Dashed, red line indicates the expected Input-to-Output relationship, (slope = 1). Error bars represent standard deviation in the percent output values from 8 different fields of view of the same artificial mixture.
Fig 7
Fig 7. Test of accuracy of binary label identification.
A. Unmixed spectral image of an artificial mixture of 15 differently labeled E. coli, each of the 15 label types being a binary combination of BODIPY-Fl with one of the other fluorophores from the repertoire of 16 in Fig 1. Cells were segmented from background in raw spectral images, intensity measurements were averaged over all pixels within each cell, then the averaged object spectra were unmixed using the binary-constrained algorithm described in the text, such that all 120 binary label types were possible solutions. Each of the 15 binary label-types known to be present in the sample is represented as a unique color, all 105 label types known not to be present in the mixture are colored gray. Circles denote all of the gray cells in the image. The image was acquired with a low magnification, high numerical aperture objective lens (20 X/0.8 NA). Bar = 100 μm. B. Quantification of label types. The number of cells of each of the 120 possible label types in the image in A were counted. Colored bars represent label types known to be present in the sample, gray bars represent label types known not to be present in the sample. C. Legend for (A) and (B). BOFl = BODIPY Fl, AF488 = Alexa Flour 488, OG514 = Oregon Green 514, AF546 = Alexa fluor 546, RRX = Rhodamine Red-X, AF594 = Alexa fluor 594, AF555 = Alexa fluor 555, AF647 = Alexa fluor 647, AF633 = Alexa fluor 633, AF680 = Alexa fluor 680, AF700 = Alexa flor 700, TET = Tetramethyl rhodamine, AF405 = Alexa fluor 405, PacOr = Pacific Orange, PacBl = Pacific Blue, 7HC = 7-Hydroxy coumarin.

References

    1. Kanchanawong P, Shtengel G, Pasapera AM, Ramko EB, Davidson MW, Hess HF, et al. Nanoscale architecture of integrin-based cell adhesions. Nature. 2010;468: 580–584. 10.1038/nature09621 - DOI - PMC - PubMed
    1. Kolenbrander PE, Palmer RJ, Periasamy S, Jakubovics NS. Oral multispecies biofilm development and the key role of cell-cell distance. Nat Rev Microbiol. 2010;8: 471–480. 10.1038/nrmicro2381 - DOI - PubMed
    1. Tsuriel S, Gudes S, Draft RW, Binshtok AM, Lichtman JW. Multispectral labeling technique to map many neighboring axonal projections in the same tissue. Nat Methods. 2015;12: 547–552. 10.1038/nmeth.3367 - DOI - PubMed
    1. Faust K, Raes J. Microbial interactions: from networks to models. Nat Rev Microbiol. 2012;10: 538–550. 10.1038/nrmicro2832 - DOI - PubMed
    1. Livet J, Weissman TA, Kang H, Draft RW, Lu J, Bennis RA, et al. Transgenic strategies for combinatorial expression of fluorescent proteins in the nervous system. Nature. 2007;450: 56–62. 10.1038/nature06293 - DOI - PubMed

MeSH terms

Substances

LinkOut - more resources