. 2016 Jul 8;11(7):e0158799.
doi: 10.1371/journal.pone.0158799. eCollection 2016.

Mechanical Ventilation Alters the Development of Staphylococcus aureus Pneumonia in Rabbit

Affiliations

Mechanical Ventilation Alters the Development of Staphylococcus aureus Pneumonia in Rabbit

Saber-Davide Barbar et al. PLoS One. .

Abstract

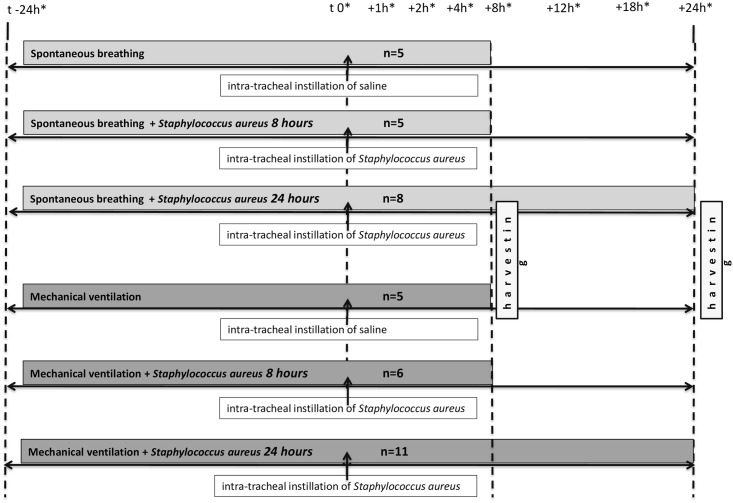
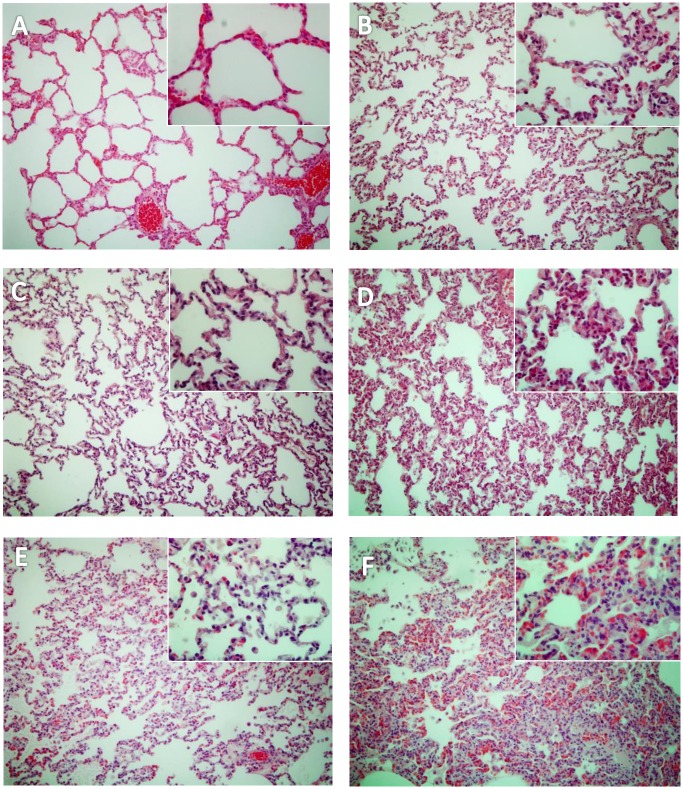
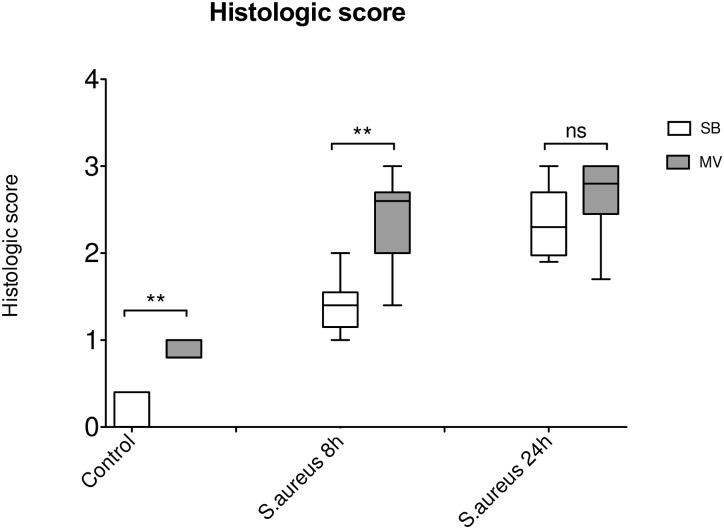
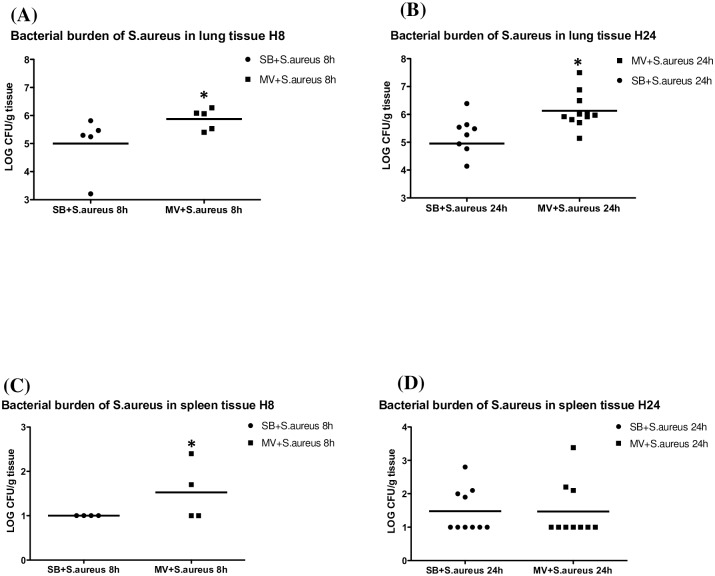
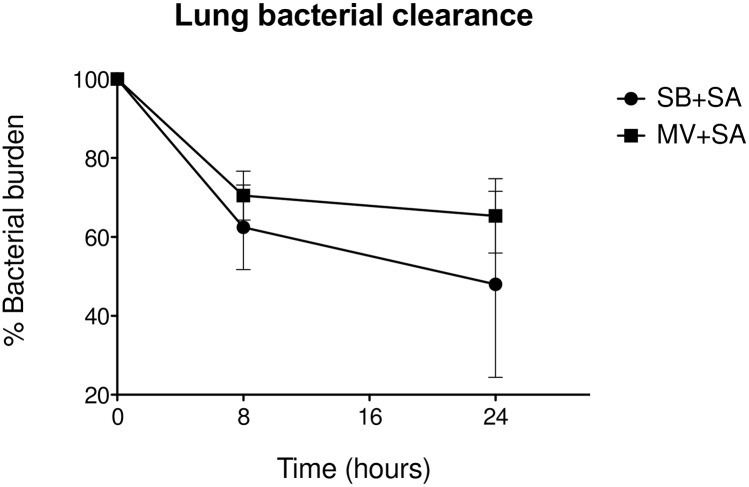
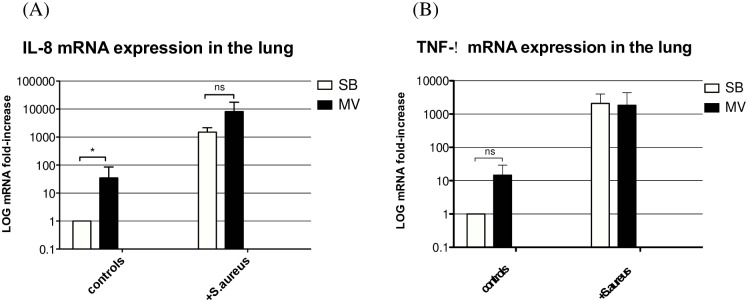
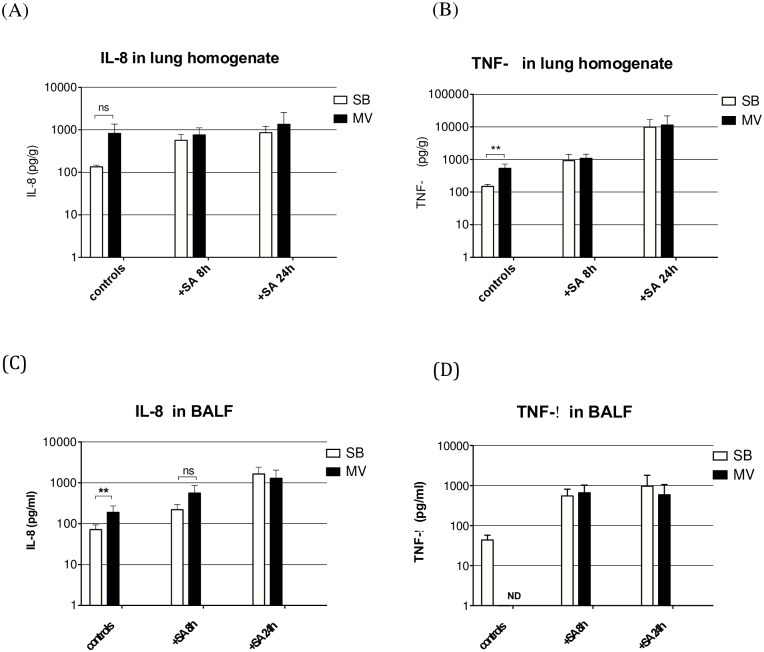
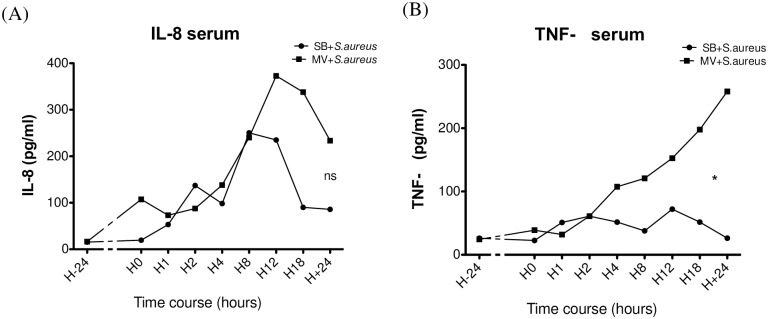
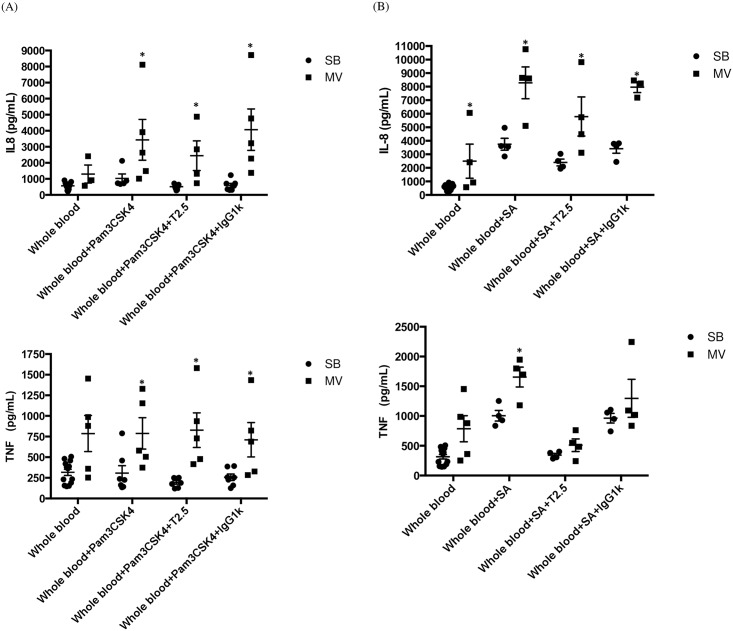
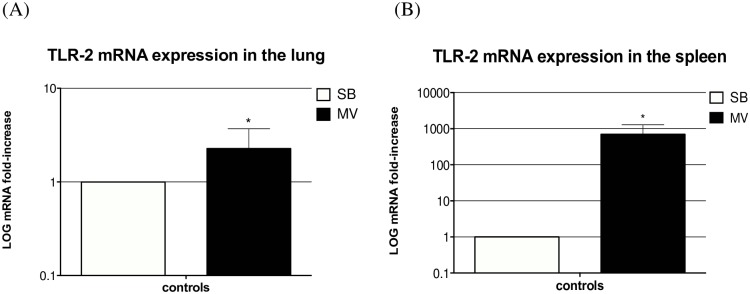
Ventilator-associated pneumonia (VAP) is common during mechanical ventilation (MV). Beside obvious deleterious effects on muco-ciliary clearance, MV could adversely shift the host immune response towards a pro-inflammatory pattern through toll-like receptor (TLRs) up-regulation. We tested this hypothesis in a rabbit model of Staphylococcus aureus VAP. Pneumonia was caused by airway challenge with S. aureus, in either spontaneously breathing (SB) or MV rabbits (n = 13 and 17, respectively). Pneumonia assessment regarding pulmonary and systemic bacterial burden, as well as inflammatory response was done 8 and 24 hours after S. aureus challenge. In addition, ex vivo stimulations of whole blood taken from SB or MV rabbits (n = 7 and 5, respectively) with TLR2 agonist or heat-killed S. aureus were performed. Data were expressed as mean±standard deviation. After 8 hours of infection, lung injury was more severe in MV animals (1.40±0.33 versus [vs] 2.40±0.55, p = 0.007), along with greater bacterial concentrations (6.13±0.63 vs. 4.96±1.31 colony forming units/gram, p = 0.002). Interleukin (IL)-8 and tumor necrosis factor (TNF)-αserum concentrations reached higher levels in MV animals (p = 0.010). Whole blood obtained from MV animals released larger amounts of cytokines if stimulated with TLR2 agonist or heat-killed S. aureus (e.g., TNF-α: 1656±166 vs. 1005±89; p = 0.014). Moreover, MV induced TLR2 overexpression in both lung and spleen tissue. MV hastened tissue injury, impaired lung bacterial clearance, and promoted a systemic inflammatory response, maybe through TLR2 overexpression.


Conflict of interest statement

Competing Interests: DCB and DH are members of the “Vivexia” company. This does not alter the authors' adherence to PLOS ONE policy on sharing data and materials.

Figures

Fig 1
Fig 1. Timeline representation of the experimental protocol.
*denotes blood sample drawing.
Fig 2
Fig 2. Lung injury main features according to the experimental condition.
Six representative light microphotographs of rabbit lungs in various conditions fixed at the same transpulmonary pressure (hematoxylin and eosin x400): (A) spontaneously breathing (SB) healthy rabbit (SB); (B) healthy rabbits submitted to a 32-hours mechanical ventilation (MV); (C) SB rabbits 8 hours after tracheal instillation of 109 CFU of Staphylococcus aureus; (D) MV rabbits 8 hours after tracheal instillation of 109 CFU of bacteria; (E) SB rabbits 24 hours after tracheal instillation of 109 CFU of S. aureus; (F) MV rabbits 24 hours after tracheal instillation of 109 CFU of S. aureus. We observed interalveolar septa thickened by an interstitial cell infiltrate and several alveoli collapsed mainly in the MV groups (B, D, F). CFU: colony forming unit.
Fig 3
Fig 3. Histologic score according to the experimental condition.
Histologic score ranging from 0 to 3, based on the degree of polymorphonuclear infiltration, haemorrhage, and oedema in the interstitial and alveolar spaces, following tracheal instillation of saline (controls) in either spontaneously breathing (SB, n = 5) rabbits or animals subjected to mechanical ventilation (MV, n = 5). Infected animals were challenged with 109 CFU of Staphylococcus aureus. After bacterial challenge animals were kept SB or under MV for 8 hours (n = 5 and 6, respectively) and 24 hours (n = 8 and 11, respectively). The histologic score was higher under MV. ** denotes p<0.05 between SB and MV animals; ns: not significant. CFU: colony forming unit. Controls SB versus (vs) MV p = 0.002; Mann-Whitney U test, two-tailed. S. aureus pneumonia SB vs MV 8 hours p = 0.011; Mann-Whitney U test, two-tailed. S. aureus pneumonia SB vs MV 24 hours p = 0.216; Mann-Whitney U test, two-tailed.
Fig 4
Fig 4. Pulmonary and systemic bacterial burden of Staphylococcus aureus.
(4A) S. aureus lung concentrations 8 and 24 hours after bacteria instillation. Pulmonary bacterial burden according to the experimental group in either spontaneously breathing (SB + S. aureus) or mechanically ventilated (MV + S. aureus) animals with Staphylococcus aureus pneumonia 8 hours after inoculation (n = 5 and 6, respectively) and 24 hours after inoculation (n = 8 and 11 respectively). The bacterial burden was higher in the MV group both after 8 hours (5.00±1.03 versus [vs.] 5.87±0.38 log10CFU/g, p = 0.028) and 24 hours of MV (4.96±1.31 vs. 6.13±0.63 log10CFU/g, p = 0.002). *denotes p≤0.05. CFU: colony forming unit. (4B) S. aureus spleen concentrations 8 and 24 hours after bacteria instillation. Spleen bacterial burden according to the experimental group in either spontaneously breathing (SB + S. aureus) or mechanically ventilated (MV + S. aureus) animals with Staphylococcus aureus pneumonia (n = 4 and 5, respectively*). Interestingly, MV appears to promote early pulmonary-to-systemic translocation during S. aureus pneumonia, as indicated by the quantitative spleen cultures, as an indirect marker of bacteraemia, which were positive only in ventilated animals after 8 hours, even though there was no longer any difference after 24 hours. *spleen was lost in 1 animal from each group. Lung S. aureus concentrations SB versus (vs) MV 8 hours p = 0.050; Mann-Whitney U test, two-tailed. Lung S. aureus concentrations SB vs MV 24 hours p = 0.007; Mann-Whitney U test, two-tailed. Spleen S. aureus concentrations SB vs MV 8 hours p = 0.430; Mann-Whitney U test, two-tailed. Spleen S. aureus concentrations SB vs MV 24 hours p = 0.110; Mann-Whitney U test, two-tailed.
Fig 5
Fig 5. Lung bacterial clearance.
Pulmonary bacterial clearance expressed as a percentage of the reduction of log10CFU 8 and 24 hours after inoculation with Staphylococcus aureus in either spontaneously breathing (SB + S. aureus; n = 5 and 6, respectively), or mechanically ventilated (MV + S. aureus; n = 8 and 11, respectively) animals. *denotes p≤0.05. CFU: colony forming unit. Pulmonary S. aureus clearance SB versus MV 24 hours: p = 0.045; Mann-Whitney U test, two-tailed.
Fig 6
Fig 6. Inflammatory cytokine gene expression in the lung.
(6A) IL-8 gene expression in the lung. Inflammatory cytokine interleukin (IL)-8 gene expression in lung homogenates 8 hours after tracheal instillation of saline (controls) in either spontaneously breathing (SB, n = 5) rabbits or animals subjected to mechanical ventilation (MV, n = 5), or after challenge with 109 CFU of Staphylococcus aureus (+S. aureus) (n = 5 in each group**). All values are reported as fold increase compared with SB rabbits. Results are expressed as mean±standard deviation. IL-8 gene expression was increased under MV in all groups. *denotes p≤0.05; ns: not significant; **PCR amplification failed in 1 MV rabbit. CFU: colony forming unit. Controls SB versus (vs) MV p = 0.008, Mann-Whitney U test, two-tailed. S. aureus SB vs MV p = 0.873, Mann-Whitney U test, two-tailed. (6B) TNF-α gene expression in the lung. Inflammatory cytokine tumor necrosis factor (TNF)-α gene expression in lung homogenates 8 hours after tracheal instillation of saline (controls) in either spontaneously breathing (SB, n = 5) rabbits or animals subjected to mechanical ventilation (MV, n = 5), or after challenge with 109 CFU of Staphylococcus aureus (+S. aureus) (n = 5 in each group). All values are reported as fold increases compared with SB rabbits. Results are expressed as mean±standard deviation TNF-α gene expression was increased under MV only in control animals, *denotes p≤0.05; ns: not significant; **Polymerase chain reaction amplification failed in 1 MV rabbit. CFU: colony forming unit. Controls SB versus (vs) MV p = 0.076, Mann-Whitney U test, two-tailed. S. aureus SB vs MV p = 0.825, Mann-Whitney U test, two-tailed.
Fig 7
Fig 7. Inflammatory cytokines in the lung.
Inflammatory cytokines (interleukin [IL]-8 and tumor necrosis factor [TNF]-α) in lung homogenates and in broncho-alveolar lavage fluid (BALF) 8 to 24 hours after tracheal instillation of saline (controls) in either spontaneously breathing (SB, n = 5) rabbits or animals subjected to mechanical ventilation (MV, n = 5), or 8 hours (n = 5) or 24 hours (n = 10) after challenge with 109 CFU of Staphylococcus aureus (+S. aureus H8 and H24). IL-8 levels were increased in lung homogenates and in BALF under MV in controls, but we did not find any significant difference between SB and MV groups after bacterial challenge. Similarly, TNF-α levels were significantly increased in lung homogenates from animals under MV than in controls, but not after bacterial challenge. ** denotes p<0.05; ns: not significant; ND: concentration below the limits of detection of the assay. CFU: colony forming unit. (A) Controls SB versus (vs) MV p = 0.333, Mann-Whitney U test, two-tailed. S. aureus H8 SB vs MV p = 0.397, Mann-Whitney U test, two-tailed. S. aureus H24 SB vs MV p = 0.395, Mann-Whitney U test, two-tailed. (B) Controls SB vs MV p = 0.004, Mann-Whitney U test, two-tailed. S. aureus H8 SB vs MV p = 0.413, Mann-Whitney U test, two-tailed. S. aureus H24 SB vs MV p = 0.881, Mann-Whitney U test, two-tailed. (C) Controls SB vs MV p = 0.024, Mann-Whitney U test, two-tailed. S. aureus H8 SB vs MV p = 0.114, Mann-Whitney U test, two-tailed. S. aureus H24 SB vs MV p = 0.700, Mann-Whitney U test, two-tailed. (D) S. aureus H8 SB vs MV p = 0.829, Mann-Whitney U test, two-tailed. S. aureus H24 SB vs MV p = 0.700, Mann-Whitney U test, two-tailed.
Fig 8
Fig 8. Time course of mean serum inflammatory cytokine concentrations during experiment.
Serum concentrations of interleukin (IL)-8 (Fig 8A) and tumor necrosis factor (TNF)-α (Fig 8B) measured by enzyme-linked immune-sorbent assay at baseline, just before intra-tracheal instillation of 109 CFU of Staphylococcus aureus, in the spontaneously breathing (SB+S.aureus) and the mechanically ventilated (MV+S.aureus) animals, and then 1, 2, 4, 8, 12, 18 and 24 hours after instillation (n = 15). Significant changes over time in each group were assessed by repeated-measures analysis of variance followed by the post hoc Bonferroni multiple comparison test when significance was reached. *denotes variations with time significantly different between MV groups versus SB groups; ns: not significant. CFU: colony forming unit. (A) repeated-measures ANOVA mean difference = -69.35 [-141.7 to +2.969] 95% CI; p = ns). (B) repeated-measures ANOVA mean difference = -56.11 [-104.7 to -7.547] 95% CI; p = 0.010).
Fig 9
Fig 9. Inflammatory cytokines in whole blood stimulated ex vivo by either Pam3CSK4, or S. aureus.
Interleukin (IL)-8 and tumor necrosis factor (TNF)-α levels in total blood stimulated ex vivo by Pam3CysSerLys4 (Pam3CSK4) (Fig 9A) or Staphylococcus aureus (Fig 9B) in either spontaneously breathing (SB, n = 7) rabbits or animals subjected to mild-stretch mechanical ventilation (MV, n = 5), with or without the anti-toll-like receptor (TLR)2 monoclonal antibody (Mab) T2.5. Interleukin-8 levels were not significantly greater in blood obtained from rabbits under MV than in controls but the difference reached statistical significance after stimulation by Pam3CSK4 and S. aureus as well. Similarly, TNF-α levels were not significantly higher in blood taken from MV animals than in blood from SB animals. In contrast, Pam3CSK4 stimulation led to the release of significantly larger amounts of TNF-α in the MV than in the SB group, as did S. aureus stimulation. Although TLR2 blockade by T2.5 Mab did not abrogate the release of inflammatory mediators by the whole blood obtained from either SB or MV animals after Pam3CSK4 stimulation, TNF-α but not IL-8 release reached baseline values when Mab was added to media prior to S. aureus stimulation. * denotes p<0.05 between SB and MV animals. (A) IL-8 Controls: SB versus (vs) MV p = 0.010, Mann-Whitney U test, two-tailed. Pam3CSK4 SB vs MV p = 0.010, Mann-Whitney U test, two-tailed. Pam3CSK4 + T2.5 SB vs MV p = 0.002, Mann-Whitney U test, two-tailed. Pam3CSK4 + IgG1k SB vs MV p = 0.002, Mann-Whitney U test, two-tailed. TNF-α: Controls SB vs MV p = 0.075, Mann-Whitney U test, two-tailed. Pam3CSK4 SB vs MV p = 0.030, Mann-Whitney U test, two-tailed. Pam3CSK4 + T2.5 SB vs MV p = 0.002, Mann-Whitney U test, two-tailed. Pam3CSK4 + IgG1k SB vs MV p = 0.030, Mann-Whitney U test, two-tailed. (B) IL-8: Controls SB vs MV p = 0.010, Mann-Whitney U test, two-tailed. S. aureus SB vs MV p = 0.029, Mann-Whitney U test, two-tailed. S. aureus + T2.5 SB vs MV p = 0.029, Mann-Whitney U test, two-tailed. S. aureus + IgG1k SB vs MV p = 0.200, Mann-Whitney U test, two-tailed. TNF-α Controls SB vs MV p = 0.075, Mann-Whitney U test, two-tailed. S. aureus SB vs MV p = 0.057, Mann-Whitney U test, two-tailed. S. aureus + T2.5 SB vs MV p = 0.343, Mann-Whitney U test, two-tailed. S. aureus + IgG1k SB vs MV p = 0.657, Mann-Whitney U test, two-tailed.
Fig 10
Fig 10. Toll-like receptor 2 gene expression.
TLR2 gene expression was measured in both lung (left) and spleen homogenates (right) in either spontaneously breathing rabbits (SB) or animals subjected to mechanical ventilation (MV) (n = 5 in each group). All values are reported as fold increases compared with SB rabbits. Results are expressed as mean±standard deviation. * denotes p<0.05 between SB and MV animals. (A) Controls SB versus (vs) MV p<0.001, Wilcoxon test, two-tailed. (B) Controls SB vs MV p<0.001, Wilcoxon test, two-tailed.

References

    1. Torres A, Ewig S, Lode H, Carlet J. Defining, treating and preventing hospital acquired pneumonia: European perspective. Intensive care medicine. 2009;35(1):9–29. Epub 2008/11/08. 10.1007/s00134-008-1336-9 - DOI - PubMed
    1. Chastre J, Fagon JY. Ventilator-associated pneumonia. American journal of respiratory and critical care medicine. 2002;165(7):867–903. - PubMed
    1. Bouadma L, Mourvillier B, Deiler V, Le Corre B, Lolom I, Regnier B, et al. A multifaceted program to prevent ventilator-associated pneumonia: impact on compliance with preventive measures. Critical care medicine. 2010;38(3):789–96. 10.1097/CCM.0b013e3181ce21af - DOI - PubMed
    1. Mourgeon E, Isowa N, Keshavjee S, Zhang X, Slutsky AS, Liu M. Mechanical stretch stimulates macrophage inflammatory protein-2 secretion from fetal rat lung cells. Am J Physiol Lung Cell Mol Physiol. 2000;279(4):L699–706. - PubMed
    1. Xiang M, Fan J. Pattern recognition receptor-dependent mechanisms of acute lung injury. Mol Med. 2010;16(1–2):69–82. 10.2119/molmed.2009.00097 - DOI - PMC - PubMed

MeSH terms

LinkOut - more resources