. 2016 Jul 8;11(7):e0159059.
doi: 10.1371/journal.pone.0159059. eCollection 2016.

Induction of Suppressor Cells and Increased Tumor Growth following Chronic Psychosocial Stress in Male Mice

Affiliations

Induction of Suppressor Cells and Increased Tumor Growth following Chronic Psychosocial Stress in Male Mice

Dominic Schmidt et al. PLoS One. .

Abstract

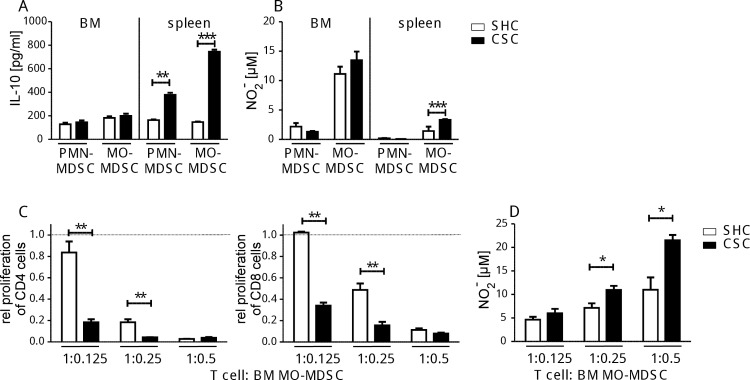
To study the impact of psychosocial stress on the immune system, male mice were subjected to chronic subordinate colony housing (CSC), a preclinically validated mouse model for chronic psychosocial stress. CSC substantially affected the cell composition of the bone marrow, blood, and spleen by inducing myelopoiesis and enhancing the frequency of regulatory T cells in the CD4 population. Expansion of the myeloid cell compartment was due to cells identified as immature inflammatory myeloid cells having the phenotype of myeloid-derived suppressor cells of either the granulocytic or the monocytic type. Catecholaminergic as well as TNF signaling were implicated in these CSC-induced cellular shifts. Although the frequency of regulatory cells was enhanced following CSC, the high capacity for inflammatory cytokine secretion of total splenocytes indicated an inflammatory immune status in CSC mice. Furthermore, CSC enhanced the suppressive activity of bone marrow-derived myeloid-derived suppressor cells towards proliferating T cells. In line with the occurrence of suppressor cell types such as regulatory T cells and myeloid-derived suppressor cells, transplanted syngeneic fibrosarcoma cells grew better in CSC mice than in controls, a process accompanied by pronounced angiogenesis and clustering of immature myeloid cells in the tumor tissue. In addition, tumor implantation after CSC reinforced the CSC-induced increase in myeloid-derived suppressor cells and regulatory T cell frequencies while the CSC-induced cellular changes eased off in mice without tumor. Together, our data suggest a role for suppressor cells such as regulatory T cells and myeloid-derived suppressor cells in the enhanced tumor growth after chronic psychosocial stress.


Conflict of interest statement

Competing Interests: The authors have declared that no competing interests exist.

Figures

Fig 1
Fig 1. Effect of CSC on spleen cells.
Splenocytes from CSC (black bars) and SHC mice (white bars) were isolated and analyzed by flow cytometry (total splenocytes SHC, n = 7: 4.2±1.7x10⁷; CSC, n = 8: 9.8±2.4x10⁷). The percentage of splenic B (SHC: 1.9±0.8x10⁷; CSC: 3.2±0.8x10⁷) and T cells (SHC: 1.6±0.3x10⁷; CSC: 2.6±0.6x10⁷) (A) and Treg cells (SHC: 2.0±0.4x10⁶; CSC: 2.6±0.6x10⁶) (B) were quantified after 19d of SHC/CSC. Splenic CD11b+ cells (C) and CD11b+ cells differentiated by their Gr1 expression level were analyzed after 48h and 19d of CSC (SHC: n = 8, CSC: n = 8) (D). Immunohistochemical staining of spleen sections from mice after 19d of CSC/SHC for CD11b+ (blue), Gr1+ (green), and B220+ (red) cells was performed (E). Splenocytes from individual mice after 19d CSC/SHC were stimulated with LPS followed by determination of TNF, IL-6, and IL-10 levels in the supernatants (SHC: n = 4, CSC: n = 4) (F). *p < 0.05; **p < 0.01; ***p < 0.001 (Student´s t-test). These experiments were performed at least 3 times.
Fig 2
Fig 2. Induction of immature myeloid cells by CSC.
Splenocytes from CSC (black bars) and SHC (white bars) mice were isolated and analyzed by flow cytometry. The percentages of splenocytes from individual mice (SHC: n = 4, spleen cell pool: 1.7x10⁸; CSC: n = 4, spleen cell pool: 2.4x10⁸) (A), of blood cells counted in 0.1ml of blood (SHC: n = 8, CSC: n = 8) (B), and of bone marrow cells (SHC: n = 3, CSC: n = 3) (C) are shown depending on their staining pattern for CD11b+Ly6G+Ly6Cint (PMN-MDSC), and CD11b+Ly6G-Ly6Chigh (MO-MDSC) (left graphs) or B220+ and CD3+ (right graphs). *p < 0.05; **p < 0.01; ***p < 0.001 (Student´s t-test). These experiments were performed more than 3 times.
Fig 3
Fig 3. Involvement of catecholamines, TNF, or TNFR2 on CSC-caused cellular shifts.
(A) Mice were treated either with PBS or 6-OH dopamine (6OHDA) before induction of CSC/SHC. Splenocytes from individual PBS-treated SHC (white bars, n = 4, total splenocytes: 3.4±0.6x10⁷) and CSC mice (black bars, n = 3, total splenocytes: 4.1±1.6x10⁷), 6OHDA-treated SHC (light grey bars, n = 4, total splenocytes: 4.1±0.7x10⁷) and CSC mice (dark grey bars, n = 3, total splenocytes: 6.3±1x10⁷) were isolated after 19d of SHC/CSC and analyzed by flow cytometry. The percentages of CD11b+ cells (SHC/PBS: 3.3±0.6x10⁶; CSC/PBS: 6.9±2.7x10⁶; SHC/6OHDA: 4.9±0.8x10⁶; CSC/6OHDA: 9.5±0.2x10⁶), CD11b+Ly6G+Ly6Cint (PMN-MDSC, SHC/PBS: 0.4±0.1x10⁶; CSC/PBS: 2.9±1.1x10⁶; SHC/6OHDA: 1.0±0.2x10⁶; CSC/6OHDA: 2.1±0.0x10⁶), and CD11b+Ly6G-Ly6Chigh (MO-MDSC, SHC/PBS: 0.2±0.03x10⁶; CSC/PBS: 0.6±0.2x10⁶; SHC/6OHDA: 0.5±0.1x10⁶; CSC/6OHDA: 1.2±0.02x10⁶) were determined. (B) Wild type (Bl/6) or TNF-deficient (TNF-/-) mice were exposed to SHC/CSC. The percentages of CD11b+ cells, PMN-MDSC, and MO-MDSC of individual Bl/6-SHC- (white bars, n = 4, total splenocytes: 4.2±1.7x10⁷), Bl/6-CSC- (black bars, n = 3, total splenocytes: 8.9±2.4x10⁷), TNF-/—SHC (light gray bars, n = 6, total splenocytes: 6.9±1.3x10⁷), and TNF-/—CSC-mice (dark grey bars, n = 5, total splenocytes: 9.3±1.9x10⁷) were quantified. The percentages of CD11b+ cells (SHC/Bl/6: 4.0±1.6x10⁶; CSC/Bl/6: 16.1±4.0x10⁶; SHC/TNF-/-: 6.4±1.4x10⁶; CSC/TNF-/-: 10.8±2.4x10⁶), CD11b+Ly6G+Ly6Cint (PMN-MDSC, SHC/Bl/6: 1.2±0.5x10⁶; CSC/Bl/6: 6.0±1.5x10⁶; SHC/TNF-/-: 1.4±0.3x10⁶; CSC/TNF-/-: 2.9±0.1x10⁶), and CD11b+Ly6G-Ly6Chigh (MO-MDSC, SHC/Bl/6: 0.5±0.3x10⁶; CSC/Bl/6: 1.8±0.5x10⁶; SHC/TNF-/-: 0.5±0.1x10⁶; CSC/TNF-/-: 1.1±0.2x10⁶) were determined. (C) Wild type (Bl/6-SHC, n = 3, white bars, total splenocytes: 7.1±1.5x10⁷; Bl/6-CSC, n = 4, black bars, total splenocytes: 9.5±2.1x10⁷) or TNFR2-deficient (TNFR2-/- SHC, n = 4, light gray bars, total splenocytes: 6.3±1.2x10⁷; TNFR2-/- CSC, n = 4, dark grey bars, total splenocytes: 5.1±0.9x10⁷) mice were exposed to SHC/CSC. The percentages of CD11b+ cells (SHC/WT: 7.1±1.5x10⁶; CSC/WT: 17.8±3.9x10⁶; SHC/TNFR2-/-: 5.9±1.1x10⁶; CSC/TNFR2-/-: 6.9±1.2x10⁶), PMN-MDSC (SHC/WT: 2.0±0.4x10⁶; CSC/WT: 6.1±1.3x10⁶; SHC/TNFR2-/-: 1.6±0.3x10⁶; CSC/TNFR2-/-: 2.0±0.4x10⁶), and MO-MDSC (SHC/WT: 1.2±0.2x10⁶; CSC/WT: 3.3+0.7x10⁶; SHC/TNFR2-/-: 0.9±0.2x10⁶; CSC/TNFR2-/-: 0.8±0.14x10⁶)(left graph) or Treg cells (SHC/WT: 1.4±0.2x10⁶; CSC/WT: 2.0±0.4x10³; SHC/TNFR2-/-: 1.0±0.2x10⁶; CSC/TNFR2-/-: 0.6±0.1x10⁶)(right graph) were quantified. These experiments were performed twice. *p < 0.05; **p < 0.01; ***p < 0.001 (2way ANOVA).
Fig 4
Fig 4. Functional activity of bone marrow-derived PMN-MDSC and MO-MDSC after CSC.
CD11b+Ly6G+Ly6Cint cells (PMN-MDSC) and CD11b+Ly6G-Ly6C+ cells (MO-MDSC) were isolated from bone marrow (BM) or spleen of individual mice after 19d of CSC (black bars, n = 4) or SHC (white bars, n = 4) and stimulated with LPS + IFNγ followed by IL-10 (A) and NO2- (B) determination in the supernatants. MO-MDSC (CD11b+Ly6G-Ly6C+) were isolated from the bone marrow of mice after 19d of CSC (black bars, n = 4) or SHC (white bars, n = 4) and co-cultured with proliferating splenocytes from naive mice. Relative proliferation of CD4+ (left graph) and CD8+ (right graph) T cells is shown at different T cell to MO-MDSC ratios (C). The NO2- contents of the supernatants from (C) were measured (D). These experiments were performed once *p < 0.05; **p < 0.01; ***p < 0.001 (Student´s t-test).
Fig 5
Fig 5. Effect of CSC after 23 days of tumor growth.
BFS1 tumor cells were inoculated subcutaneously after 19 days of either SHC (white bars, n = 7) or CSC (black bars, n = 8) and tumor growth was monitored for 23 days (A). The weight of the tumor tissue was determined on day 23 after termination of CSC/SHC (B). Immunohistochemical staining is shown for Gr1+ (green) and endothelial (Meca32, red) cells in tumor sections (C). Percentages of CD11b+cells, CD11b+Ly6G+Ly6Cint cells (PMN-MDSC), and CD11b+Ly6G-Ly6Chigh cells (MO-MDSC) in spleens of individual mice were quantified (SHC: n = 7, total splenocytes: 4.9±1.7x10⁷, CSC: n = 8, total splenocytes: 5.6±0.7x10⁷) (D). This experiment was performed once *p < 0.05; ***p < 0.001 (Student´s t-test).
Fig 6
Fig 6. Effect of CSC after 9 days of tumor growth.
BFS1 tumor cells were inoculated subcutaneously after 19 days of either SHC (white bars, n = 7) or CSC (black bars, n = 8) and tumor growth was monitored for 9 days (A) and the tumor weight was determined (B). Immunohistochemical staining is shown for vessels (CD31, red) and cell nuclei (DAPI, blue) in 6 central tumor sections per mouse (magnification 50-fold) (C). The area of CD31+ cells in tumor sections from mice was quantified after SHC/CSC (D). Spleen cells from tumor-free (E, F) and of tumor-bearing mice (G, H) 9 days after termination of CSC/SHC were analyzed. Percentages of CD11b+ cells, CD11b+Gr1high, CD11b+Gr1int cells and Treg cells were determined in spleens of individual tumor-free (total splenocytes plus CD4 cells without (w/o) tumor CSC/SHC (E, left graph) or tumor-bearing CSC/SHC-mice (total splenocytes plus CD4 cells with tumor CSC/SHC (G, left graph). CD11b+Ly6G-Ly6C+ cells (MO-MDSC) were isolated from spleens of individual tumor-free (F) or tumor-bearing-SHC/CSC-mice (H) and co-cultured with proliferating splenocytes from naive mice. Relative proliferation of CD4+ (left graphs) and CD8+ (right graphs) T cells is shown at different T cell to MDSC ratios. This experiment was performed once *p < 0.05; **p < 0.01 (Student´s t-test).

References

    1. Dhabhar FS. Enhancing versus suppressive effects of stress on immune function: implications for immunoprotection and immunopathology. Neuroimmunomodulation 2009;16(5):300–17. 10.1159/000216188 - DOI - PMC - PubMed
    1. Selye H. A syndrome produced by diverse nocuous agents. 1936. J Neuropsychiatry Clin Neurosci 1998;10(2):230–1. - PubMed
    1. Raison CL, Capuron L, Miller AH. Cytokines sing the blues: inflammation and the pathogenesis of depression. Trends Immunol 2006. January;27(1):24–31. - PMC - PubMed
    1. Langgartner D, Fuchsl AM, Uschold-Schmidt N, Slattery DA, Reber SO. Chronic subordinate colony housing paradigm: a mouse model to characterize the consequences of insufficient glucocorticoid signaling. Front Psychiatry 2015;6:18 10.3389/fpsyt.2015.00018 - DOI - PMC - PubMed
    1. Powell ND, Sloan EK, Bailey MT, Arevalo JM, Miller GE, Chen E, et al. Social stress up-regulates inflammatory gene expression in the leukocyte transcriptome via beta-adrenergic induction of myelopoiesis. Proc Natl Acad Sci U S A 2013. October 8;110(41):16574–9. 10.1073/pnas.1310655110 - DOI - PMC - PubMed

MeSH terms

Substances