

Expression and localization of members of the thrombospondin family during final follicle maturation and corpus luteum formation and function in the bovine ovary
- PMID: 27396384
- PMCID: PMC5081738
- DOI: 10.1262/jrd.2016-056
Expression and localization of members of the thrombospondin family during final follicle maturation and corpus luteum formation and function in the bovine ovary
Abstract
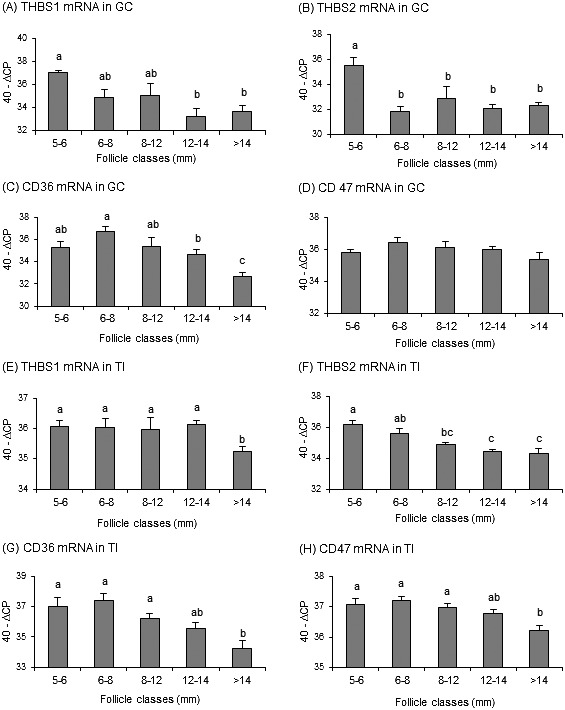
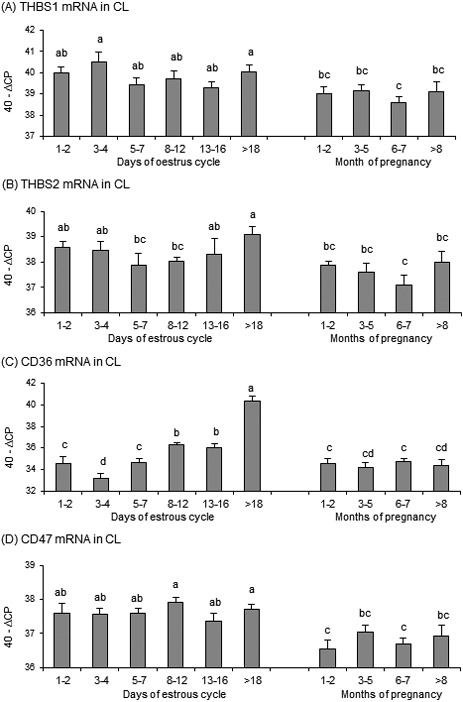
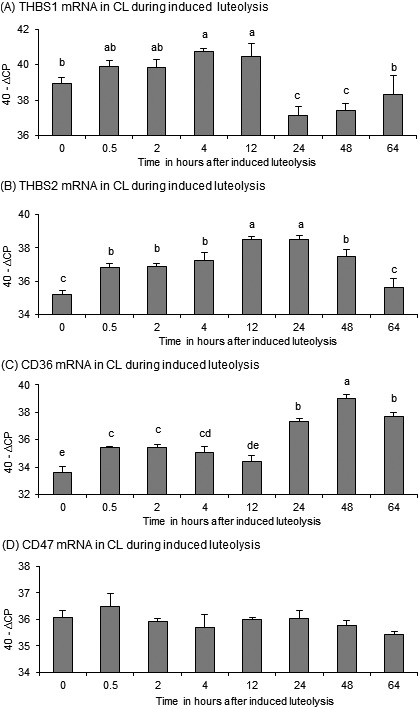
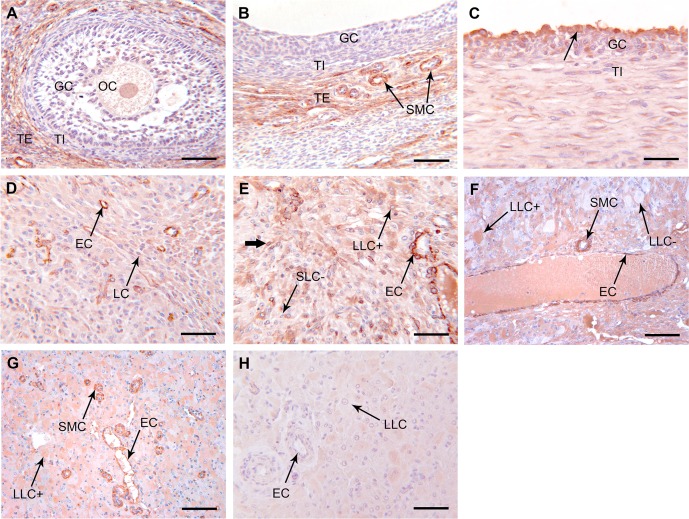
The aim of this study was to characterize the expression patterns and localization of the thrombospondin family members (THBS1, THBS2) and their receptors (CD36 and CD47) in bovine ovaries. First, the antral follicles were classified into 5 groups based on the follicle size and estradiol-17beta (E2) concentration in the follicular fluid (< 0.5, 0.5-5, 5-40, 40-180 and >180 E2 ng/ml). Second, the corpus luteum (CL) was assigned to the following stages: days 1-2, 3-4, 5-7, 8-12, 13-16 and >18 of the estrous cycle and of pregnancy (month 1-2, 3-4, 6-7 and > 8). Third, the corpora lutea were collected by transvaginal ovariectomy before and 0.5, 2, 4, 12, 24, 48 and 64 h after inducing luteolysis by injecting a prostaglandin F2alpha analog. The mRNA expression of examined factors was measured by RT-qPCR, steroid hormone concentration by EIA, and localization by immunohistochemistry. The mRNA expression of THBS1, THBS2, CD36, and CD47 in the granulosa cells and theca interna was high in the small follicles and reduced in the preovulatory follicles. The mRNA expression of THBS1, THBS2, and CD47 in the CL during the estrous cycle was high, but decreased significantly during pregnancy. After induced luteolysis, thrombospondins increased significantly to reach the maximum level at 12 h for THBS1, 24 h for THBS2, and 48 h for CD36. The temporal expression and localization pattern of the thrombospondins and their specific receptors in the antral follicles and corpora lutea during the different physiological phases of the estrous cycle and induced luteolysis appear to be compatible with their inhibitory role in the control of ovarian angiogenesis.
Figures
Similar articles
-
Expression pattern of HIF1alpha and vasohibins during follicle maturation and corpus luteum function in the bovine ovary.Reprod Domest Anim. 2017 Feb;52(1):130-139. doi: 10.1111/rda.12867. Epub 2016 Nov 11. Reprod Domest Anim. 2017. PMID: 27862406
-
Expression and localization of gap junctional connexins 26 and 43 in bovine periovulatory follicles and in corpus luteum during different functional stages of oestrous cycle and pregnancy.Reprod Domest Anim. 2009 Apr;44(2):295-302. doi: 10.1111/j.1439-0531.2008.01068.x. Epub 2008 Nov 13. Reprod Domest Anim. 2009. PMID: 19032438
-
Expression and localization of thrombospondin-1 and -2 and their cell-surface receptor, CD36, during rat follicular development and formation of the corpus luteum.Biol Reprod. 2002 Nov;67(5):1522-31. doi: 10.1095/biolreprod.102.007153. Biol Reprod. 2002. PMID: 12390884
-
Exogenous hormonal manipulation of ovarian activity in cattle.Domest Anim Endocrinol. 2002 Jul;23(1-2):211-28. doi: 10.1016/s0739-7240(02)00158-3. Domest Anim Endocrinol. 2002. PMID: 12142239 Review.
-
Ovarian follicular and luteal physiology.Int Rev Physiol. 1980;22:117-201. Int Rev Physiol. 1980. PMID: 6248477 Review.
Cited by
-
Newly Identified Regulators of Ovarian Folliculogenesis and Ovulation.Int J Mol Sci. 2020 Jun 26;21(12):4565. doi: 10.3390/ijms21124565. Int J Mol Sci. 2020. PMID: 32604954 Free PMC article. Review.
-
Bone marrow-derived mesenchymal stem cells promote Helicobacter pylori-associated gastric cancer progression by secreting thrombospondin-2.Cell Prolif. 2021 Oct;54(10):e13114. doi: 10.1111/cpr.13114. Epub 2021 Aug 25. Cell Prolif. 2021. PMID: 34435402 Free PMC article.
-
Downregulated luteolytic pathways in the transcriptome of early pregnancy bovine corpus luteum are mimicked by interferon-tau in vitro.BMC Genomics. 2021 Jun 16;22(1):452. doi: 10.1186/s12864-021-07747-3. BMC Genomics. 2021. PMID: 34134617 Free PMC article.
-
Oocyte-specific disruption of adrenomedullin 2 gene enhances ovarian follicle growth after superovulation.Front Endocrinol (Lausanne). 2022 Nov 14;13:1047498. doi: 10.3389/fendo.2022.1047498. eCollection 2022. Front Endocrinol (Lausanne). 2022. PMID: 36452323 Free PMC article.
-
Thrombospondin-3 augments injury-induced cardiomyopathy by intracellular integrin inhibition and sarcolemmal instability.Nat Commun. 2019 Jan 8;10(1):76. doi: 10.1038/s41467-018-08026-8. Nat Commun. 2019. PMID: 30622267 Free PMC article.
References
-
- Reynolds LP, Redmer DA. Growth and development of the corpus luteum. J Reprod Fertil Suppl 1999; 54: 181–191. - PubMed
-
- Fraser HM, Lunn SF. Angiogenesis and its control in the female reproductive system. Br Med Bull 2000; 56: 787–797. - PubMed
-
- Berisha B, Schams D. Ovarian function in ruminants. Domest Anim Endocrinol 2005; 29: 305–317. - PubMed
-
- Schilffarth S, Berisha B. Adrenomedullin signalling in bovine corpus luteum during oestrous cycle, gravidity and induced luteolysis. Albanian Journal of Agricultural Sciences 2010; 2: 9–17.
MeSH terms
Substances
LinkOut - more resources
Full Text Sources
Other Literature Sources
Molecular Biology Databases
Research Materials
Miscellaneous