. 2016 Sep;11(5):371-380.
doi: 10.1002/cmmi.1701. Epub 2016 Jul 11.

Uptake and retention of manganese contrast agents for PET and MRI in the rodent brain

Affiliations

Uptake and retention of manganese contrast agents for PET and MRI in the rodent brain

Christina L Brunnquell et al. Contrast Media Mol Imaging. 2016 Sep.

Abstract

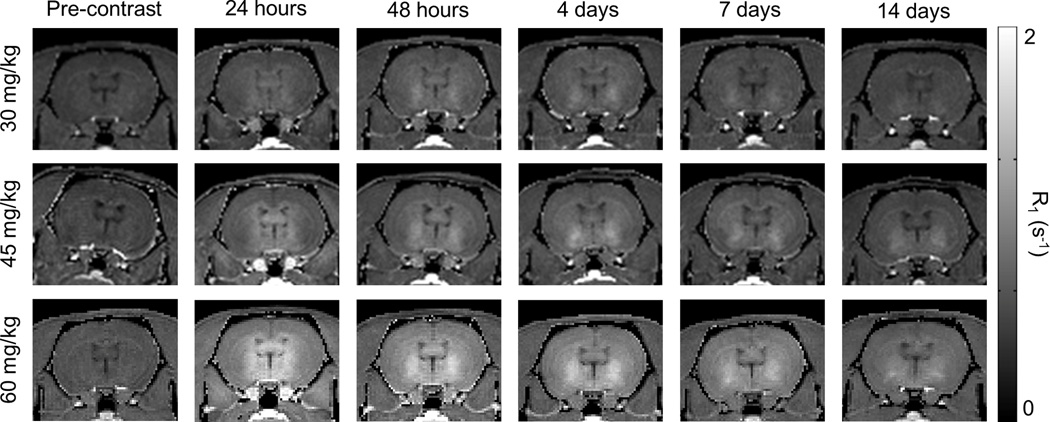
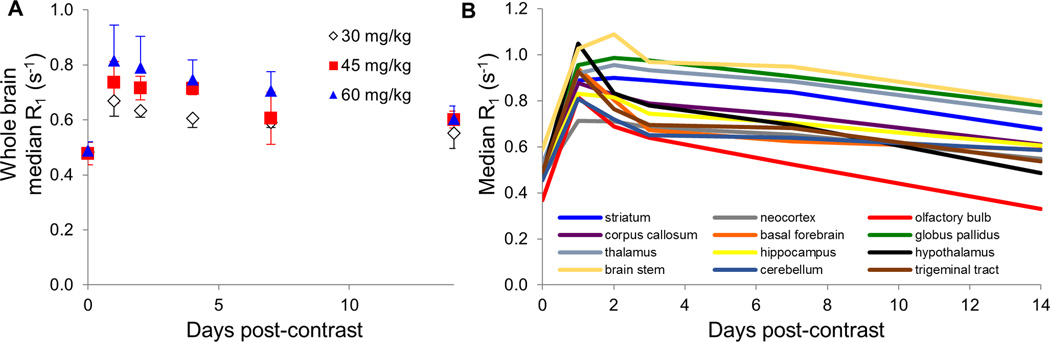
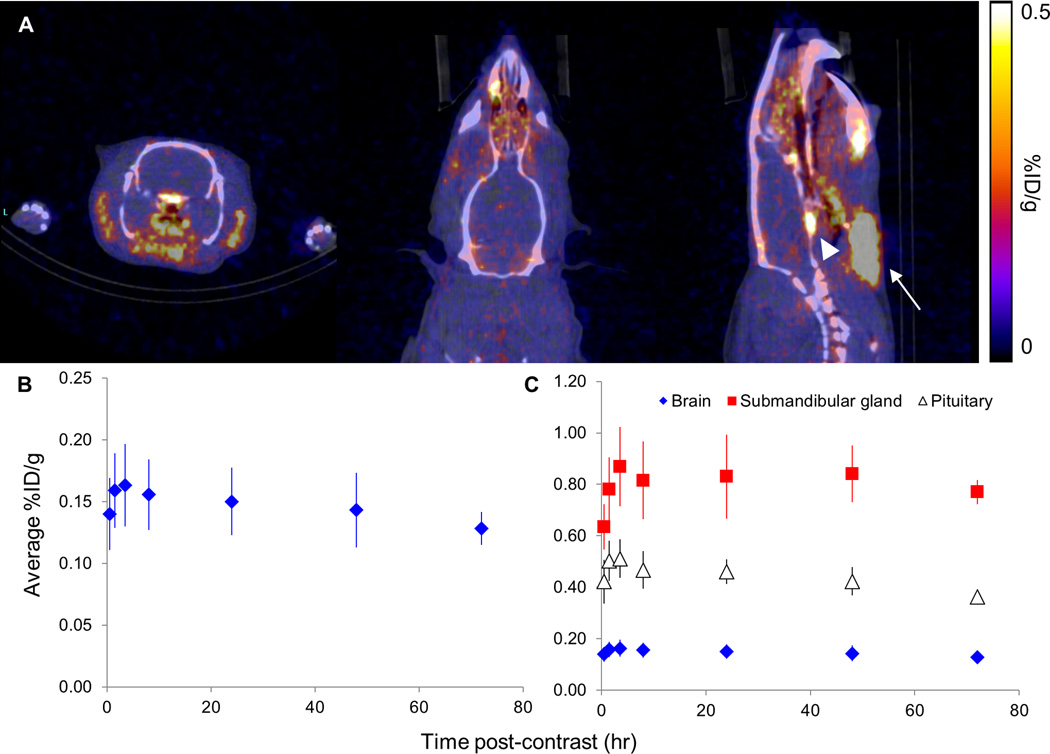
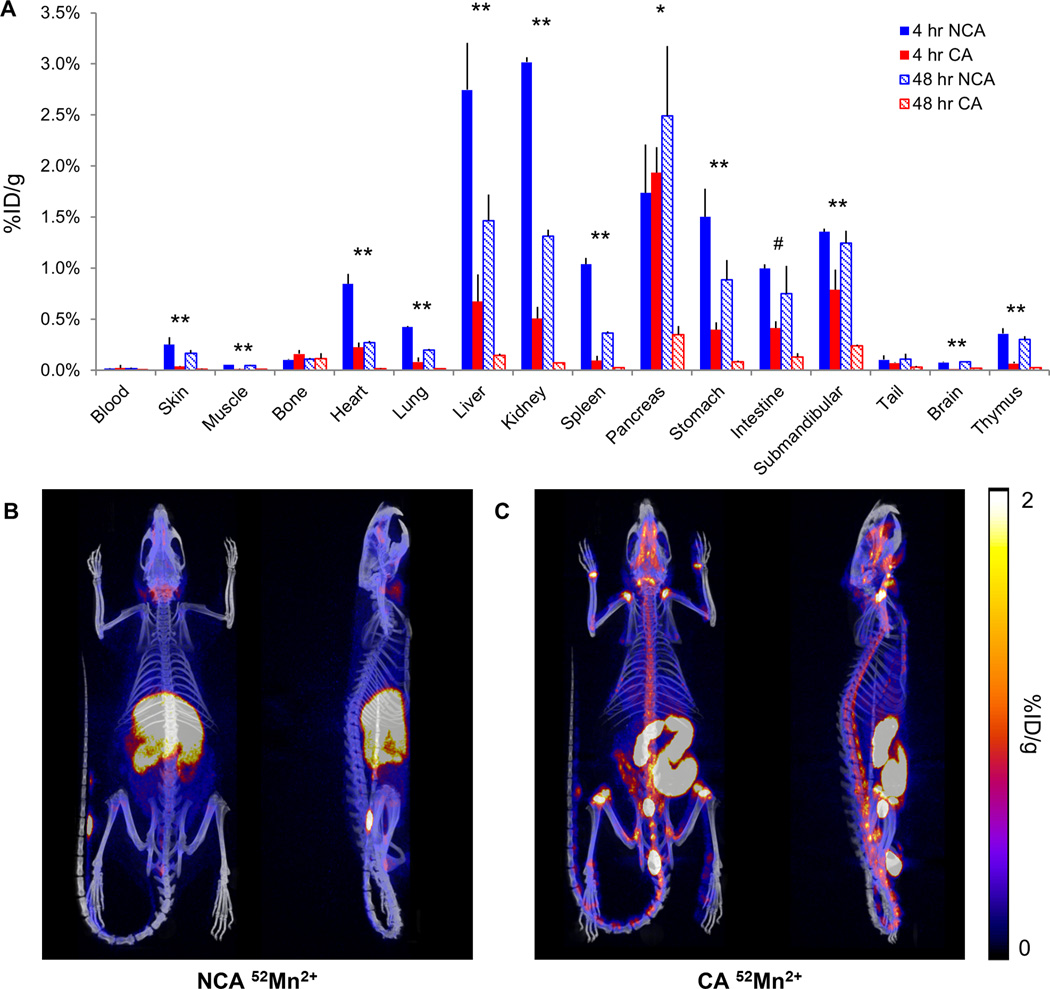
Manganese-enhanced magnetic resonance imaging (MRI) is an established neuroimaging method for signal enhancement, tract tracing, and functional studies in rodents. Along with the increasing availability of combined positron emission tomography (PET) and MRI scanners, the recent development of the positron-emitting isotope 52 Mn has prompted interest in the use of Mn2+ as a dual-modality contrast agent. In this work, we characterized and compared the uptake of systemically delivered Mn2+ and radioactive 52 Mn2+ in the rat brain for MRI and PET, respectively. Additionally, we examined the biodistribution of two formulations of 52 Mn2+ in the rat. In MRI, maximum uptake was observed one day following delivery of the highest MnCl2 dose tested (60 mg/kg), with some brain regions showing delayed maximum enhancement 2-4 days following delivery. In PET, we observed low brain uptake after systemic delivery, with a maximum of approximately 0.2% ID/g. We also studied the effect of final formulation vehicle (saline compared with MnCl2 ) on 52 Mn2+ organ biodistribution and brain uptake. We observed that the addition of bulk Mn2+ carrier to 52 Mn2+ in solution resulted in significantly reduced 52 Mn2+ uptake in the majority of organs, including the brain. These results lay the groundwork for further development of 52 Mn PET or dual Mn-enhanced PET-MR neuroimaging in rodents, and indicate several interesting potential applications of 52 Mn PET in other organs and systems. Copyright © 2016 John Wiley & Sons, Ltd.

Keywords: manganese; manganese-enhanced magnetic resonance imaging (MEMRI); neuroimaging; positron emission tomography (PET); quantitative imaging.


Figures

Figure 1
Figure 1
Representative coronal R1 maps of three subjects delivered different doses of MnCl2 (30, 45, and 60 mg/kg). Imaging was performed and R1 maps were calculated prior to contrast administration and at five imaging time points over two weeks following administration. Higher contrast dose increases signal enhancement, particularly near the ventricles. Two weeks following contrast administration, signal enhancement remains, particularly in the vicinity of the striatum and globus pallidus.
Figure 2
Figure 2
Uptake of Mn in the whole brain and various brain regions measured with quantitative MRI. (A) Whole-brain average R1 relaxation rate reached a maximum 24 hours following contrast administration regardless of contrast dose ranging from 30–60 mg/kg MnCl2. Efflux from the brain was slow, with some enhancement remaining at the 14 day imaging time point. (B) Regional analysis of uptake of 60 mg/kg MnCl2 based on registration and segmentation of brain volumes to a rat brain atlas. Some brain regions (neocortex, corpus callosum, basal forebrain, hippocampus, hypothalamus, and cerebellum) reached maximum enhancement one day following contrast administration, while others (striatum, globus pallidus, thalamus, and brain stem) in some cases reached maximum at two or four days post-contrast.
Figure 3
Figure 3
Comparison of brain uptake of no-carrier-added (NCA) and carrier-added (CA) 52Mn with ex vivo gamma counting and in vivo PET/CT. We observed higher activity uptake of NCA 52Mn in both ex vivo gamma counting measurements of the excised brain at 24 and 48 hours (A, B) as well as in vivo with PET/CT for up to 7 days following contrast delivery (C). Ex vivo measurements are the average of 3 subjects per contrast agent formulation and time point, while in vivo PET/CT was performed on one subject per contrast agent formulation in this initial comparative imaging study.
Figure 4
Figure 4
In vivo PET/CT of brain uptake of NCA 52Mn in the rat. (A) Coronal, axial, and sagittal views of the brain (left to right, respectively) from in vivo PET/CT of a rat four hours following administration of no-carrier-added (NCA) 52Mn. Submandibular gland = white arrow, pituitary = white arrowhead. (B) In four subjects, average brain uptake reached a maximum at four hours following contrast administration, after which a slow decrease in brain signal was observed. (C) High 52Mn uptake in the submandibular gland and pituitary, up to 0.869 and 0.512 %ID/g respectively, were measured at all imaging time points.
Figure 5
Figure 5
Biodistribution of no-carrier-added (NCA) and carrier-added (CA) 52Mn in the rat. (A) Ex vivo biodistribution of NCA and CA 52Mn in the rat at 4 and 48 hours following administration; N=3 per contrast agent preparation and time point. A significant increase in uptake of NCA 52Mn compared to CA 52Mn was observed at both time points in the majority of organs tested (**p<0.05). In the pancreas and intestine, this increase was only significant at one time point (*p<0.05 at four hours, #p<0.05 at 48 hours). No significant differences were observed in the blood, bone, or tail. (B–C) Representative PET/CT overlay MIPs of full-body 52Mn uptake at 24 hours following contrast delivery from one subject per contrast agent formulation. (B) In the NCA subject, uptake is observed in the submandibular glands, nasal cavities, liver, kidneys, intestine, pancreas, and spleen. (C) In the CA subject, the majority of uptake is observed in the contents of the intestine and in the vicinity of the intervertebral and synovial joints.

References

    1. Regge D, Cirillo S, Macera A, Galatola G. Mangafodipir trisodium: review of its use as an injectable contrast medium for magnetic resonance imaging. Rep Med Imaging. 2009;2:55–68.
    1. Massaad CA, Pautler RG. Manganese-enhanced magnetic resonance imaging (MEMRI) Methods Mol Biol. 2011;711:145–174. - PMC - PubMed
    1. Suero-Abreu GA, Praveen Raju G, Aristizabal O, Volkova E, Wojcinski A, Houston EJ, Pham D, Szulc KU, Colon D, Joyner AL, Turnbull DH. In vivo Mn-enhanced MRI for early tumor detection and growth rate analysis in a mouse medulloblastoma model. Neoplasia. 2014;16(12):993–1006. - PMC - PubMed
    1. Kim PJ, Mahmoudi M, Ge X, Matsuura Y, Toma I, Metzler S, Kooreman NG, Ramunas J, Holbrook C, McConnell MV, Blau H, Harnish P, Rulifson E, Yang PC. Direct evaluation of myocardial viability and stem cell engraftment demonstrates salvage of the injured myocardium. Circ Res. 2015;116(7):e40–e50. - PMC - PubMed
    1. Pan D, Caruthers SD, Senpan A, Schmieder AH, Wickline SA, Lanza GM. Revisiting an old friend: manganese-based MRI contrast agents. Wiley Interdiscip Rev Nanomed Nanobiotechnol. 2011;3(2):162–173. - PMC - PubMed

Publication types

LinkOut - more resources