. 2016 Sep:73:100-10.
doi: 10.1016/j.jaut.2016.06.015. Epub 2016 Jul 5.

Meningeal mast cell-T cell crosstalk regulates T cell encephalitogenicity

Affiliations

Meningeal mast cell-T cell crosstalk regulates T cell encephalitogenicity

Abigail E Russi et al. J Autoimmun. 2016 Sep.

Abstract

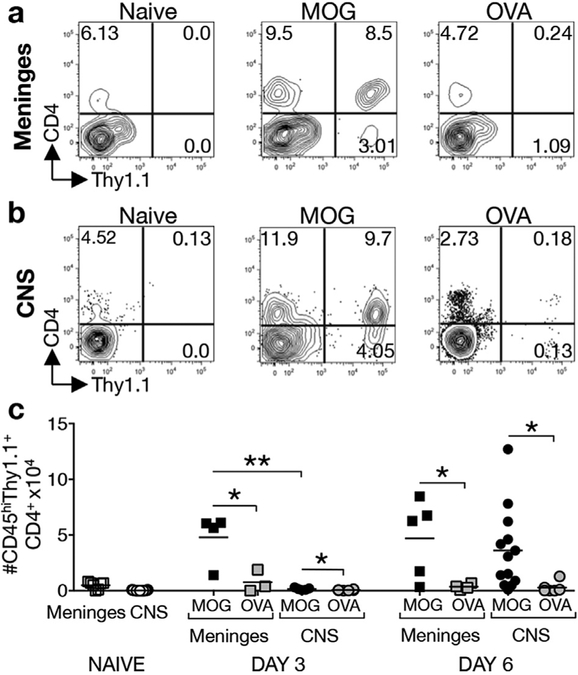
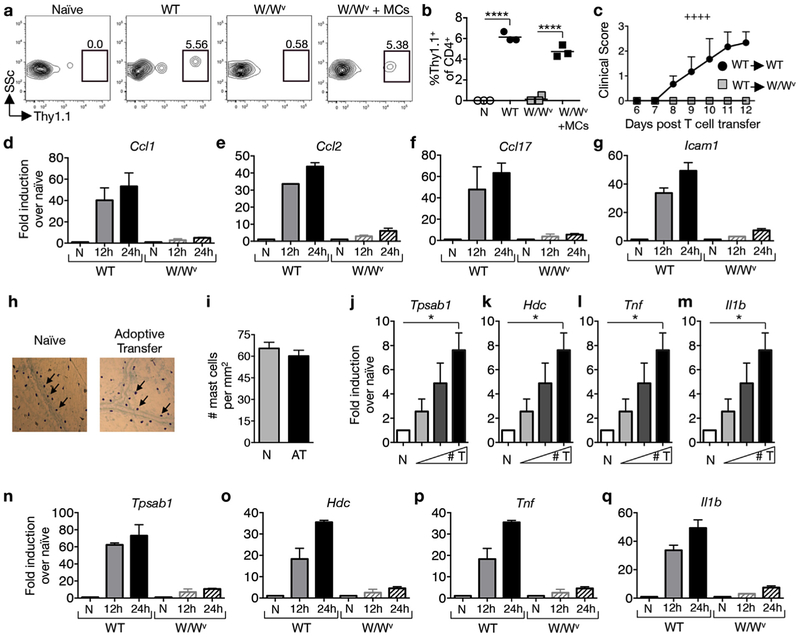
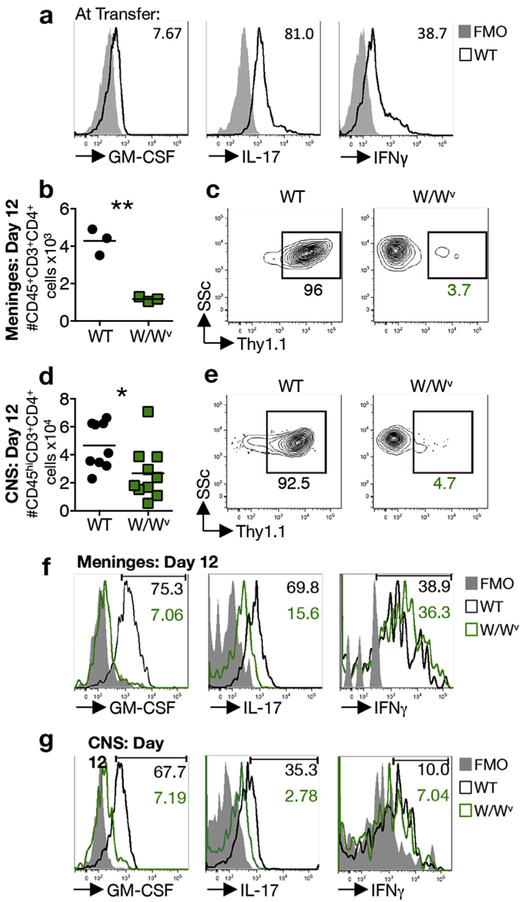
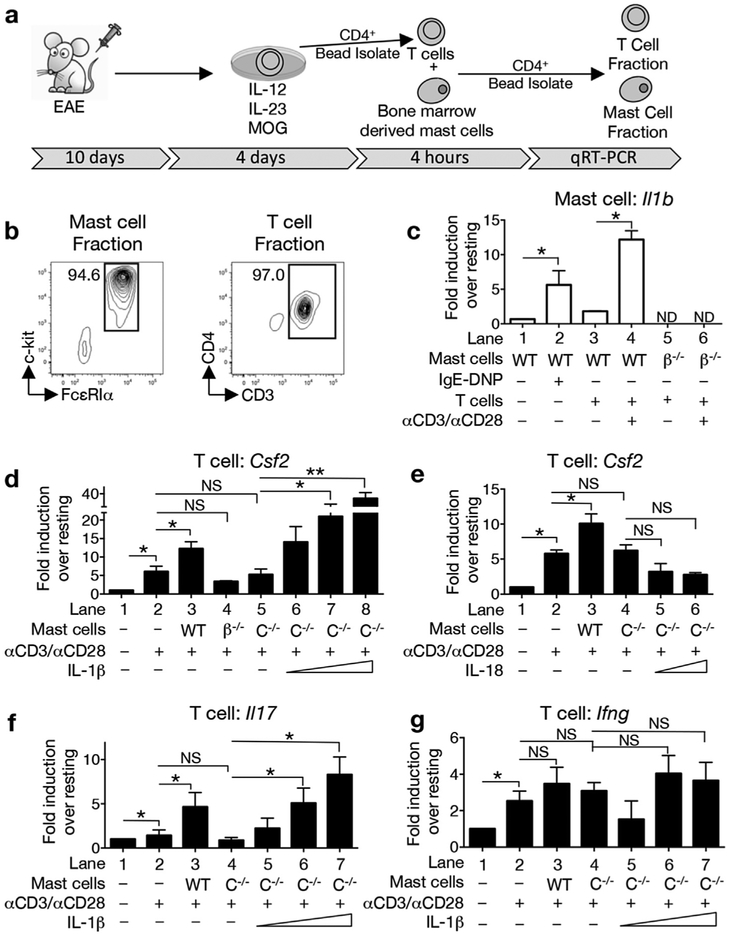
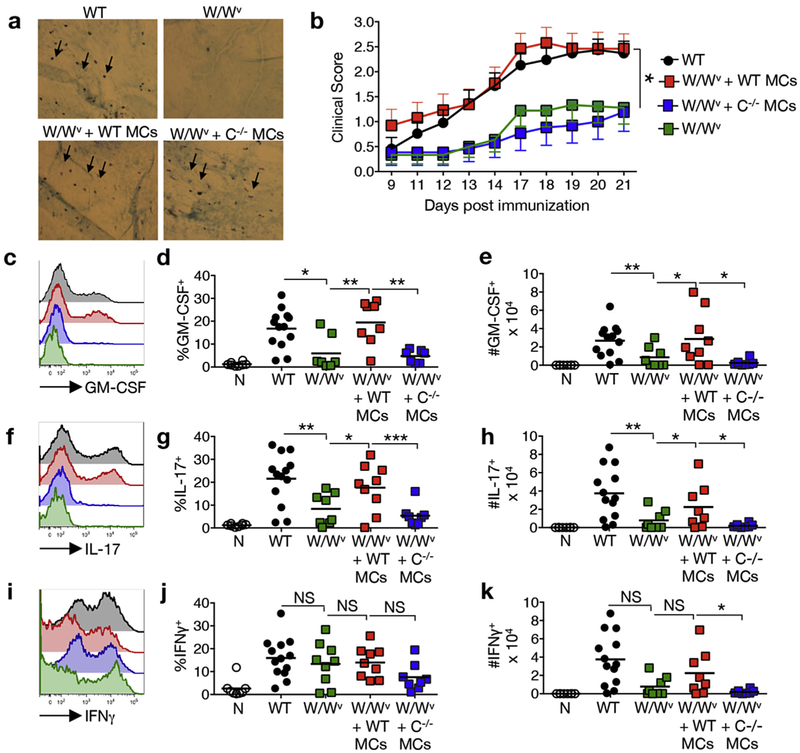
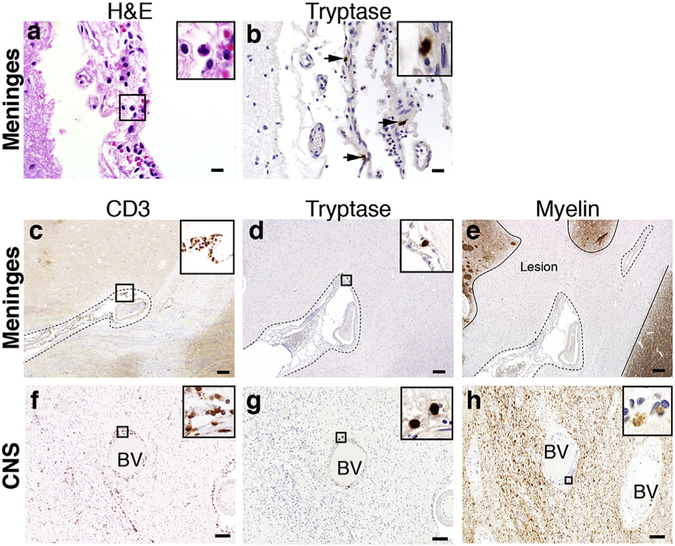
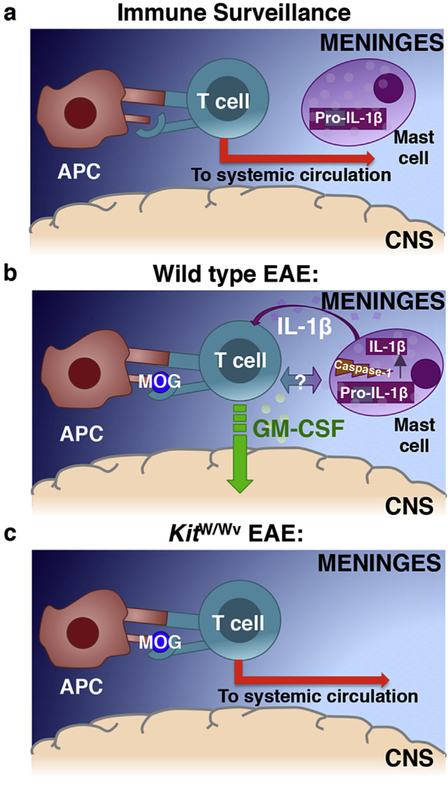
GM-CSF is a cytokine produced by T helper (Th) cells that plays an essential role in orchestrating neuroinflammation in experimental autoimmune encephalomyelitis, a rodent model of multiple sclerosis. Yet where and how Th cells acquire GM-CSF expression is unknown. In this study we identify mast cells in the meninges, tripartite tissues surrounding the brain and spinal cord, as important contributors to antigen-specific Th cell accumulation and GM-CSF expression. In the absence of mast cells, Th cells do not accumulate in the meninges nor produce GM-CSF. Mast cell-T cell co-culture experiments and selective mast cell reconstitution of the meninges of mast cell-deficient mice reveal that resident meningeal mast cells are an early source of caspase-1-dependent IL-1β that licenses Th cells to produce GM-CSF and become encephalitogenic. We also provide evidence of mast cell-T cell co-localization in the meninges and CNS of recently diagnosed acute MS patients indicating similar interactions may occur in human demyelinating disease.

Keywords: Caspase-1; Experimental autoimmune encephalomyelitis (EAE); GM-CSF; IL-1beta; Inflammasome; Mast cells; Meninges; Multiple sclerosis (MS); Myeloid cells; T cell licensing; T helper cells.


Conflict of interest statement

Conflict of interest

All authors declare that they have no conflict of interest.

Figures

Fig. 1.
Fig. 1.. MOG35–55-primed, but not OVA323–339-primed, Th cells accumulate in the meninges and CNS early in EAE.
Four x106 MOG35–55- or OVA323–339-primed T cell blasts from Thy1.1+ donor mice were restimulated with peptide in vitro and transferred to congenic Thy1.2+ recipients. The frequency and numbers of Thy1.1+CD45+CD4+ cells in the meninges (a,c) and CNS (b,c) was determined 3 or 6 days post transfer. (a) Representative analysis of MOG35–55 or OVA323–339-primed CD4+Thy1.1+ T cells detected in the pooled meninges of Thy1.2+ recipients at day 6 post transfer. (b) Representative analysis of MOG35–55 or OVA323–339-primed CD4+Thy1.1+ T cells detected in the CNS (pooled brain and spinal cord) of Thy1.2+ recipients 6 days post transfer. Percentages of the CD45+/hi parent gate are shown. (c) Numbers of CD45+CD4+Thy1.1+ MOG35–55 or OVA323–339-primed T cells in the meninges and CNS at indicated days post T cell transfer. For meninges samples, each point represents the analysis of a pool of tissues from 3 to 5 mice and is expressed as numbers/mouse. CNS data points represent the analysis of individual mice. *p < 0.05 and **p < 0.01 by Student’s t-Test. 4 independent experiments.
Fig. 2.
Fig. 2.
Mast cells are activated by T cell transfer and regulate the accumulation of myelin-specific Th cells in the meninges. MOG35–55-primed T cells from Thy1.1+ mice were reactivated with MOG35–55 peptide in vitro for 4 days before transfer of 4 × 10⁶ blasts to Thy1.2+ wild type (WT), mast cell-deficient KitW/Wv (W/Wv), or meningeal mast cell reconstituted KitW/Wv (W/Wv + MCs) recipients. (a) Representative flow cytometric analysis of Thy1.1+ CD4+ T cell infiltration in the meninges 24 h post transfer. Numbers represent percentage of CD45+CD4+ cells that are Thy1.1+.(b) Frequencies of Thy1.1+ T cells detected in the meninges of indicated recipients. Each data point represents the analysis of pooled meningeal tissue from 4 mice. ****p < 0.0001 by Student’s t-Test. (c) Clinical scores of WT and KitW/Wv recipients after adoptive transfer of 4 × 10⁶ WT T cell blasts. ++++p < 0.0001 by two way ANOVA. 2 independent experiments using 4 mice each. (d–g) RT-PCR analyses of pooled meninges tissues from WT and W/Wv recipient mice at indicated time points. The expression of indicated genes was determined relative to Hprt and expressed as fold induction over naïve. n = 2 pooled samples of 5 mice each for each time point. 2 independent experiments. (h) Meningeal mast cells identified by toluidine blue staining and (i) mast cell numbers in naïve (N) and T cell recipient mice (AT) at 24 h post transfer, n = 9 mice. (j–m) RT-PCR analysis of pooled meninges samples as described in (d–g) 24 h after transfer of T cell blasts [0 (N), 2, 4, and 8 × 10⁶] to wild type recipients. *p < 0.05 by Student’s t-Test. n = 4 per group, 2 independent experiments. (n–q) RT-PCR analyses of pooled meninges as described in (d–g). n = 2 pooled samples of 5 mice for each time point. 2 independent experiments. All values are expressed as mean ± SEM.
Fig. 3.
Fig. 3.
Robust GM-CSF production by Th cells is acquired post priming in wild type, but not KitW/Wv mice. (a) Representative analysis of cytokine production by MOG35–55 eprimed wild type donor T cell blasts prior to adoptive transfer. Numbers denote frequency of cytokine-expressing CD3+CD4+ blast cells and are representative of 3 independent experiments. (b) Accumulation of CD45+CD3+CD4+ T cells in the meninges at day 12 post transfer of 4 × 10⁶ Thy1.1+ T blasts to wild type (WT) and KitW/Wv (W/Wv) recipients. Each data point represents analysis of meningeal tissue pooled from 3 mice and is expressed as average cell number per mouse. 3 independent experiments. **p < 0.01 by Student’s t-Test. (c) Representative analysis showing the frequency of Thy1.1+ T cells of the CD45+CD3+CD4+ population in the meninges of indicated recipients at day 12 post T cell transfer. (d) Accumulation of CD45hiCD3+CD4+ T cells in the CNS of indicated recipients at day 12 post T cell transfer. Each data point represents analysis of pooled brain and spinal cord tissue from one mouse, 3 independent experiments. *p < 0.05 by Student’s t-Test. (e) Representative analysis showing the frequency of Thy1.1+ T cells of the CD45hiCD3+CD4+ population in the CNS of indicated recipients. (f) Representative analysis of cytokine production by CD45+CD3+CD4+ Th cells in the meninges of pooled samples from 4 mice at day 12 post transfer of T cell blasts. Numbers denote frequency of cytokine expressing CD45+CD3+CD4+ cells in WT (black) and W/Wv (green) meninges. (g) Representative analysis of cytokine production by CD45hiCD3+CD4+ T cells in the CNS of indicated recipients at day 12 post transfer of T blasts. (For interpretation of the references to colour in this figure legend, the reader is referred to the web version of this article.)
Fig. 4.
Fig. 4.
Mast cell-derived, caspase-1-dependent IL-1β directly augments GM-CSF production by Th cells. (a) Lymph node cells from MOG35–55- immunized donor mice were collected at day 10 post immunization and cultured with MOG35–55 peptide under Th1/Th17 polarizing conditions for 4 days. T cells were isolated using CD4+ magnetic beads and then co-cultured under various conditions with bone marrow-derived mast cells. After 4 h, CD4+ magnetic beads were used to separate the T and mast cell fractions, which were then assessed for gene expression by quantitative real time PCR. (b) Representative FACs analysis showing the purity of each fraction. The percentage of c-kit+FcεRIα+ or CD3+CD4+ cells is shown. Data is representative of 4 independent experiments. (c) Il1b expression by WT and Il1b −/−−/−) mast cells was analyzed in the presence or absence of Th cells. ND-not detected. (d, e) Csf2 induction by resting or reactivated (αCD3 and αCD28) Th cells in the absence of mast cells or in the presence of WT, β−/−, or Casp1−/−(C−/−) mast cells. (d) Exogenous IL-1β (2, 10, and 50 ng/ml) or (e) IL-18 (2 and 50 ng/ml) was added to the Casp1/− mast cell: T cell co-cultures. (f,g) Induction of Il17 and Ifng by Th cells co-cultured with WT or C−/− mast cells. Gene expression is relative to Hprt and expressed as fold induction over resting cells. *p < 0.05 and **p < 0.01 by Student’s t-Test. n = 2 independent cultures for panel (e) and n = 4 for remaining panels (c,d,f,g). All values are expressed as mean ± SEM.
Fig. 5.
Fig. 5.
Meningeal mast cell-derived caspase-1 is necessary for EAE development and Th cell encephalitogenicity in the CNS. The meninges of naïve KitW/Wv mice were selectively reconstituted with wild type (W/Wv + WT MCs) or Casp1−/−(W/Wv + C−/− MCs) bone marrow-derived mast cells. (a) Reconstitution was confirmed in a subset of mice by toluidine blue staining of the calvarial dura mater. Arrows denote toluidine blue-positive mast cells. (b) Eight weeks post reconstitution, EAE was induced by MOG35–55 peptide immunization and the disease course was compared to non-reconstituted controls. *p < 0.05 by 2-way ANOVA. n ≥ 12 for each group. 4 independent experiments. Data points are expressed as mean ± SEM. (c–k) Twelve days post immunization, CNS infiltrating leukocytes were isolated from a subset of the immunized mice and analyzed by flow cytometry. Representative analyses of GM-CSF (c), IL-17 (f), and IFNγ (i) production by CD45hiCD3+CD4+ cells are shown. FMO negative controls were used to set gates. Histogram colors correspond to experimental groups designated in (b). (d,g,j) Frequency and (e,h,k) numbers of CD45hi CD3+CD4+ cells that express cytokines *p < 0.05, **p < 0.01, and ***p < 0.001 by Student’s t-test. n ≥ 8 for each group, 3 independent experiments.
Fig. 6.
Fig. 6.
Mast cell-T cell co-localization in the meninges and CNS of acute MS patients. (a) H&E staining shows brain-associated meningeal granulocyte infiltration in an acute MS autopsy case. (b) Immunohistochemistry analysis of tryptase positive mast cells (arrows) present within the meninges of the same case. (c) Immunohistochemistry analysis of CD3+ T cells identified in the meninges (designated by dashed outline) of a brain sulcus of an acute MS autopsy case. (d) Immunohistochemistry analysis of tryptase positive mast cells on a consecutive section of (c) reveals mast cells and T cells co-localized in the meninges. (e) Myelin PLP staining on a consecutive section of (c,d), shows subpial cortical demyelination associated with meningeal inflammation. Lesion borders are designated by a solid line. (f) Immunohistochemistry analysis of infiltrating perivascular CD3+ T cells identified in the CNS parenchyma of an acute MS autopsy case. BV = blood vessel. (g) Immunohistochemistry analysis of perivascular tryptase positive mast cells identified in a consecutive section of (f) shows mast cell-T cell co-localization within an active demyelinating lesion. (h) Myelin CNPase staining of consecutive sections of (f,g) within the CNS parenchyma shows myelin debris within macrophages suggesting early demyelinating activity. Enlarged views shown in panel insets. Scale bars in A–B: 20 μm, C–E: 200 μm, F–H: 100 μm.
Fig. 7.
Fig. 7.
A Model: Meningeal mast cell derived, inflammasome-dependent, IL-1β is necessary for T cell encephalitogenicity and infiltration into the CNS. (a) During physiological immune surveillance, T cells transit through the meninges. Under steady-state conditions, the surveying T cells do not interact with resident antigen presenting cells in the meninges and instead re-enter systemic circulation. (b) In EAE/MS, autoreactive transiting T cells interact with cognate antigen presenting cells. Activated T cells also interact with and activate mast cells resulting in caspase-1-dependent cleavage of pro-IL-1β to its mature form. Upon release, mast cell-derived IL-1β licenses T cells to produce GM-CSF and become encephalitogenic. (c) In the absence of meningeal mast cells (KitW/Wv mice), mast cell: T cell interactions are nonexistent, resulting in decreased GM-CSF production by transiting T cells, less efficient CNS-entry of T cells and other cells and reduced clinical disease severity.

References

    1. Hauser SL, Oksenberg JR, The neurobiology of multiple sclerosis: genes, inflammation, and neurodegeneration, Neuron 52 (2006) 61–76. - PubMed
    1. Nylander A, Hafler DA, Multiple sclerosis J Clin. Investig 122 (2012) 1180–1188. - PMC - PubMed
    1. Odoardi F, Sie C, Streyl K, Ulaganathan VK, Schlager C, Lodygin D, et al., T cells become licensed in the lung to enter the central nervous system, Nature 488 (2012) 675–679. - PubMed
    1. Berer K, Mues M, Koutrolos M, Rasbi ZA, Boziki M, Johner C, et al., Commensal microbiota and myelin autoantigen cooperate to trigger autoimmune demyelination, Nature 479 (2011) 538–541. - PubMed
    1. Ransohoff RM, Immunology: licensed in the lungs, Nature 488 (2012) 595–596. - PubMed

Publication types

MeSH terms

Substances