. 2016 Oct;10(8):1266-82.
doi: 10.1016/j.molonc.2016.06.003. Epub 2016 Jun 26.

SNHG16 is regulated by the Wnt pathway in colorectal cancer and affects genes involved in lipid metabolism

Affiliations

SNHG16 is regulated by the Wnt pathway in colorectal cancer and affects genes involved in lipid metabolism

Lise Lotte Christensen et al. Mol Oncol. 2016 Oct.

Abstract

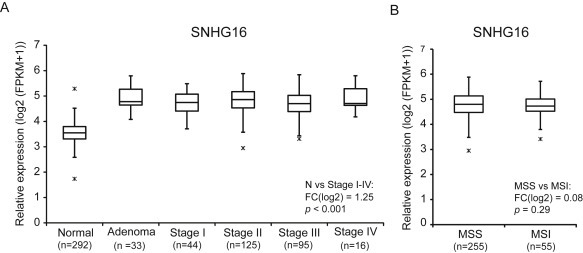
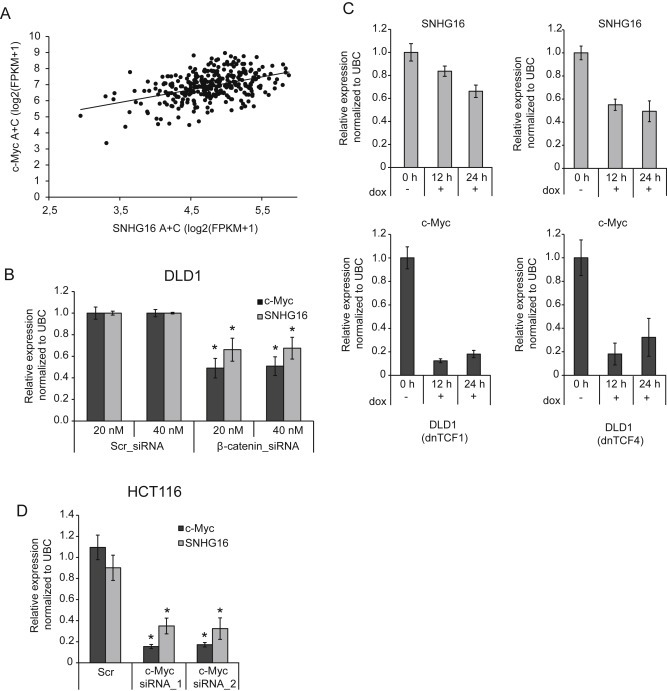
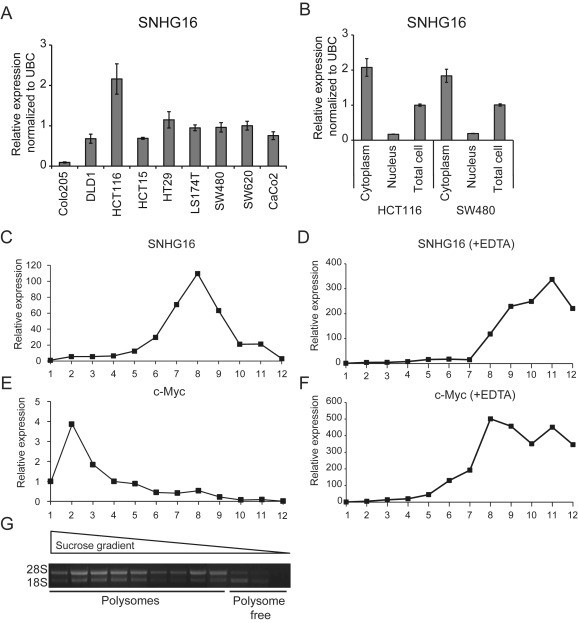
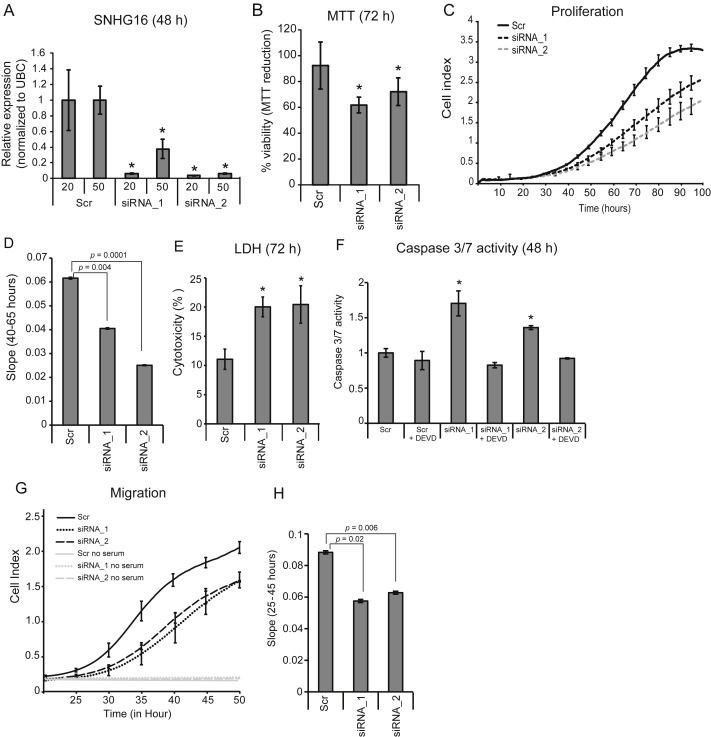
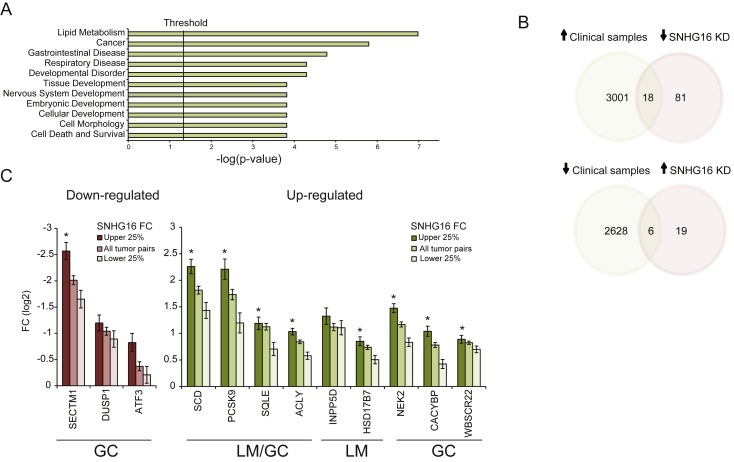
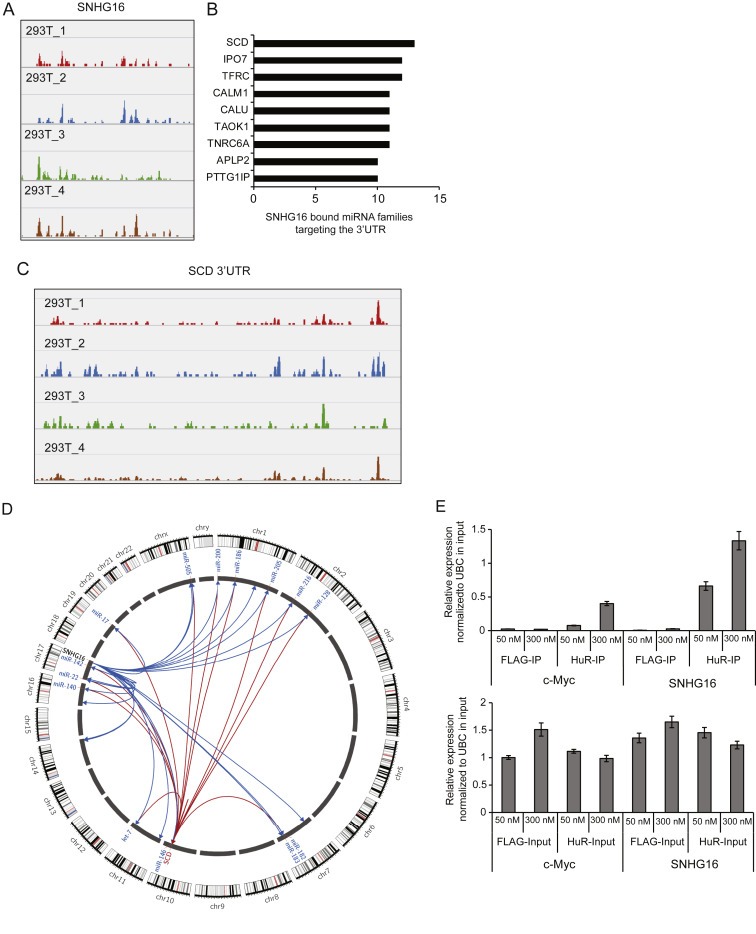
It is well established that lncRNAs are aberrantly expressed in cancer where they have been shown to act as oncogenes or tumor suppressors. RNA profiling of 314 colorectal adenomas/adenocarcinomas and 292 adjacent normal colon mucosa samples using RNA-sequencing demonstrated that the snoRNA host gene 16 (SNHG16) is significantly up-regulated in adenomas and all stages of CRC. SNHG16 expression was positively correlated to the expression of Wnt-regulated transcription factors, including ASCL2, ETS2, and c-Myc. In vitro abrogation of Wnt signaling in CRC cells reduced the expression of SNHG16 indicating that SNHG16 is regulated by the Wnt pathway. Silencing of SNHG16 resulted in reduced viability, increased apoptotic cell death and impaired cell migration. The SNHG16 silencing particularly affected expression of genes involved in lipid metabolism. A connection between SNHG16 and genes involved in lipid metabolism was also observed in clinical tumors. Argonaute CrossLinking and ImmunoPrecipitation (AGO-CLIP) demonstrated that SNHG16 heavily binds AGO and has 27 AGO/miRNA target sites along its length, indicating that SNHG16 may act as a competing endogenous RNA (ceRNA) "sponging" miRNAs off their cognate targets. Most interestingly, half of the miRNA families with high confidence targets on SNHG16 also target the 3'UTR of Stearoyl-CoA Desaturase (SCD). SCD is involved in lipid metabolism and is down-regulated upon SNHG16 silencing. In conclusion, up-regulation of SNHG16 is a frequent event in CRC, likely caused by deregulated Wnt signaling. In vitro analyses demonstrate that SNHG16 may play an oncogenic role in CRC and that it affects genes involved in lipid metabolism, possible through ceRNA related mechanisms.

Keywords: AGO-CLIP; Colorectal cancer; Functional analyses; Long non-coding RNAs; SNHG16; Wnt pathway.


Figures

Figure 1
Figure 1
SNHG16 expression in CRC (largeRNAseq cohort). Expression was up‐regulated in adenomas and all stages of adenocarcinomas when compared to normal colorectal mucosa (A). Equal expression in microsatellite stable (MSS) and unstable (MSI) colorectal cancers (B).
Figure 2
Figure 2
SNHG16 expression is regulated by the Wnt signaling pathway. Correlation of c‐Myc and SNHG16 expression in CRC (largeRNAseq cohort) (n = 314). Spearman's ρ = 0.4, p < 0.05 (A). SNHG16 expression in DLD1 cells transfected with 20 or 40 nm Scr or β‐catenin siRNA, quantified by RT‐qPCR. As a positive control of Wnt‐inactivation the well‐known Wnt target c‐Myc was also quantified (B). The expression of dnTCF1 or dnTCF4 was induced by doxycycline (dox) in stably transfected DLD1 cells. The SNHG16 expression was measured at different time points using RT‐qPCR. c‐Myc was included as a positive control (C). Expression analysis of SNHG16 and c‐Myc in HCT116 cells transfected with 50 nM of c‐Myc siRNAs or Scr (RT‐qPCR) (D). Data are presented as ±sd. of three biological replicates, *p < 0.05 (B–D).
Figure 3
Figure 3
Expression analysis of SNHG16 in CRC cell lines and in polysome fractions. Expression of SNHG16 in nine CRC cell lines (RT‐qPCR). The results are presented as ±sd. of three biological replicates (A). Expression of SNHG16 in fractionated HCT116 and SW480 cells. The cells were fractionated into cytoplasmic and nuclear fractions followed by RT‐qPCR analyses. The data are presented as the relative expression in the nuclear/cytoplasmic fractions normalized to the expression in unfractionated cells (total cells). The experiment was repeated twice and the result of one representative experiment ±sd. is shown (B). The polysome profile of SNHG16 (C) and c‐Myc (positive control of polysome association) (D) was determined by isolation of RNA from each fraction collected from a 10–56% sucrose gradient. An EDTA release experiment, abrogating binding between RNAs and polysomes, was also performed (E–F). The relative expression of SNHG16 and c‐Myc was determined by RT‐qPCR. The result from one representative experiment is shown (C–F) Polysome fractions were identified by running RNA isolated from each fraction on an agarose gel to determine the 28S/18S rRNA ratios (G).
Figure 4
Figure 4
Knockdown of SNHG16 suppresses growth, increases cellular death and decreases migration in vitro. The relative expression of SNHG16 RNA in HCT116 cells transfected with SNHG16 siRNA_1 or siRNA_2. The siRNAs were used in two concentrations (20 and 50 nM) and the cells were harvested after 48 h. Shown are the mean of 3 biological replicates ± sd. *p < 0.05 when compared to Scr (A). The effect of SNHG16 knockdown on the viability HCT116 cells (MTT assay). Data are presented as the mean of at least 3 independent experiments ±sd., each with three biological replicates and normalized to Scr. *p < 0.05 (B). Real‐time monitoring of cell proliferation following SNHG16 knockdown using an xCELLigence instrument. The cell index from time 0–100 h is shown (C). Following the real‐time monitoring in C, the slope (rate of changes in cell index) was calculated from 40 to 65 h (i.e. when changes in proliferation were apparent) and presented graphically (D). The effect of SNHG16 knockdown on cellular death (LDH release assay) in HCT116 cells. The cellular death is expressed as percentage of released LDH out of total cellular LDH. At least two independent experiments were carried out and performed in triplicates. The result of one representative experiment ±sd. is shown. *p < 0.05 (E). Induction of apoptosis (Caspase 3/7 activity) in the lysate of siRNA transfected cells was examined by fluorometric kinetic analysis and expressed relative to the Caspase 3/7 activity in “Scr” transfected cells. The Caspase inhibitor Z‐DEVD‐fmk (DEVD) was added to the cells six hours post‐transfection. Data are presented as ±sd. of at least 2 independent experiments each with three biological replicates. *p < 0.05 (F). Real‐time monitoring of cell migration of HCT116 cells transfected with siRNA was performed using an xCELLigence instrument. The cell index from time 20–50 h is shown (G). Following the real‐time monitoring in G, the slope (rate of changes in cell index) was calculated from 25 to 45 h (i.e. when changes in migration were apparent) and presented graphically (H).
Figure 5
Figure 5
Ingenuity Pathway Analysis and identification of clinical SNHG16 targets. Ingenuity Pathway Analysis (IPA) was performed to investigate if particular diseases and biological functions were associated with the 124 genes significantly dysregulated upon SNHG16 siRNA knockdown. The top three enriched features were lipid metabolism, cancer, and gastrointestinal diseases (A). Venn diagrams showing the number of overlapping differentially expressed genes between clinical samples and siRNA transfected cells (p < 0.05, FC(log2) < −0.5 or >0.5). Upper diagram: significantly up‐regulated in the clinical samples and down‐regulated as a result of SNHG16 knockdown. Lower diagram: significantly down‐regulated in the clinical samples and up‐regulated as a result of SNHG16 knockdown. KD: knockdown (B). Overall FC of lipid and gastrointestinal cancer genes in all tumor pairs (n = 290) (adenomas/adenocarcinomas compared to matched normal colon mucosa) and in the pairs with high (25% upper quartile, n = 73) or low (25% lower quartile, n = 73) SNHG16 FCs. Left diagram (red bars): down‐regulated genes and right diagram (green bars): up‐regulated genes. LM: lipid metabolism, GC: gastrointestinal cancer. Data are presented as mean FC ± standard error of the mean. *Significant difference between the FCs in the 25% upper quartile compared to the FCs in the 25% lower quartile (p < 0.05) (C).
Figure 6
Figure 6
AGO‐CLIP binding analysis and HuR‐IP. SNHG16 AGO loading in 293T cells (shown are representative data from four individual AGO‐CLIP analyses) (A). The 3′UTR of multiple mRNA transcripts are heavily co‐targeted by miRNAs predicted as binding to SNHG16 in AGO‐CLIP data from 293T cells (B). The SCD mRNA has multiple CLIP defined miRNA binding sites along its 3′UTR (C). Circos plot depicting SNHG16 and SCD interaction with its CLIP predicted miRNA targets. SNHG16‐miRNA interactions are represented as blue links and miRNA‐SCD interactions are represented as red links. Representative members of miRNA families targeting SCD are labeled. Half of the miRNA families predicted to bind SNHG16 co‐target the SCD 3′UTR (D). HuR‐IP from HCT116 cell lysates (IP) followed by SNHG16 or c‐Myc (positive control) expression analysis using RT‐qPCR (upper panel). As a control SNHG16 and c‐Myc expression was also measured in the cell lysates used as input (lower panel). Immunoprecipitation with a FLAG antibody was used as negative control. The experiment was repeated twice and the result of one representative experiment ± sd. is shown (E).

References

    1. Atienza, J.M. , Yu, N. , Kirstein, S.L. , Xi, B. , Wang, X. , Xu, X. , Abassi, Y.A. , 2006. Dynamic and label-free cell-based assays using the real-time cell electronic sensing system. Assay. Drug Dev. Technol. 4, 597–607. - PubMed
    1. Baenke, F. , Peck, B. , Miess, H. , Schulze, A. , 2013. Hooked on fat: the role of lipid synthesis in cancer metabolism and tumour development. Dis. Model. Mech. 6, 1353–1363. - PMC - PubMed
    1. Bazzini, A.A. , Johnstone, T.G. , Christiano, R. , Mackowiak, S.D. , Obermayer, B. , Fleming, E.S. , Vejnar, C.E. , Lee, M.T. , Rajewsky, N. , Walther, T.C. , Giraldez, A.J. , 2014. Identification of small ORFs in vertebrates using ribosome footprinting and evolutionary conservation. EMBO J. 33, 981–993. - PMC - PubMed
    1. Birmingham, A. , Anderson, E.M. , Reynolds, A. , Ilsley-Tyree, D. , Leake, D. , Fedorov, Y. , Baskerville, S. , Maksimova, E. , Robinson, K. , Karpilow, J. , Marshall, W.S. , Khvorova, A. , 2006. 3′ UTR seed matches, but not overall identity, are associated with RNAi off-targets. Nat. Methods 3, 199–204. - PubMed
    1. Carlevaro-Fita, J. , Rahim, A. , Guigo, R. , Vardy, L.A. , Johnson, R. , June 2016. Cytoplasmic long noncoding RNAs are frequently bound to and degraded at ribosomes in human cells. RNA 22, 867–882. - PMC - PubMed

Publication types

MeSH terms