. 2016 Jul 21;63(2):240-248.
doi: 10.1016/j.molcel.2016.05.040. Epub 2016 Jul 7.

Redox Nanodomains Are Induced by and Control Calcium Signaling at the ER-Mitochondrial Interface

Affiliations

Redox Nanodomains Are Induced by and Control Calcium Signaling at the ER-Mitochondrial Interface

David M Booth et al. Mol Cell. .

Abstract

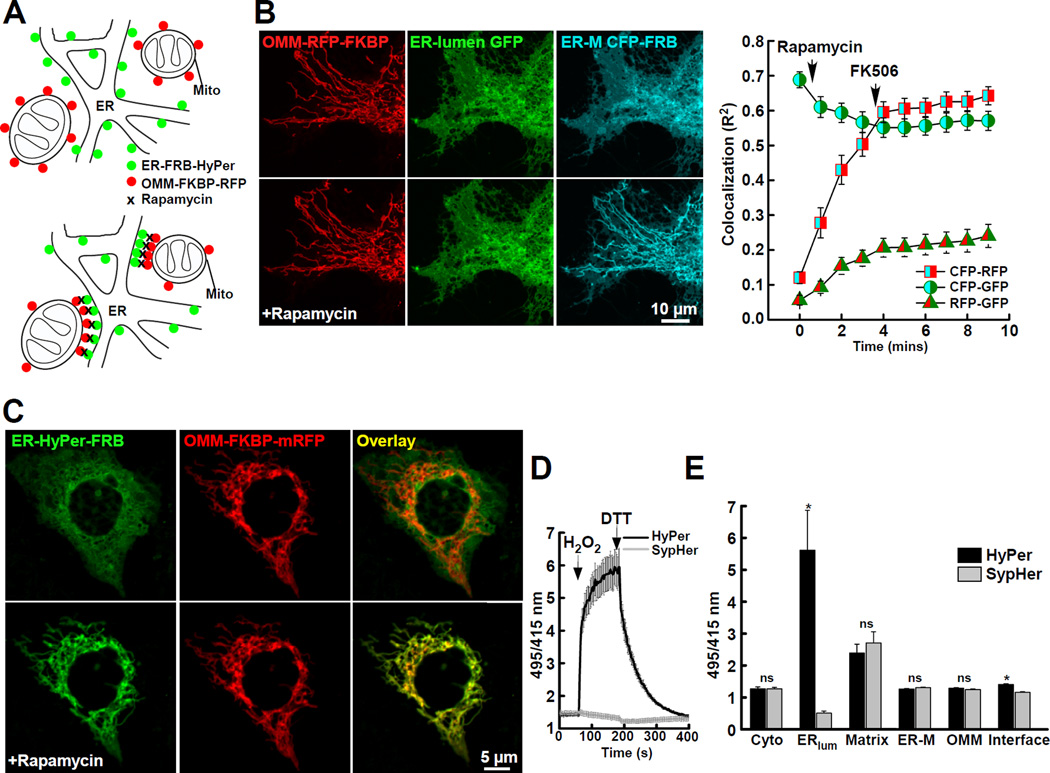
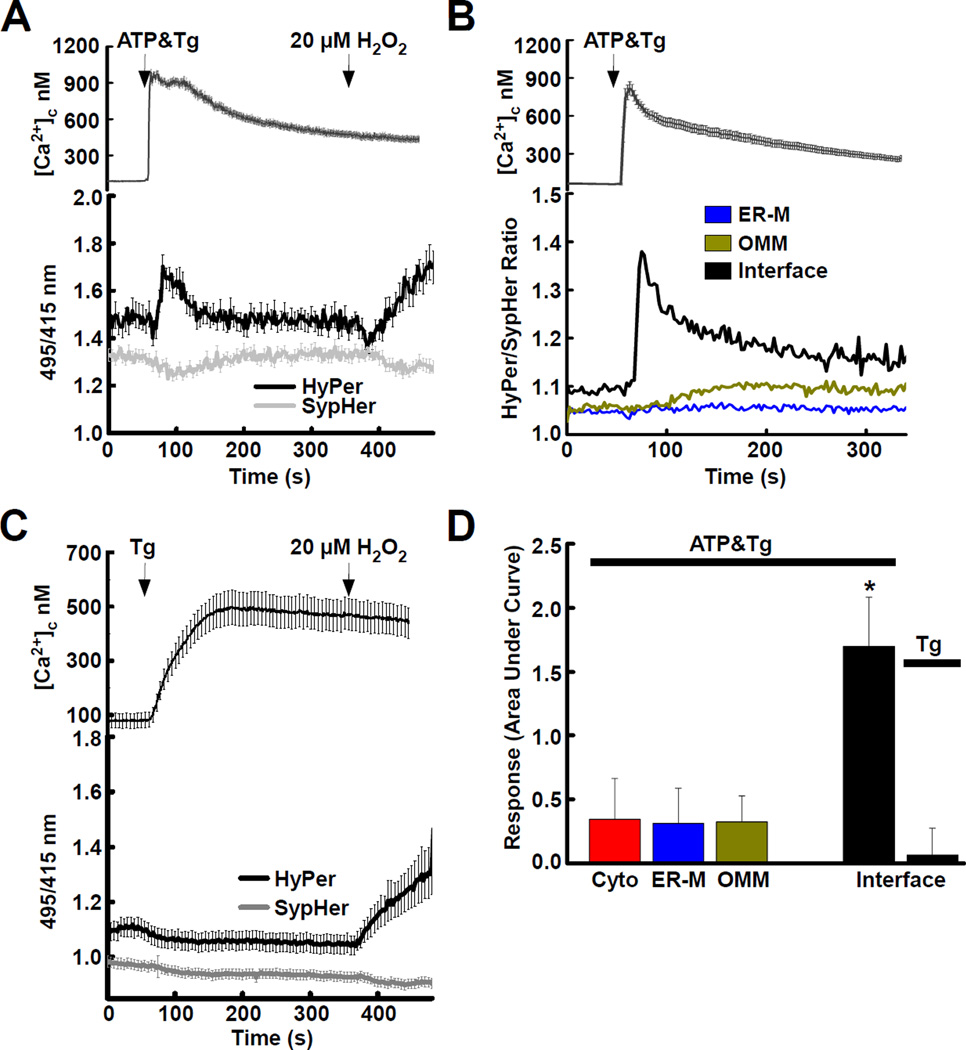
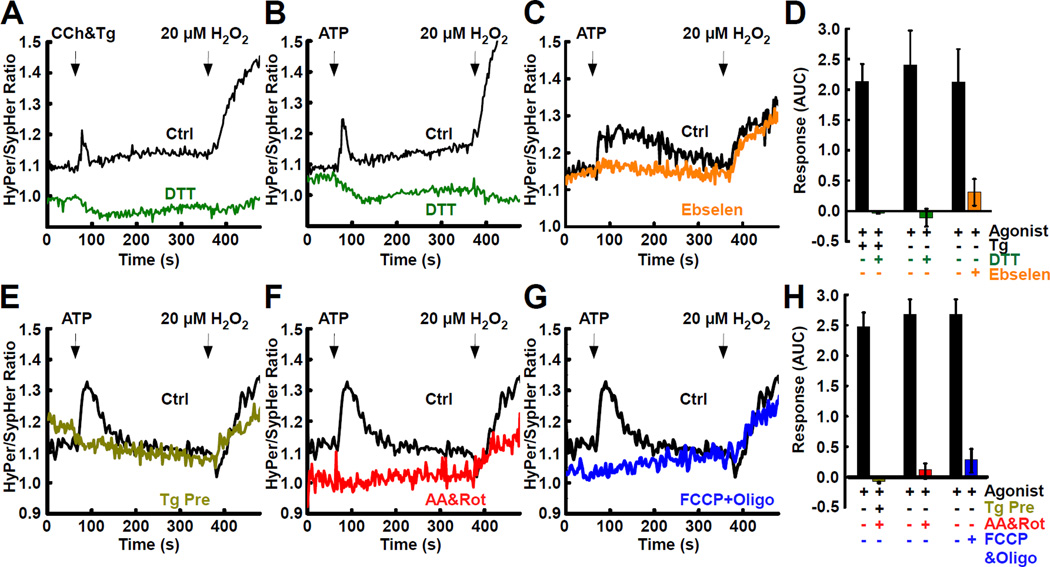
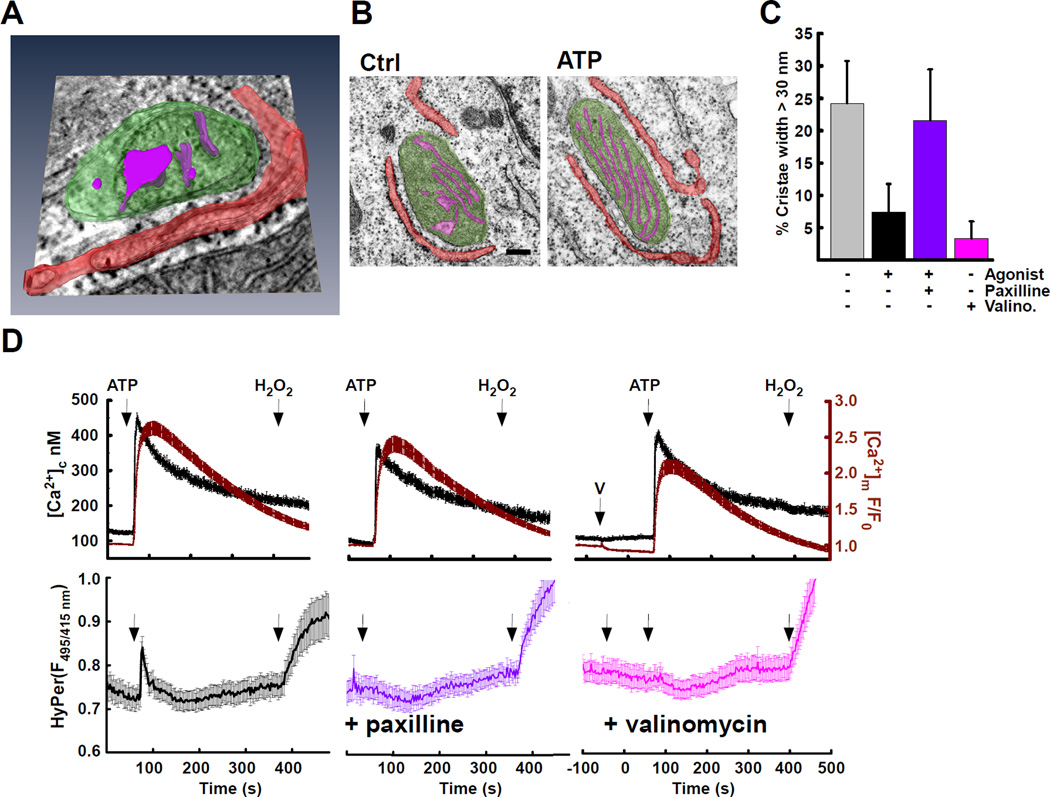
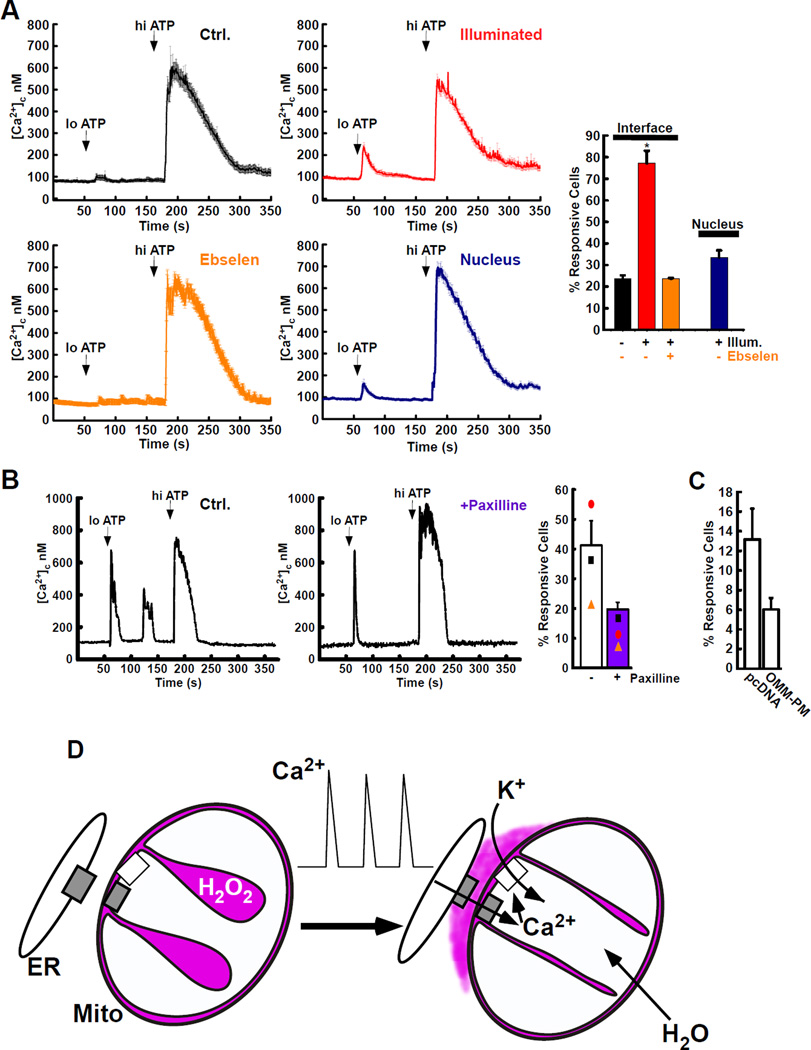
The ER-mitochondrial interface is central to calcium signaling, organellar dynamics, and lipid biosynthesis. The ER and mitochondrial membranes also host sources and targets of reactive oxygen species (ROS), but their local dynamics and relevance remained elusive since measurement and perturbation of ROS at the organellar interface has proven difficult. Employing drug-inducible synthetic ER-mitochondrial linkers, we overcame this problem and demonstrate that the ER-mitochondrial interface hosts a nanodomain of H2O2, which is induced by cytoplasmic [Ca(2+)] spikes and exerts a positive feedback on calcium oscillations. H2O2 nanodomains originate from the mitochondrial cristae, which are compressed upon calcium signal propagation to the mitochondria, likely due to Ca(2+)-induced K(+) and concomitant water influx to the matrix. Thus, ER-mitochondrial H2O2 nanodomains represent a component of inter-organelle communication, regulating calcium signaling and mitochondrial activities.


Figures

Fig. 1
Fig. 1. Measurement of H2O2 Nanodomains with Inducible Targeting
(A) Scheme depicting the targeting of fluorescent proteins to the surface of the endoplasmic reticulum (ER-M; green) and the OMM (red) with FRB and FKBP linker halves linked to the targeting sequences sac1(521–587) and mAKAP1(34–63), respectively (upper). Rapamycin-induced heterodimerization of linker halves causes concentration of the dimers at the ER-mitochondrial interface (lower). For further details see (Csordas et al., 2010). (B) Images of HepG2 cells and co-localization analysis showing that heterodimerization of linker halves progressively changes the distribution of the ER-surface targeted probe (ER-M CFP-FRB; cyan) to co-localize (right; CFP-RFP, squares) with OMM targeted probes (OMM-mRFP-FKBP; red) and separate from ER-lumen targeted GFP (ER-lumen GFP; green) in response to rapamycin (ER-M CFP-FRB; cyan, lower). Further changes in probe distribution are blocked by rapamycin removal and addition of FK506 (5 µM). The overall ER structure (green) remains essentially unchanged by rapamycin treatment. (C) Distribution of ER-surface H2O2-sensor HyPer (ER-HyPer-FRB; green) before and after heterodimerization with OMM-mRFP–FKBP (red). Images collected before (upper) and after rapamycin (100 nM for 5min; lower). (D) Response of interface-targeted HyPer (black) and H2O2 insensitive derivative SypHer (gray), to H2O2 (200 µM) and dithiothreitol (DTT; 5 mM) (mean±SEM, n = 48 cells). (E) Measurements using HyPer and SypHer targeted to the cytosol, ER lumen, mitochondrial matrix, cytosolic surface of the ER (ER-M) and OMM. (* = p < 0.05; n = 3 experiments >50 cells/condition). See also Figure S1.
Fig. 2
Fig. 2. ER-mitochondrial H2O2 nanodomains are induced by agonist stimulation
(A) Global [Ca2+]c rise (top) and ratio changes of interface-targeted HyPer (black) and SypHer (gray) (bottom) evoked by simultaneous stimulation with an IP3-linked agonist, (ATP, 100 µM) and the SERCA pump inhibitor, thapsigargin (Tg, 2 µM) are shown (mean±SEM). H2O2 is added as a positive control (20 µM). Both HyPer and SypHer respond to pH changes that accompany [Ca2+]c signals: changes common to both probes are attributable to pH, changes seen in HyPer only are caused by H2O2. Based on the study of Poburko et al. (Poburko et al., 2011) and our results we conclude that an acidification followed by an alkalization occurred during stimulation. Such changes underscore the need for parallel fluorescence recordings using HyPer and SypHer when one wants to measure H2O2. (B) (top) [Ca2+]c rise and (bottom) mean HyPer/SypHer ratios of probes concentrated at the interface (black, n = 59) or diffused along the entire OMM (yellow, n = 41) or ER-M (blue, n = 41). (C) (top) Global [Ca2+]c rise and (bottom) HyPer (black) and SypHer (gray) ratio changes evoked by stimulation with Tg (2 µM) alone, shown (mean±SEM). (D) Quantitation of H2O2 increase as the area under curve (AUC) ((HyPer/SypHer × time)response - (HyPer/SypHer × time)baseline; * p = < 0.05). From cells treated with ATP&Tg or Tg alone. See also Figure S2.
Fig. 3
Fig. 3. IP3 Receptor-mediated ER Ca2+ Mobilization and Mitochondrial Respiratory Chain Cunction are Required for the Generation of H2O2 Nanodomains
HepG2 cells expressing ER-M HyPer and OMM HyPer or ER-M SypHer and OMM SypHer were all subjected to a pulse of rapamycin (100 nM, 5 mins) and an FK506 wash (5 µM) to target the probes to the ER-mitochondrial interface. Traces are presented as HyPer/SypHer ratios. (A) Carbachol (CCh, 100 µM) plus thapsigargin (Tg, 2 µM) or (B) ATP (100 µM) alone, in control cells (black, n = 108 and 78, respectively) and DTT pre-treated cells (5 mM, green, n = 44 and 50, respectively) on the time course of interface-targeted HyPer/SypHer ratios. (C) Pre-incubation with Gpx analog Ebselen (25 µM; orange, n = 68) abolishes agonist-induced response (black, n = 231). (D) Area under curve (AUC) quantification of interface H2O2 in response to agonist ±Tg, DTT and ebselen. Prevention of the interface H2O2 nanodomains by (E) discharge of ER Ca2+ using 0 Ca2+ extracellular medium supplemented with Tg (2 µM) (yellow, n = 87), (F) antimycin A (5 µM) and rotenone (5 µM 10 mins; red, n = 121) or (G) FCCP (5 µM) and oligomycin (10 µM; blue, n = 133). All were compared to control (black, n = 132). (G) AUC quantification of interface H2O2 following pre-treatment with 0 Ca2+ & Tg (yellow), antimycin A & rotenone (red) and FCCP & oligomycin (blue). See also Figure S3.
Fig. 4
Fig. 4. Matrix and Cristae Volume Changes in Response to Agonist Stimulation
(A) Electron tomography of a HepG2 cell. Mitochondrial volume (green), cristae (magenta) and ER (red). Both dilated and collapsed cristae are shown. Note orientation of several cristae openings to the ER-mitochondrial interface. Representative of 7 datasets. (B) Transmission electron microscopy images of single HepG2 mitochondria false colored to highlight ER (red) mitochondrial matrix (green) and cristae (magenta) ± ATP stimulation (100 µM for 1 min). The scale bar is 100 nm. (C) Frequency of wide cristae (>30 nm) were measured in control (gray) and ATP-stimulated conditions (black). Agonist stimulation was applied to cells pre-incubated with an inhibitor of mitoBKCa (paxilline 25µM; purple) or treated with a non-depolarizing concentration of the K+-ionophore (valinomycin 0.5 nM; pink) alone. Ctrl vs ATP and Ctrl vs Valino are p = < 0.05, ANOVA. (D) (top) [Ca2+]c (black), was measured simultaneously with [Ca2+]m (dark red). (bottom) In parallel, measurements were made with interface-targeted HyPer (mean±SEM). Cells were stimulated with agonist (ATP; 100 µM) in control conditions (black, n = 116) after pre-treatment with mitoBKCa inhibitor (paxilline; 25µM, purple, n = 98) after K+ ionophore (“V” valinomycin; 0.5 nM, 60 s, pink, n = 91). H2O2 is added at the end of the experiment as a positive control (20 µM). See also Figure S4.
Fig. 5
Fig. 5. Cristae-derived ROS modulates Ca2+-release
(A) Cells expressing Killer Red (KR) targeted to the interface with drug-inducible linker (black, red & orange; mean±SEM) or to the nucleus (blue) were stage-incubated in the dark (300 s, Ctrl, black) or with green light (545/25 nm, 300 s, red, orange and blue) to induce KR-derrived ROS. [Ca2+]c was assessed in response to stepwise increase in IP3-linked agonist concentration (loATP, 1 µM; hiATP, 100 µM) in the absence of external Ca2+. Cells were assessed for response to loATP, after illumination and pre-incubation with the ebselen (25 µM, orange). Responses to loATP were quantified (right panel, % response loATP; Ctrl, black, n = 61; Illuminated, red, n = 64). Ebselen, (orange, n = 62). Nucleus, (blue, n = 122) (* p = < 0.05). (B) Sample traces of cells assessed for repetitive [Ca2+]c spiking without treatment (Ctrl., left) or pre-incubated with mitoBKCa inhibitor (paxilline, 25 µM, center). Quantification of responsive cells ([Ca2+]c spikes ≥ 1 following loATP) demonstrating repetitive (>1) [Ca2+]c spikes in response to loATP, (right, Mean±SEM and means of individual experiments). (C) Percent of cells showing [Ca2+]c response to loATP when transfected with pcDNA (n = 106) or a constitutive OMM-plasma membrane linker (AKAP-RFP-CAAX, n = 94). (D) Scheme of hypothesis; IMS and cristae volume (purple), Ca2+ transport proteins (gray) and mitoBKCa (white). ER Ca2+ release events (center) increase matrix Ca2+, activate K+-uptake and increase matrix volume. H2O2-rich cristae volume is forced to the ER-mitochondrial interface.

Comment in

References

    1. Aon MA, Cortassa S, Marban E, O'Rourke B. Synchronized whole cell oscillations in mitochondrial metabolism triggered by a local release of reactive oxygen species in cardiac myocytes. The Journal of biological chemistry. 2003;278:44735–44744. - PubMed
    1. Araki K, Iemura S, Kamiya Y, Ron D, Kato K, Natsume T, Nagata K. Ero1-alpha and PDIs constitute a hierarchical electron transfer network of endoplasmic reticulum oxidoreductases. The Journal of cell biology. 2013;202:861–874. - PMC - PubMed
    1. Bader M, Muse W, Ballou DP, Gassner C, Bardwell JC. Oxidative protein folding is driven by the electron transport system. Cell. 1999;98:217–227. - PubMed
    1. Bansaghi S, Golenar T, Madesh M, Csordas G, Ramachandrarao S, Sharma K, Yule DI, Joseph SK, Hajnoczky G. Isoform- and Species-specific Control of Inositol 1,4,5-Trisphosphate (IP3) Receptors by Reactive Oxygen Species. The Journal of biological chemistry. 2014;289:8170–8181. - PMC - PubMed
    1. Belousov VV, Fradkov AF, Lukyanov KA, Staroverov DB, Shakhbazov KS, Terskikh AV, Lukyanov S. Genetically encoded fluorescent indicator for intracellular hydrogen peroxide. Nature methods. 2006;3:281–286. - PubMed

Publication types

MeSH terms