. 2015 Feb:1:32-39.
doi: 10.1016/j.cobeha.2014.08.003. Epub 2014 Aug 30.

Functions of the human frontoparietal attention network: Evidence from neuroimaging

Affiliations

Functions of the human frontoparietal attention network: Evidence from neuroimaging

Miranda Scolari et al. Curr Opin Behav Sci. 2015 Feb.

Abstract

Human frontoparietal cortex has long been implicated as a source of attentional control. However, the mechanistic underpinnings of these control functions have remained elusive due to limitations of neuroimaging techniques that rely on anatomical landmarks to localize patterns of activation. The recent advent of topographic mapping via functional magnetic resonance imaging (fMRI) has allowed the reliable parcellation of the network into 18 independent subregions in individual subjects, thereby offering unprecedented opportunities to address a wide range of empirical questions as to how mechanisms of control operate. Here, we review the human neuroimaging literature that has begun to explore space-based, feature-based, object-based and category-based attentional control within the context of topographically defined frontoparietal cortex.


Figures

Figure 1
Figure 1
Topographic maps in the human visual system. (a) A single subject’s activation pattern displayed on an inflated view of the right hemisphere (here, activation has been restricted to emphasize frontoparietal cortex), derived from a memory-guided saccade task. The task utilizes a traveling wave paradigm that combines covert shifts of attention, working memory and saccadic eye movements (see [48,46] for a detailed description of the design and analysis). The color wheel at center indicates the region of visual space to which each color in the activation map corresponds. (b) Same as (a), but presented on a flat surface, thereby depicting the topographic organization of the entire visual system. (c) Parcellated regions in frontoparietal cortex with drawn boundaries, based on topographic mapping. The boundaries between intraparietal sulcus (IPS) regions as well as superior parietal lobule (SPL1) are defined according to reversals in the representation of space along the upper and lower vertical meridians (see text in Box 1). Retinotopically mapped regions in visual cortex are included as well to illustrate the anatomical relationship between sources of attentional control and modulation sites (see section ‘Introduction’). (d) Same as (c), but presented on a flat surface.
Figure 2
Figure 2
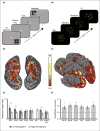
Space-based and feature-based attention in the frontoparietal network. (a) Schematic of the experimental design for a space-based attention task [6••]. Subjects were precued to alternately attend to a peripheral stimulus in one of four quadrants (attend condition), or to attend to fixation and ignore the stimulus (unattend condition). (b) Activation pattern resulting from a contrast of the ‘attend’ and ‘unattend’ conditions. (c) Attentional weight indices from each topographic frontoparietal region (N = 9), defined as the difference of the peak BOLD response from the contralateral and ipsilateral attend conditions, divided by the sum. Note that all regions, apart from left SPL1, exhibit significant contralateral biases (see section ‘Models of space-based selection’). (d) Schematic of the experimental design for a feature-based attention task [24••]. Subjects were precued to attend to either the red (‘R’) or green (‘G’) dots or neither (‘N’). The task was to detect small luminance increments in the cued color. (e) Brain areas modulated by feature-based attention. (f) Mean classifier accuracy (N = 6) in the color experiment. All ROIs but medial superior frontal gyrus (mSFG) carried information about which color was currently held in the attentional set. aIPS = anterior intraparietal sulcus; vPCS = ventral precentral sulcus. (a–c) adapted from [6••]. (d–f) adapted from [24••].
Figure 3
Figure 3
Functional separation in the frontoparietal network. An adaptation of the functional connectivity results described in Figure 2 of [42••] (see section ‘Distributed connectivity profiles across the frontoparietal control network’ for more details of the experiment). Directional connectivity was estimated using multivariate autoregressive modeling (MVAR). Black lines and corresponding values reflect significant MVAR patterns within the control network with respect to viewer-centered representations (arrow endpoint indicates the direction of causal influences). Conversely, white lines and corresponding values reflect significant MVAR patterns with respect to object-centered representations. These results suggest that topographic subregions of the frontoparietal network represent space in multiple reference frames.

References

    1. Posner MI, Petersen SE. The attention system of the human brain. Annu Rev Neurosci. 1990;13:25–42. - PubMed
    1. Kastner S, Pinsk MA. Visual attention as a multilevel selection process. Cogn Affect Behav Neurosci. 2004;4:483–500. - PubMed
    1. Kastner S, Pinsk MA, De Weerd P, Desimone R, Ungerleider LG. Increased activity in human visual cortex during directed attention in the absence of visual stimulation. Neuron. 1999;22:751–761. - PubMed
    1. Moore T, Armstrong KM. Selective gating of visual signals by microstimulation of frontal cortex. Nature. 2003;421:370–373. - PubMed
    1. Silver MA, Kastner S. Topographic maps in human frontal and parietal cortex. Trends Cogn Sci. 2009;13:488–495. - PMC - PubMed

LinkOut - more resources